Have you ever wondered how a simple spreadsheet software could be the backbone of success for businesses around the world? In the fast-paced and data-driven landscape of modern business, Microsoft Excel emerges as a silent hero, transforming raw data into actionable insights and driving efficiency in every corner of the corporate world. In this guide, we’ll explore the profound importance of Excel in business, unraveling its multifaceted role in data management, analysis, financial planning, and much more. Discover how Excel is not just a tool but a strategic ally that empowers businesses to thrive in today’s competitive marketplace.
Overview of Excel
Microsoft Excel, commonly referred to as Excel, is a powerful spreadsheet application that has become a cornerstone of modern business operations. Developed by Microsoft, Excel offers a versatile platform for creating, analyzing, and visualizing data. It features a grid of rows and columns where users can input, manipulate, and calculate numerical and textual information. Excel’s intuitive interface, combined with its extensive range of functions and features, has made it an indispensable tool for businesses of all sizes and industries.
Excel’s core functionality includes data organization, calculation, data analysis, and reporting. Users can create spreadsheets to manage financial data, track sales, inventory, and perform a wide array of calculations. Additionally, Excel provides tools for data visualization through charts and graphs, facilitating clearer communication of insights and trends.
The Importance of Excel in Business
Excel has earned its place as a cornerstone of business operations for several compelling reasons. Its versatility and robust capabilities extend beyond mere number crunching, making it an indispensable tool for businesses across the globe. Here’s an in-depth look at why Excel holds such significance in the business world:
1. Data Organization and Management
Excel’s grid-like structure provides an intuitive way to organize data. It enables businesses to store vast amounts of information systematically, making it readily accessible for analysis, decision-making, and reporting. With Excel, you can create databases, manage customer records, track inventory, and maintain employee databases with ease. Its data management capabilities enhance efficiency and accuracy in day-to-day operations.
2. Streamlined Analysis and Reporting
One of Excel’s greatest strengths lies in its ability to analyze data and generate reports. It offers a wide array of functions and formulas that allow businesses to perform complex calculations, create insightful graphs and charts, and summarize data in a comprehensible manner. Whether it’s financial analysis, sales trends, or market research, Excel empowers users to derive valuable insights from raw data, aiding in strategic planning and informed decision-making.
3. Budgeting and Financial Planning
Excel is a go-to tool for budgeting and financial modeling. It enables businesses to create detailed budgets, forecast revenue and expenses, and perform sensitivity analysis. By building financial models and scenarios, organizations can evaluate the potential impact of various strategies and make financially sound decisions. This level of financial control is vital for managing resources, optimizing investments, and ensuring long-term sustainability.
4. Automation and Efficiency
Excel’s automation features, including macros and Visual Basic for Applications (VBA), allow businesses to automate repetitive tasks and workflows. This leads to significant time savings and reduces the risk of errors. Customized macros can perform tasks like data cleaning, report generation, and even complex financial modeling, freeing up valuable human resources for more strategic activities.
5. Data Visualization and Communication
Excel’s charting and graphing capabilities facilitate effective data visualization, making it easier to communicate insights and trends to stakeholders. Whether it’s creating bar graphs to represent sales figures or pie charts to illustrate market share, Excel’s visual tools enhance the clarity and impact of presentations, reports, and dashboards.
6. Collaboration and Teamwork
Excel’s collaborative features, especially in cloud-based environments like Microsoft 365, enable real-time collaboration among team members. Multiple users can work on the same spreadsheet simultaneously, facilitating teamwork, brainstorming, and content review. Excel’s commenting and sharing features enhance communication within the organization and with external partners.
7. Customization and Adaptability
Excel is highly customizable, allowing businesses to tailor spreadsheets, templates, and reports to their specific needs. Whether you require industry-specific templates, specialized calculations, or branded reports, Excel can be adapted to align with your unique business requirements.
8. Cost-Effective Solution
Excel is a cost-effective solution for businesses of all sizes. It doesn’t require substantial upfront investments in software licenses or specialized training. Its widespread availability and ease of use make it accessible to startups and small businesses, leveling the playing field in terms of data analysis and reporting capabilities.
Excel’s importance in business is rooted in its capacity to empower organizations with efficient data management, in-depth analysis, and effective communication. Whether you’re a small startup or a multinational corporation, Excel is a versatile and invaluable tool that fosters better decision-making, enhances productivity, and ultimately contributes to the success and growth of businesses in various industries. Its adaptability and enduring relevance ensure that Excel remains a cornerstone of business operations in the digital age.
Excel Basics for Business
When it comes to using Excel in business, having a solid understanding of its fundamental features is essential. Let’s explore these Excel basics to help you navigate this powerful tool with confidence.
Excel Interface
The Excel interface is your command center, where you’ll find all the tools and functions you need to work efficiently. It might appear overwhelming at first, but it’s designed to streamline your tasks once you get the hang of it. Here’s what you need to know:
- Ribbon: Located at the top, it houses tabs like Home, Insert, Page Layout, Formulas, Data, and more. Each tab contains specific commands and options related to different aspects of Excel.
- Worksheets: These are the individual pages within a workbook where you input, organize, and manipulate your data. You can have multiple worksheets in a single workbook, making it easy to manage various sets of information.
- Cells: Think of cells as the building blocks of Excel. They are the small squares formed by the intersection of rows and columns. Each cell can contain text, numbers, formulas, or functions.
- Formulas Bar: Situated just below the Ribbon, the Formulas Bar is where you input and edit formulas to perform calculations and data manipulation.
Creating and Saving Workbooks
Creating and saving workbooks are the first steps in Excel. These actions allow you to start working on your projects and ensure your data is secure. Here’s how to do it:
- To create a new Excel workbook, open Excel and click on “File” in the upper left corner. Then select “New” and choose “Blank Workbook.” You’ll have a fresh canvas to work on.
- When it comes to saving your work, click on “File” again, but this time select “Save As.” You can then specify the file name and choose the location where you want to save it. Excel provides different formats (e.g., .xlsx) for saving your files.
Navigating Worksheets
Efficiently navigating through worksheets is crucial for managing data and working on various aspects of your project. Excel offers simple yet effective ways to switch between worksheets and keep your work organized. Here’s how:
- Sheet Tabs: These are located at the bottom of your Excel window and represent individual worksheets in your workbook. You can click on these tabs to switch between worksheets quickly.
- Renaming Tabs: Right-click on a sheet tab to rename it. Renaming worksheets helps you identify their content easily.
- Color Coding Tabs: To further enhance organization, you can assign different colors to sheet tabs. Right-click on a tab, select “Tab Color,” and choose a color that corresponds to the type of data or purpose of the worksheet.
Data Entry and Formatting
Excel’s versatility shines when it comes to data entry and formatting. It allows you to input various types of data and format it to meet your specific needs. Here’s what you should know:
- Data Entry: To enter data, simply click on a cell and start typing. Excel accepts text, numbers, dates, and more.
- Formatting Options: Excel offers a wide range of formatting options to make your data visually appealing and easy to understand. You can change font styles, apply cell borders, add background colors, and much more. These formatting options are available in the “Home” tab of the Ribbon.
Formulas and Functions
Formulas and functions are at the core of Excel’s power. They allow you to perform calculations, manipulate data, and automate processes. Here’s a brief overview:
- Formulas: Formulas in Excel begin with an equal sign (=) and can contain various mathematical operators (+, -, *, /) and cell references. For example, to add the contents of cells A1 and A2, you would use the formula:
- Functions: Functions are predefined formulas that simplify complex calculations. Excel offers a vast library of functions for various purposes, such as SUM, AVERAGE, VLOOKUP, and more. Functions save you time and ensure accuracy in your calculations.
Data Validation
Data validation is a crucial feature that helps maintain data accuracy and consistency in your Excel spreadsheets. It allows you to set rules and restrictions for what can be entered in specific cells. Here’s how to use it:
- You can create dropdown lists to ensure that users select valid options.
- Specify data types to ensure that entries are in the correct format (e.g., dates, percentages).
- Limit data entries to a certain range or set of values.
- Add custom error messages to guide users when they enter incorrect data.
With a solid grasp of these Excel basics, you’ll be well-prepared to dive deeper into the world of business data management and analysis. Excel’s capabilities extend far beyond these fundamentals, so stay curious and eager to explore its advanced features to excel in your business endeavors.
Data Analysis and Visualization
Data analysis and visualization are at the heart of Excel’s capabilities. We’ll explore how Excel empowers you to organize, dissect, and present data in a meaningful way, helping you gain valuable insights and make informed business decisions.
Sorting and Filtering Data
Sorting and filtering are fundamental data manipulation techniques that allow you to arrange and isolate data according to your specific criteria. Excel provides easy-to-use tools for this purpose:
- Sorting: Excel lets you sort data in ascending or descending order based on one or multiple columns. This is particularly useful for organizing data chronologically, numerically, or alphabetically.
- Filtering: Filtering helps you focus on specific subsets of your data. By applying filters, you can display only the information that meets certain conditions. For example, you can filter sales data to view only transactions from a particular region or time period.
PivotTables and PivotCharts
PivotTables and PivotCharts are advanced tools that enable you to summarize, analyze, and visualize large datasets effortlessly. They are particularly valuable when dealing with complex data structures:
- PivotTables: A PivotTable allows you to create dynamic tables that summarize data based on your preferences. You can quickly transform raw data into meaningful insights by dragging and dropping fields to rows, columns, and values areas.
- PivotCharts: Complementing PivotTables, PivotCharts provide visual representations of your summarized data. You can choose from various chart types, such as bar charts, line graphs, and pie charts, to illustrate your findings effectively.
Conditional Formatting
Conditional formatting in Excel is a powerful feature that enhances data visualization by applying formatting rules to cells based on their values. This not only makes your data more visually appealing but also helps you identify patterns and outliers:
- Color Scales: You can use color scales to shade cells with different colors based on their values. For instance, a gradient of colors can indicate temperature variations or performance levels.
- Icon Sets: Icon sets allow you to add icons like arrows, flags, or symbols to cells, providing a quick visual summary of data trends. For example, you can use icons to denote priority levels or progress status.
- Data Bars and Sparklines: Data bars create horizontal bars within cells to represent values, while sparklines are miniature charts that fit within a single cell, showing trends or variations.
Charts and Graphs
Charts and graphs are essential tools for presenting data in a visually appealing and understandable format. Excel offers a wide variety of chart types to suit different data and reporting needs:
- Bar Charts: Ideal for comparing values across categories or time periods.
- Line Graphs: Used to show trends, changes, or patterns over time.
- Pie Charts: Useful for displaying the composition of a whole, such as market share or budget allocation.
- Scatter Plots: Depict relationships and correlations between two sets of data.
- Heat Maps: Visualize data density and patterns using color gradients.
Excel’s charting capabilities allow you to customize elements like titles, axes, labels, and legends, ensuring that your data is presented in a clear and compelling manner.
Data Trends and Insights
Analyzing data trends and gaining insights is a fundamental aspect of decision-making in business. Excel provides various tools and functions to help you identify patterns and draw meaningful conclusions from your data:
- Moving Averages: Moving averages help smooth out fluctuations in data, making it easier to spot trends. You can calculate moving averages using Excel’s built-in functions.
- Regression Analysis: Excel offers regression analysis tools to determine the relationships between variables. It’s particularly valuable for predicting future trends based on historical data.
- Data Tables: Data tables enable you to perform what-if analyses by changing input values and instantly observing their effects on calculated results. This is invaluable for scenario planning and sensitivity analysis.
By mastering data analysis and visualization techniques in Excel, you’ll be equipped to uncover actionable insights that can drive business growth, optimize processes, and make strategic decisions with confidence. Excel’s capabilities in this area are vast, so continue to explore and experiment with different tools and features to unlock the full potential of your data.
Financial Analysis with Excel
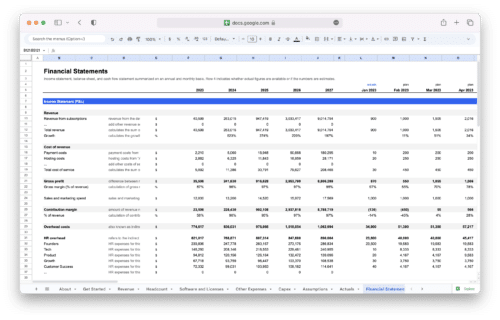
In the world of business, financial analysis is the compass that guides decision-making. Excel is a powerhouse when it comes to financial analysis, offering a suite of tools and functions that can help you budget effectively, build complex financial models, assess cash flows, evaluate investments, and make accurate forecasts. Here’s how Excel empowers financial professionals and business leaders.
Budgeting and Financial Modeling
Budgeting and financial modeling are essential for every organization, from small businesses to large corporations. Excel’s flexibility and computational capabilities make it an ideal platform for creating detailed budgets and intricate financial models.
- Budgeting: Excel enables you to plan and manage budgets efficiently. You can create income statements, balance sheets, and cash flow projections. By linking various spreadsheets and using formulas, you can track expenses, revenue, and financial goals.
- Financial Modeling: Financial models in Excel can simulate different scenarios and help in decision-making. You can model complex financial structures, evaluate potential investments, and analyze the impact of changing variables on your financial performance.
To illustrate, let’s consider a simple budgeting example:
Income:
Sales Revenue: $50,000
Other Income: $2,000Expenses:
Salaries: $20,000
Rent: $5,000
Utilities: $1,500
Marketing: $3,000
Total Expenses: =SUM(B3:B6)
Financial Functions
Excel is loaded with financial functions that streamline various calculations commonly used in finance and accounting. These functions save time and reduce errors by providing accurate results automatically.
- NPV (Net Present Value): Calculate the present value of a series of cash flows, helping you determine the profitability of an investment or project.
- IRR (Internal Rate of Return): Find the discount rate at which the net present value of cash flows equals zero. IRR helps assess the attractiveness of an investment.
- PMT (Payment): Calculate periodic payments for loans or mortgages, factoring in interest rates, loan amounts, and durations.
Here’s an example of using the PMT function to calculate monthly mortgage payments:
=PMT(0.04/12, 360, 200000)
Cash Flow Analysis
Cash flow analysis is critical for understanding a company’s financial health. Excel simplifies this process by providing tools to analyze cash inflows and outflows over time.
- Operating, Investing, and Financing Activities: Categorize cash flows into these three key areas. Operating activities involve day-to-day transactions, while investing and financing activities include investments and financial transactions.
- Cash Flow Statements: Excel allows you to create cash flow statements that detail cash flow from operating, investing, and financing activities. These statements provide insights into liquidity and financial stability.
Investment Evaluation
Excel facilitates investment evaluation by helping you assess the potential returns and risks associated with different investment opportunities.
- Payback Period: Calculate the time it takes for an investment to generate returns equal to the initial investment. A shorter payback period is generally more favorable.
- ROI (Return on Investment): Determine the return on investment by comparing the gain or loss from an investment relative to its cost. ROI is expressed as a percentage.
Forecasting
Excel’s forecasting capabilities are indispensable for business planning and strategy development. You can use historical data to make informed predictions about future performance.
- Moving Averages: Excel allows you to calculate moving averages, which smooth out fluctuations in data, making it easier to identify trends and patterns.
- Regression Analysis: Use regression analysis to understand the relationship between variables and make predictions based on historical data.
Financial analysis with Excel empowers businesses to make informed financial decisions, allocate resources effectively, and achieve financial goals. Whether you’re creating budgets, evaluating investments, or forecasting future performance, Excel’s robust features provide the tools you need to navigate the complex world of finance with confidence.
Data Management and Collaboration
Effective data management and collaboration are paramount in the modern business environment. Excel not only excels at analyzing data but also offers robust features for handling data efficiently and fostering collaboration among team members.
Data Import and Export
Data often originates from various sources, and Excel makes it seamless to import and export data in different formats. Whether you’re gathering data from external sources or sharing your insights with others, Excel provides versatile options:
- Data Import: Excel allows you to import data from sources like databases, text files, CSV files, and even online platforms. You can use features like Power Query to clean and transform imported data, ensuring it’s ready for analysis.
- Data Export: Conversely, you can export Excel data to various formats such as PDF, CSV, or even share it directly through cloud-based services like OneDrive or SharePoint. This flexibility ensures that your data can be accessed and utilized in different contexts.
Data Consolidation
Data consolidation is essential when you need to combine information from multiple sources or worksheets. Excel offers several techniques for consolidating data efficiently:
- Consolidation Functions: Excel provides functions like SUMIFS, COUNTIFS, and AVERAGEIFS that allow you to consolidate data based on specific criteria. For example, you can sum values from multiple worksheets that meet specific conditions.
- PivotTables: PivotTables are invaluable for consolidating and summarizing large datasets. You can consolidate data from multiple worksheets or workbooks and create dynamic reports with ease.
Data Security and Protection
Maintaining the security and integrity of your data is a top priority. Excel provides a range of security features to safeguard your sensitive information:
- Password Protection: You can password-protect your Excel files to restrict unauthorized access. Assign passwords for opening the file and for modifying it separately.
- Encryption: Excel offers encryption options to secure your workbook, making it challenging for unauthorized users to decipher the data.
- Cell and Sheet Protection: You can lock specific cells or entire sheets to prevent accidental changes or unauthorized edits. This is particularly useful when sharing worksheets with others.
Collaborative Work in Excel
Excel’s collaborative features are designed to enhance teamwork and streamline joint projects:
- Real-Time Co-Authoring: With Microsoft 365, multiple users can collaborate on an Excel workbook simultaneously. You can see each other’s changes in real time, which is invaluable for teamwork and brainstorming.
- Comments and Annotations: Excel allows users to leave comments and annotations on cells, making it easy to discuss specific data points or calculations without altering the original content.
- Track Changes: The Track Changes feature helps you keep a record of edits made by different users. It’s useful when you need to review and approve changes before finalizing a document.
Sharing and Permissions
Controlling who can access, edit, or share your Excel files is crucial, especially when collaborating with colleagues or sharing data with external stakeholders:
- Shareable Links: Excel enables you to generate shareable links that can be sent to others via email or messaging apps. You can set permissions to control whether recipients can view, edit, or comment on the document.
- Permissions Management: Within Microsoft 365, you can manage permissions for your Excel files, specifying who has access and what level of access they have. You can also revoke access when necessary.
Efficient data management and collaboration in Excel not only streamline your workflows but also ensure the security and integrity of your data. Excel’s versatility in importing, consolidating, and protecting data, coupled with its collaborative features, makes it an indispensable tool for businesses of all sizes.
Automation and Efficiency
In the fast-paced world of business, time is of the essence, and efficiency is the key to success. Excel offers a plethora of tools and techniques to automate repetitive tasks, enhance productivity, and tailor the software to your unique needs.
Macros and VBA Programming
Automation begins with macros and Visual Basic for Applications (VBA) programming. These powerful tools allow you to record and write scripts that execute a series of actions automatically:
- Macros: Excel’s macro recorder lets you record your actions and create a reusable script. For example, you can record a macro to format data consistently or perform complex calculations with a single click.
- VBA Programming: For more advanced automation, VBA allows you to write custom scripts and functions. You can create user-defined functions (UDFs) tailored to your specific business needs. VBA is the gateway to unlimited customization and automation in Excel.
Here’s an example of a simple Excel macro that calculates the sum of a selected range:
Sub CalculateSum()

Selection.Formula = "=SUM(Selection)"

End Sub
Excel Add-Ins
Excel add-ins are third-party extensions that can enhance Excel’s functionality in various ways. They provide specialized tools and features that streamline specific tasks:
- Data Analysis Add-Ins: Tools like Power Query and Power Pivot expand Excel’s data analysis capabilities, allowing you to connect to various data sources, clean data, and create advanced data models.
- Reporting Add-Ins: Add-ins such as Tableau or Power BI can integrate seamlessly with Excel, helping you create interactive and visually appealing reports and dashboards.
- Specialized Add-Ins: Depending on your industry or specific needs, you can find add-ins for finance, marketing, project management, and more. These add-ins often come with pre-built templates and functionalities tailored to your niche.
Templates and Customization
Excel templates are pre-designed spreadsheets that can save you time and effort. You can use them as a starting point for various tasks, such as project management, budgeting, or financial analysis:
- Built-In Templates: Excel provides a wide range of built-in templates for common business tasks. You can access these templates directly from the Excel interface.
- Custom Templates: Creating custom templates tailored to your specific needs can significantly boost productivity. You can design templates with predefined formulas, formatting, and data validation.
Productivity Tips and Tricks
Boosting your productivity in Excel often involves mastering shortcuts and lesser-known features. Here are some productivity tips and tricks:
- Keyboard Shortcuts: Excel offers a plethora of keyboard shortcuts to perform tasks quickly. For instance, Ctrl+C for copy, Ctrl+V for paste, or Ctrl+Z for undo.
- Named Ranges: Naming cell ranges can make your formulas more readable and efficient. You can use names in formulas instead of cell references.
- Data Validation Lists: Create drop-down lists in cells to ensure data accuracy and consistency. This is especially useful for data entry tasks.
- Conditional Formatting Rules: Leveraging conditional formatting can highlight important trends or outliers in your data automatically.
- Excel Online and Mobile Apps: Consider using Excel’s online and mobile versions for on-the-go access to your spreadsheets. You can edit and collaborate on files from anywhere.
Efficiency in Excel goes beyond basic usage. By mastering automation, leveraging add-ins, customizing templates, and adopting productivity tricks, you can supercharge your Excel skills and become a more effective and efficient business professional. The time saved and improved accuracy will translate into more productive workdays and better decision-making.
Excel in Different Business Functions
Excel is a versatile tool that transcends industry boundaries, making it indispensable in various business functions. From sales and marketing to human resources and project management, Excel plays a pivotal role in streamlining processes, analyzing data, and making informed decisions. Here’s how Excel is harnessed across different business functions.
Sales and Marketing
Excel is a powerful ally for sales and marketing professionals. It aids in data analysis, reporting, and strategy development:
- Data Analysis: Sales and marketing teams can use Excel to analyze customer data, track sales performance, and identify trends. You can generate reports that help target specific customer segments or assess the effectiveness of marketing campaigns.
- Lead Management: Excel can be used to manage leads, track interactions, and forecast sales. With formulas and sorting capabilities, you can prioritize leads based on various criteria.
- Campaign Budgeting: Excel is an excellent tool for budgeting marketing campaigns. You can create budget templates, monitor expenses, and calculate return on investment (ROI).
Human Resources
Excel simplifies HR tasks, from employee data management to payroll calculations:
- Employee Records: HR departments can maintain employee records, including personal information, job history, and performance data in Excel spreadsheets. Sorting and filtering features help organize this information efficiently.
- Payroll and Benefits: Excel’s built-in functions and formulas are invaluable for calculating payroll, tax deductions, and employee benefits. It can automate complex calculations and generate pay stubs.
- Recruitment and Onboarding: Excel can be used to track job applicants, schedule interviews, and manage the onboarding process. It’s particularly useful for organizing candidate data and interview schedules.
Finance and Accounting
Finance and accounting professionals heavily rely on Excel for financial analysis, reporting, and budgeting:
- Financial Statements: Excel excels in creating financial statements, including income statements, balance sheets, and cash flow statements. Formulas ensure the accuracy of these reports.
- Financial Modeling: Excel’s financial modeling capabilities are invaluable for scenario analysis and forecasting. Professionals can build intricate financial models to evaluate different business strategies.
- Audit Trails: Excel’s audit trail features help maintain data integrity by tracking changes made to spreadsheets. This is crucial for regulatory compliance and internal controls.
Operations and Inventory
Excel aids operations and inventory management by providing tools to optimize supply chains, track inventory levels, and monitor production schedules:
- Inventory Management: Excel can track inventory levels, reorder points, and manage stockouts. It’s particularly useful for small and medium-sized businesses that may not use specialized inventory software.
- Supply Chain Optimization: Businesses can use Excel to analyze supply chain data, identify bottlenecks, and make decisions regarding sourcing, production, and distribution.
- Production Planning: Excel’s capacity planning tools help schedule production runs, allocate resources, and maintain an efficient production process.
Project Management
Project managers rely on Excel for planning, tracking progress, and creating project timelines:
- Gantt Charts: Excel is a popular choice for creating Gantt charts, which visually represent project schedules and dependencies. These charts help project managers allocate resources effectively and keep projects on track.
- Task Lists: Excel can be used to create task lists, assign responsibilities, and track progress. Conditional formatting can highlight overdue tasks or completed milestones.
- Resource Allocation: Project managers can use Excel to allocate resources and manage budgets. It’s an efficient way to ensure that projects are delivered on time and within budget.
Excel’s adaptability and wide range of features make it an invaluable tool in different business functions. Whether you’re analyzing sales data, managing HR records, conducting financial analysis, optimizing operations, or overseeing projects, Excel empowers professionals across various industries to work more efficiently and make data-driven decisions.
Examples of Excel in Business
Let’s delve into real-world examples to understand how Excel is harnessed across various business functions. These scenarios illustrate Excel’s practical applications and demonstrate how it adds value to organizations:
1. Financial Analysis and Reporting
In finance and accounting, Excel shines as a tool for financial analysis and reporting. A financial analyst, for instance, can use Excel to:
- Create income statements, balance sheets, and cash flow statements with formulas that automatically update when new data is entered.
- Perform sensitivity analysis by changing key variables to assess the impact on profitability and financial stability.
- Build dynamic financial models to evaluate investment opportunities, mergers, or business expansions.
By leveraging Excel in financial analysis, organizations can make well-informed decisions, manage budgets effectively, and communicate financial performance to stakeholders.
2. Sales Forecasting and Inventory Management
Sales and inventory management are areas where Excel’s data handling capabilities come to the forefront. Here’s how it plays out:
- Sales managers use Excel to analyze historical sales data and predict future trends. Time series analysis and moving averages help identify patterns, facilitating accurate sales forecasts.
- Inventory managers rely on Excel to track stock levels, reorder points, and inventory turnover. Conditional formatting can highlight items nearing depletion, ensuring timely restocking.
With Excel’s assistance, businesses optimize inventory, reduce carrying costs, and align production with demand, leading to improved operational efficiency.
3. Human Resources and Payroll Processing
Human resources departments streamline their operations with Excel:
- HR professionals maintain employee records, including personal details, work history, and performance evaluations, in Excel spreadsheets.
- Payroll processing becomes more efficient as Excel handles complex calculations for salary, taxes, and benefits, minimizing errors and ensuring timely and accurate payments.
Excel’s role in HR not only centralizes employee data but also enhances compliance and reporting capabilities.
4. Project Management and Gantt Charts
Project managers rely on Excel to plan, track progress, and visualize project timelines:
- Excel’s Gantt chart templates provide a visual representation of project tasks, their dependencies, and deadlines. Project managers can assign responsibilities, monitor progress, and adjust timelines as needed.
- Through conditional formatting, Gantt charts can be color-coded to indicate task status, making it easy to identify bottlenecks or areas requiring attention.
Excel’s project management capabilities facilitate effective communication, resource allocation, and timely project delivery.
5. Marketing Campaign Analysis
In the realm of marketing, Excel becomes a strategic ally:
- Marketers analyze campaign data, including click-through rates, conversion rates, and return on investment (ROI), using Excel’s functions and pivot tables.
- By creating customized dashboards with charts and graphs, marketing teams visualize performance metrics, helping them make data-driven adjustments to campaigns.
Excel’s role in marketing analytics empowers businesses to optimize marketing strategies, allocate budgets efficiently, and achieve higher ROI.
These examples underscore the versatility and practicality of Excel in business. Whether it’s financial analysis, sales forecasting, HR management, project planning, or marketing analytics, Excel’s capabilities are harnessed across diverse functions to drive efficiency, improve decision-making, and ultimately contribute to the success of organizations worldwide.
Excel in Business Best Practices
To maximize the benefits of using Excel in your business operations, it’s essential to adhere to best practices that enhance efficiency, accuracy, and collaboration. Here are some key guidelines and recommendations for excel best practices:
- Consistent File Naming: Establish a naming convention for your Excel files, making it easy to locate and identify them. Include relevant information like project names, dates, or version numbers.
- Data Validation: Implement data validation rules to ensure data accuracy. Use drop-down lists, date constraints, or specific value ranges to prevent errors during data entry.
- Structured Layout: Organize your spreadsheets with a clear and structured layout. Use headers, subheaders, and cell colors to distinguish data categories and improve readability.
- Avoid Merged Cells: Merged cells can lead to issues when sorting, filtering, or performing calculations. Instead, use the “Center Across Selection” alignment option to achieve a similar visual effect without merging cells.
- Use Named Ranges: Assign names to cell ranges for easier formula writing and improved spreadsheet clarity. Named ranges make your formulas more readable and less prone to errors.
- Consistent Formatting: Maintain consistent formatting throughout your spreadsheets. Standardize fonts, font sizes, and number formats to create a professional and cohesive look.
- Protect Sensitive Data: Implement password protection and encryption for spreadsheets containing sensitive information. Restrict access to authorized personnel only.
- Regular Backups: Regularly back up your Excel files to prevent data loss due to unforeseen issues. Cloud storage or external backups are excellent options.
- Error Checking: Utilize Excel’s built-in error checking tools to identify and resolve formula errors. Pay attention to error messages and review cell references.
- Document Changes: Keep a record of changes made to your spreadsheets. Use Excel’s track changes feature or create an audit trail to maintain data integrity.
- Leverage Spreadsheet Templates: Save time by using pre-designed Excel templates for common business tasks. Templates are available for budgeting, project management, and various other functions.
- Regular Updates: Stay up-to-date with the latest Excel features and updates. New functionalities may provide solutions to previously time-consuming tasks.
- Keyboard Shortcuts: Familiarize yourself with Excel’s keyboard shortcuts to navigate and perform tasks more efficiently. Shortcuts like Ctrl+C for copy and Ctrl+V for paste can save significant time.
- Avoid Excessive Formulas: Complex formulas can slow down spreadsheet performance. Optimize your formulas and consider using helper columns or breaking down complex calculations into simpler steps.
- Documentation: Maintain clear documentation for your spreadsheets, explaining the purpose, assumptions, and methodology used. This helps others understand and use your work effectively.
- Regular Training: Invest in Excel training for yourself and your team. Staying updated on best practices and advanced techniques can unlock Excel’s full potential.
By incorporating these Excel best practices into your daily workflow, you’ll not only improve the quality of your spreadsheets but also boost productivity and collaboration within your organization. Excel’s versatility combined with these guidelines ensures that your business can harness the full power of this essential tool.
Conclusion
Excel stands as a linchpin in the realm of business, providing the essential tools needed to navigate the complex web of data, finances, and decision-making. Its power lies not only in its versatility but also in its ability to streamline processes, foster collaboration, and drive results. Excel’s significance extends far beyond the rows and columns of a spreadsheet—it underpins efficient operations, facilitates informed choices, and ultimately propels businesses towards success.
As businesses evolve in an increasingly data-centric world, Excel remains a steadfast companion, adapting to changing needs and challenges. From startups seeking cost-effective solutions to Fortune 500 companies managing intricate financial models, Excel remains a dependable ally, empowering organizations of all sizes to harness the full potential of their data. In today’s dynamic business landscape, Excel’s importance continues to grow, ensuring that it remains an indispensable tool in the arsenal of business professionals, analysts, and decision-makers.

