Built for Google Sheets
Your next model—without the cold start
Open a workbook with clear tabs, labeled drivers, and layouts you can reshape in minutes—forecasting, P&L, cohorts, and more. Spend energy on the decision, not rebuilding the grid.
Find your template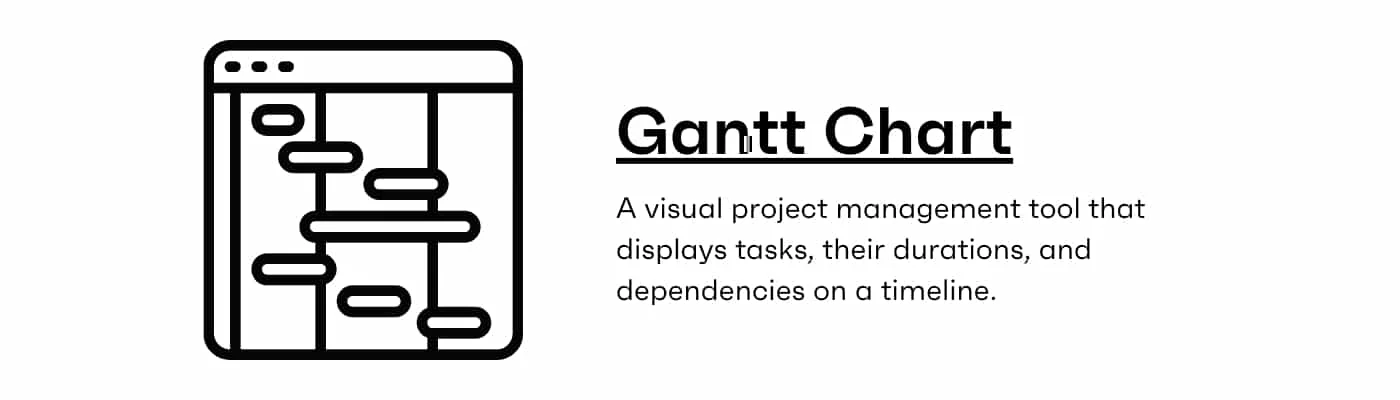
Gantt Chart
Learn to create, use, and benefit from Gantt charts in project management. Streamline tasks, track progress, and succeed with Gantt charts.
Are you looking to master the art of efficient project management and enhance your team's productivity? Dive into this guide on Gantt charts, your key to unlocking streamlined project planning, execution, and monitoring. In the world of project management, Gantt charts are the compass that keeps your projects on course, ensuring you meet deadlines and deliver exceptional results. Explore their history, learn how to create and use them effectively, discover industry-specific applications, and glean expert tips to become a project management maestro.
What is a Gantt Chart?
A Gantt chart is a visual representation of a project schedule that helps project managers, teams, and stakeholders to plan, track, and manage tasks and resources efficiently. This tool provides a clear timeline view of a project's tasks, their dependencies, and their progress over time. Gantt charts are widely used in project management across various industries for their ability to offer a structured and easily comprehensible way of managing complex projects.
Key Components of a Gantt Chart
-
Tasks or Activities: Gantt charts list all the tasks or activities required to complete a project. Each task is represented as a separate bar on the chart.
-
Timeline: The chart displays a timeline, typically in days, weeks, or months, allowing users to see when each task is scheduled to begin and end.
-
Task Duration: The length of each task bar on the chart represents its duration or how long it will take to complete.
-
Dependencies: Gantt charts show task dependencies, indicating which tasks must be completed before others can start. This helps in maintaining a logical sequence of activities.
-
Milestones: Significant project milestones, such as project kick-off, client presentations, or major deliverables, are often marked on the chart to highlight critical events.
-
Resource Allocation: Some Gantt charts include resource allocation, indicating which team members or resources are assigned to each task.
History and Evolution of Gantt Charts
The Gantt chart is named after its creator, Henry L. Gantt, an American engineer, and management consultant who developed this tool in the early 20th century. Gantt charts have since become an integral part of project management methodologies and have evolved significantly over time.
-
Early Development: Henry Gantt introduced the Gantt chart around 1910 as a visual scheduling tool to improve efficiency in manufacturing and construction projects.
-
World War I: Gantt charts gained widespread recognition and were extensively used during World War I for managing military logistics and resource allocation.
-
Digital Era: With the advent of computer technology, Gantt charts transitioned from paper-based drawings to digital formats, becoming more accessible and versatile.
-
Software Integration: Gantt chart software applications, such as Microsoft Project and Smartsheet, emerged, allowing project managers to create, update, and share Gantt charts electronically.
-
Integration with Project Management Methodologies: Gantt charts have been integrated into various project management methodologies, including Waterfall, Agile, and Lean, adapting to different project management philosophies.
Importance of Gantt Charts in Project Management
Gantt charts hold significant importance in project management due to their ability to address various key aspects of project planning and execution. Here are some essential ways in which Gantt charts are vital to project management:
-
Task Visualization: Gantt charts provide a clear and intuitive visual representation of project tasks, timelines, and dependencies, making it easier for project teams to understand the project's structure and goals.
-
Scheduling and Time Management: Gantt charts enable project managers to create realistic project schedules, allocate resources effectively, and ensure that tasks are completed in the right sequence, all of which are crucial for on-time project delivery.
-
Communication: Gantt charts serve as a communication tool, allowing project managers to share project plans and progress with team members, stakeholders, and clients, fostering transparency and alignment.
-
Task Tracking and Monitoring: Gantt charts facilitate the tracking of task progress in real-time. Project managers can identify bottlenecks, delays, and potential issues and take corrective actions promptly.
-
Resource Allocation: Efficient resource allocation is essential for project success. Gantt charts help project managers allocate resources optimally and prevent resource conflicts.
Benefits and Limitations of Gantt Charts
Gantt Chart Benefits
-
Visual Clarity: Gantt charts provide a visually clear representation of project timelines and task dependencies, making it easy for teams to grasp project details quickly.
-
Effective Planning: They enable project managers to create comprehensive project plans, allocate resources efficiently, and establish realistic timelines, leading to better project outcomes.
-
Communication Tool: Gantt charts serve as powerful communication tools, ensuring that all stakeholders have a shared understanding of project progress and objectives.
-
Task Monitoring: Project managers can monitor task progress in real-time, allowing for proactive issue identification and resolution.
-
Resource Optimization: Gantt charts help in optimizing resource allocation, ensuring that team members and resources are utilized effectively.
Gantt Chart Limitations
-
Complexity: Gantt charts can become unwieldy for highly complex projects with numerous tasks and dependencies, making them challenging to manage and read.
-
Static Nature: Traditional Gantt charts can be static and may require manual updates, which can be time-consuming, especially in dynamic projects.
-
Limited Interactivity: They may lack the interactive features needed for detailed project management, such as automatic task rescheduling or collaborative editing.
-
Resource Overallocation: Gantt charts may not provide real-time visibility into resource overallocation, potentially leading to resource conflicts if not carefully monitored.
Gantt charts are invaluable tools in project management, offering benefits such as task visualization, effective planning, and improved communication. However, they have limitations related to complexity, static nature, and resource allocation that should be considered when choosing project management tools.
How to Create a Gantt Chart?
Let's dive deeper into the process of creating a Gantt chart and explore each step in detail:
Preparing the Project Data
Before you can start crafting your Gantt chart, you must lay the groundwork by preparing the project data comprehensively. Here's how to go about it:
-
Project Scope: Begin by defining the scope of your project. What are the project's objectives, deliverables, and overall goals? This step provides you with a clear understanding of what needs to be accomplished.
-
Task Identification: Identify all the tasks required to complete the project successfully. Ensure that no crucial task is left out, no matter how minor it may seem.
-
Duration Estimation: Estimate the time required for each task. This includes considering the resources available, the complexity of the task, and any potential constraints.
-
Dependencies Determination: Determine the relationships between tasks. For example, figure out which tasks must be completed before others can start. This step is crucial for creating a logical sequence of activities.
Choosing the Right Software or Tool
Selecting the appropriate software or tool for creating your Gantt chart is a pivotal decision in the process. Some popular options include:
-
Excel: If you're familiar with Excel, you can create Gantt charts using templates or customized designs. It's a flexible option for those comfortable with spreadsheet software.
-
Microsoft Project: This comprehensive project management software offers a wide range of features but may be better suited for complex, large-scale projects.
-
Smartsheet: A cloud-based collaboration and work management tool that's user-friendly and suitable for various project sizes and types.
-
Trello: Known for its simplicity and visual appeal, Trello is excellent for smaller projects and teams.
Setting Up the Gantt Chart
Once you've chosen the right tool, it's time to set up your Gantt chart within the software or application. Here's how to get started:
-
Create a New Project: Begin by initiating a new project file or document within your chosen software. This will serve as the foundation for your Gantt chart.
-
Select a Template (if available): If your software provides Gantt chart templates, consider using one that aligns with your project's requirements. Templates can save you time and ensure you structure your chart effectively.
-
Define the Timeframe: Establish the project's start and end dates. This step sets the boundaries for your Gantt chart and helps you allocate time effectively.
Defining Tasks and Milestones
With your Gantt chart framework in place, it's time to start populating it with tasks and milestones. Here's how to go about it:
-
Task Names: List all the project tasks you identified during the project data preparation phase. Each task should have a clear and concise name.
-
Start and End Dates: Assign start and end dates to each task. This step creates a timeline for your project and establishes when each task should begin and conclude.
-
Milestones: Identify significant project milestones. These are critical events or achievements in your project, such as project kick-off, client presentations, or major deliverables. Milestones help you track progress and mark important project stages.
Establishing Dependencies and Relationships
Task dependencies and relationships are essential elements of a Gantt chart. They define the order in which tasks should be completed and how they relate to one another. Let's explore these in more detail:
-
Finish-to-Start (FS): This relationship means that Task B can only start when Task A finishes. It's the most common type of dependency and often represents a sequential workflow.
-
Start-to-Start (SS): Task B can start as soon as Task A starts. This dependency is useful when tasks can run concurrently but need to align at specific points.
-
Finish-to-Finish (FF): Task B can finish only when Task A finishes. This type of dependency is useful when tasks must conclude simultaneously.
-
Start-to-Finish (SF): Task B can finish as soon as Task A starts. While less common, this dependency type can be useful in certain project scenarios.
By establishing dependencies and relationships, you create a roadmap that guides the order and timing of tasks in your project, ensuring a logical and efficient flow.
How to Build a Gantt Chart?
Now that you've laid the groundwork and created the initial structure for your Gantt chart, it's time to delve deeper into the building process.
Adding Task Durations and Dependencies
Task durations and dependencies are fundamental components of a Gantt chart, as they provide the backbone of your project schedule. Here's how to work on these aspects:
-
Task Durations: Specify the estimated duration for each task. This duration should be realistic and based on factors such as available resources, task complexity, and historical data. You can express durations in hours, days, or weeks.
-
Dependencies: Task dependencies determine the order in which tasks are completed. Review the relationships you established in the previous section (Finish-to-Start, Start-to-Start, Finish-to-Finish, Start-to-Finish) and input them into your Gantt chart. These dependencies ensure that tasks follow a logical sequence.
By adding task durations and dependencies, your Gantt chart will provide a clear timeline, allowing you to visualize the flow of tasks and their interdependencies.
Allocating Resources
Effective resource allocation is essential for keeping your project on track. Here's how to manage resources within your Gantt chart:
-
Resource Assignment: Assign specific team members or resources to each task. This ensures that responsibilities are clear, and everyone knows their role in the project.
-
Resource Constraints: Be mindful of resource limitations, such as team members' availability or equipment constraints. Adjust your Gantt chart accordingly to prevent overloading resources or causing delays.
-
Resource Tracking: As your project progresses, track resource utilization within your Gantt chart. This helps you identify potential bottlenecks or resource-related issues and make adjustments as needed.
Customizing the Gantt Chart
Tailoring your Gantt chart to meet the unique needs of your project is a critical step in effective project management. Here's how to customize your chart:
-
Task Color Coding: Assign different colors to tasks based on their priority, department, or other relevant criteria. This visual cue can help team members quickly identify critical tasks.
-
Timeline Scaling: Adjust the timeline scale to display the project's timeframe accurately. Depending on your project's duration, you may choose to view it by days, weeks, or months.
-
Adding Additional Columns: Customize your Gantt chart by adding columns that provide additional information, such as task descriptions, responsible team members, or cost estimates.
Customization ensures that your Gantt chart aligns with your project's specific requirements, making it a more effective tool for both planning and tracking.
Adding Milestones and Critical Path
Milestones and the critical path are vital components of your Gantt chart that help you monitor project progress and identify potential delays:
-
Milestones: Milestones represent significant achievements or events in your project, such as project kick-off, client reviews, or project completion. Adding milestones to your Gantt chart provides key checkpoints and helps you track progress.
-
Critical Path: The critical path is the sequence of tasks that, if delayed, will extend the project's overall duration. Identifying the critical path allows you to focus on tasks that have the most significant impact on project timelines and prioritize them accordingly.
By incorporating milestones and understanding the critical path, you'll have a clearer picture of your project's progress and potential areas of concern.
Gantt Chart Best Practices
Before finalizing your Gantt chart, consider these best practices to ensure it remains a valuable tool throughout your project's lifecycle:
-
Regular Updates: Continuously update your Gantt chart to reflect progress and any changes in task durations or dependencies.
-
Communication: Share the Gantt chart with your team and stakeholders to keep everyone informed and aligned.
-
Version Control: Maintain version control to track changes and revisions over time.
-
Contingency Planning: Have contingency plans in place for potential delays or issues that may arise during the project.
-
Training: Ensure that team members are familiar with the Gantt chart software and its features to facilitate effective collaboration.
Building an effective Gantt chart requires attention to detail and ongoing maintenance. By following these steps and best practices, you'll have a well-structured Gantt chart that serves as a powerful tool for project management and tracking
How to Use Gantt Charts for Project Planning?
Now that you have created and customized your Gantt chart, it's time to explore how to effectively utilize it for various aspects of project planning and management. Gantt charts can be invaluable tools in this regard, offering clarity and structure throughout the project lifecycle.
Project Planning and Scheduling
Project planning and scheduling are the core functions of a Gantt chart. Here's how to leverage your Gantt chart for these purposes:
-
Task Prioritization: Use your Gantt chart to prioritize tasks based on their importance and dependencies. This ensures that the most critical activities are addressed first, minimizing delays and bottlenecks.
-
Timeline Visualization: With your Gantt chart, you can visualize the entire project timeline, including task durations and milestones. This clear visual representation helps you identify potential scheduling conflicts and make necessary adjustments.
-
Resource Allocation: Gantt charts help you allocate resources effectively by showing when and where they are needed. This ensures that team members are assigned tasks in a way that optimizes their skills and availability.
Monitoring and Tracking Progress
Once your project is underway, a Gantt chart becomes an essential tool for monitoring progress and ensuring that the project stays on track:
-
Real-time Updates: Regularly update your Gantt chart to reflect actual task progress. This involves marking completed tasks and adjusting timelines for tasks in progress.
-
Progress Tracking: Gantt charts provide a visual representation of task completion, making it easy to see if you're ahead of or behind schedule. Tracking progress ensures you can address any issues promptly.
-
Identifying Delays: Gantt charts highlight tasks that are running late, allowing you to identify bottlenecks or potential issues that may require intervention.
Resource Management with Gantt Charts
Efficient resource management is a key component of successful project execution. Here's how your Gantt chart can assist in resource management:
-
Resource Availability: Gantt charts provide a clear overview of when specific resources are required. This information helps you ensure that team members are available when needed and can be allocated to tasks effectively.
-
Resource Allocation Optimization: By visualizing resource allocation within the Gantt chart, you can identify overloads or underutilization and redistribute resources accordingly. This prevents burnout and ensures optimal resource allocation.
-
Resource Conflict Resolution: In the event of resource conflicts or double-bookings, your Gantt chart can help you quickly identify and resolve them, minimizing disruption to the project schedule.
Identifying and Managing Risks
Risk management is an integral part of project planning, and Gantt charts can assist in this area as well:
-
Risk Assessment: Identify potential risks and uncertainties in your project plan. These could include delays, resource constraints, external factors, or dependencies on third parties.
-
Risk Mitigation Planning: Develop contingency plans within your Gantt chart to address potential risks. This may involve adjusting task timelines, reallocating resources, or having alternative solutions ready.
-
Regular Risk Reviews: Periodically review your Gantt chart for any emerging risks and adjust your risk mitigation strategies as necessary. This proactive approach can help you avoid or minimize disruptions to your project.
By incorporating project planning, monitoring, resource management, and risk assessment into your Gantt chart usage, you'll have a comprehensive tool that aids you in effectively managing and executing projects of all sizes and complexities.
Gantt Charts in Team Collaboration
Gantt charts are not just powerful project management tools; they also play a crucial role in enhancing team collaboration and communication.
Sharing Gantt Charts with Team Members
Sharing your Gantt chart with team members is the first step in fostering collaboration. Here's how you can effectively share your project plan:
-
Accessibility: Ensure that your Gantt chart is accessible to all team members. Utilize cloud-based project management tools or shared drives to host the chart, making it easily reachable by everyone involved.
-
Clear Access Permissions: Grant appropriate access permissions to team members, allowing them to view and interact with the Gantt chart as needed. This ensures that sensitive information remains secure while enabling collaboration.
-
Training and Guidance: Provide training or guidance to team members on how to navigate and interpret the Gantt chart. Familiarity with the chart's layout and features is essential for effective collaboration.
Collaborative Editing and Updates
Collaborative editing capabilities within your Gantt chart software can significantly streamline project management and teamwork:
-
Real-time Collaboration: Choose a Gantt chart tool that supports real-time collaboration, allowing multiple team members to work on the chart simultaneously. This feature fosters a sense of unity and ensures that everyone is on the same page.
-
Task Assignment: Enable team members to assign tasks to themselves or others directly within the Gantt chart. This simplifies task delegation and promotes accountability.
-
Commenting and Discussion: Incorporate commenting or discussion features within your Gantt chart tool. Team members can leave comments, ask questions, or provide updates on specific tasks or milestones, promoting open communication.
Communication and Accountability
Effective communication is key to successful project execution. Gantt charts can help facilitate communication and ensure accountability:
-
Regular Updates: Encourage team members to regularly update the Gantt chart with task progress and changes. This transparency keeps everyone informed and minimizes surprises.
-
Meeting Support: Use the Gantt chart as a visual aid during team meetings and discussions. It provides a clear overview of the project's status and helps identify areas that need attention.
-
Accountability Tracking: Gantt charts make it easy to track accountability. Team members can see their assigned tasks and deadlines, which promotes a sense of responsibility and ownership.
-
Notification Alerts: Some Gantt chart tools offer notification alerts for task deadlines or changes. These alerts can help team members stay on top of their responsibilities.
Incorporating Gantt charts into your team collaboration strategy enhances transparency, accountability, and communication, ultimately leading to more successful project outcomes. When team members have a clear understanding of project timelines and responsibilities, they are better equipped to work together effectively.
Gantt Charts in Different Industries
Gantt charts are versatile tools that find applications across various industries. We'll explore how Gantt charts are used effectively in different sectors, showcasing their adaptability and impact.
Construction and Engineering
The construction and engineering industry relies heavily on project management tools like Gantt charts to ensure efficient project execution. Here's how Gantt charts are utilized in this sector:
-
Project Phasing: Gantt charts help construction and engineering teams break down complex projects into manageable phases. Each phase consists of specific tasks and dependencies, ensuring a structured approach.
-
Resource Allocation: Resource management is crucial in construction. Gantt charts allow project managers to allocate equipment, labor, and materials effectively, preventing bottlenecks and resource conflicts.
-
Scheduling: Gantt charts provide a visual timeline for construction projects, enabling teams to coordinate tasks and monitor progress. This visual clarity is invaluable in adhering to project timelines and deadlines.
Software Development
In the dynamic world of software development, Gantt charts provide a roadmap for project teams to deliver high-quality software on time. Here's how Gantt charts benefit software development:
-
Task Dependencies: Software development projects often involve complex dependencies between tasks, such as coding, testing, and debugging. Gantt charts help teams identify and manage these dependencies efficiently.
-
Sprint Planning: Agile development teams use Gantt charts for sprint planning. They break down features and user stories into tasks and visualize the sprint timeline, ensuring the timely delivery of software increments.
-
Bug Tracking: Gantt charts are valuable for tracking and managing bug fixes. Teams can allocate time for debugging and QA testing, ensuring that software releases are stable and bug-free.
Event Planning
Event planning requires meticulous organization and coordination. Gantt charts are indispensable tools in this industry for several reasons:
-
Task Sequencing: Gantt charts help event planners create a precise timeline for tasks like venue booking, catering, decorations, and entertainment. This ensures that all elements come together seamlessly on event day.
-
Vendor Coordination: Event planners use Gantt charts to coordinate with various vendors and service providers. Assigning tasks and deadlines ensures that everyone involved is aligned with the event's schedule.
-
Critical Path Analysis: Event planners identify the critical path—the sequence of tasks that must be completed on time for the event to proceed as planned. This allows for proactive risk management.
Marketing and Advertising
Marketing campaigns and advertising initiatives often involve multiple tasks and team members. Gantt charts assist in managing the complexity of these projects:
-
Campaign Planning: Gantt charts help marketing teams plan campaigns with precision. Tasks such as market research, content creation, design, and ad placement are scheduled to maximize impact.
-
Content Calendar: Content marketing relies on consistent publishing schedules. Gantt charts serve as content calendars, ensuring that blog posts, social media updates, and email campaigns are released on time.
-
Team Collaboration: Marketing teams can collaborate efficiently using Gantt charts, assigning tasks and deadlines to team members. This ensures that each team member knows their responsibilities and timelines.
Gantt charts transcend industry boundaries, offering a structured approach to project management in construction, software development, event planning, marketing, and countless other sectors. Their adaptability and versatility make them an essential tool for teams aiming to achieve project success.
Examples of Gantt Charts in Action
To provide a deeper understanding of how Gantt charts are applied in real-world scenarios, let's explore a few detailed examples across different industries:
1. Construction Project Management
In the construction industry, Gantt charts play a pivotal role in ensuring that complex projects are completed on time and within budget. Here's how a Gantt chart might be used for building a new commercial property:
-
Phase Breakdown: The Gantt chart would begin by breaking the project into phases, such as site preparation, foundation, structural framing, interior construction, and finishing touches.
-
Task Sequencing: Within each phase, tasks are sequenced logically. For instance, before starting interior construction, the structural framing must be complete. The Gantt chart visually represents these dependencies.
-
Resource Allocation: The chart would allocate resources like labor, heavy machinery, and materials to specific tasks. This allocation ensures that resources are used efficiently and that there are no resource conflicts.
-
Critical Path Analysis: Identifying the critical path helps construction managers focus on tasks that, if delayed, would impact the overall project timeline. This might include tasks like pouring the foundation or erecting structural steel.
2. Software Development
In software development, Gantt charts are used to manage the intricacies of coding, testing, and launching a software product. Consider the development of a mobile app:
-
Feature Development: Tasks are created for each feature of the app, from user interface design to backend coding. Dependencies are established, ensuring that design work precedes coding, and coding precedes testing.
-
Sprint Planning: Gantt charts are used to plan sprints in Agile development. Each sprint consists of tasks related to specific features, with sprint durations displayed on the chart.
-
Bug Tracking: As the development progresses, the Gantt chart is updated with tasks related to bug fixes and quality assurance testing. These tasks are closely monitored to maintain software quality.
3. Event Planning
Event planners rely on Gantt charts to orchestrate weddings, conferences, and other gatherings. Let's examine how a Gantt chart is employed for organizing a corporate conference:
-
Task Assignment: Each aspect of the conference, from venue selection to speaker invitations, is assigned as a task on the Gantt chart. Team members responsible for each task are indicated.
-
Task Timeline: Tasks are sequenced to ensure that essential elements like venue setup and audiovisual equipment installation occur before the conference's start date. Dependencies between tasks are clearly represented.
-
Vendor Coordination: Gantt charts facilitate communication with vendors. Tasks like catering, event signage, and equipment rental are assigned, with deadlines that align with the event date.
-
Event Day Schedule: The Gantt chart serves as an event day schedule, helping event planners keep track of tasks such as registration, keynote speeches, breakout sessions, and meal service.
4. Marketing Campaign
Marketing professionals use Gantt charts to plan and execute marketing campaigns, ensuring that promotional efforts are coordinated and deadlines are met. Let's look at an example for launching a new product:
-
Campaign Phases: The Gantt chart breaks down the campaign into phases, including market research, content creation, social media promotion, and email marketing.
-
Content Calendar: Content creation tasks are scheduled in detail, specifying when blog posts, social media updates, and email campaigns will be produced and published.
-
Task Dependencies: Dependencies between tasks are established to ensure that content creation precedes promotional efforts. For instance, a blog post about the new product launch may need to be completed before it's promoted on social media.
-
Progress Tracking: As the campaign unfolds, the Gantt chart is continuously updated with task progress and actual completion dates. This allows the marketing team to gauge campaign effectiveness and make adjustments as needed.
These examples illustrate how Gantt charts are versatile tools adaptable to various industries and project types. They provide a visual roadmap for project management, enabling teams to plan, execute, and monitor projects efficiently and effectively.
Tips for Effective Gantt Chart Usage
Effectively utilizing Gantt charts in your project management endeavors requires a combination of best practices and practical insights. Here are some valuable tips to make the most of your Gantt chart:
-
Set Realistic Timelines: Ensure that your task durations are realistic and achievable. Overly optimistic timelines can lead to frustration and missed deadlines.
-
Regular Updates: Keep your Gantt chart up to date. Regularly review and adjust task progress, timelines, and dependencies to reflect the actual status of your project.
-
Effective Communication: Use the Gantt chart as a communication tool. Share it with team members and stakeholders to keep everyone informed about project progress and expectations.
-
Stakeholder Engagement: Involve stakeholders in the Gantt chart process. Discuss project timelines and expectations with them, and be open to their input and feedback.
-
Flexibility: While Gantt charts provide structure, be prepared to adapt to changes. Projects are dynamic, and unforeseen circumstances can arise. Have contingency plans in place.
-
Team Training: Ensure that your team is proficient in using the Gantt chart software. Training team members on how to navigate and update the chart promotes efficiency.
-
Risk Management: Continuously assess and manage risks. Identify potential bottlenecks, resource constraints, and dependencies that may impact your project.
-
Regular Reviews: Schedule regular Gantt chart reviews with your team. These meetings provide an opportunity to discuss progress, address issues, and plan next steps.
-
Use Color Coding: Assign colors to tasks based on priority, status, or team responsibility. Color coding enhances visual clarity and helps team members quickly identify critical information.
-
Document Assumptions: Document any assumptions or constraints that underlie your Gantt chart. This transparency ensures that all team members understand the basis of your project plan.
-
Avoid Micromanagement: While Gantt charts provide detailed project plans, avoid micromanaging every task. Trust your team members to manage their responsibilities while providing support and guidance when needed.
-
Celebrate Milestones: Acknowledge and celebrate project milestones. This boosts team morale and motivates team members to maintain momentum.
-
Regularly Communicate Changes: If changes to the project plan are necessary, communicate them promptly to all relevant parties. Transparency and clear communication are key.
-
Seek Feedback: Encourage team members and stakeholders to provide feedback on the Gantt chart's effectiveness. Continuous improvement is essential for future projects.
By applying these tips and best practices, you can harness the full potential of Gantt charts as a valuable project management tool. They can help you plan, monitor, and execute projects efficiently while fostering effective communication and collaboration within your team and with stakeholders.
Conclusion
Gantt charts are powerful tools that have revolutionized the way we plan, execute, and manage projects. With their visual simplicity and versatile applications across various industries, they have become an indispensable asset for project managers and teams worldwide. From construction sites to software development teams, event planners to marketers, Gantt charts provide a structured approach that enhances communication, fosters collaboration, and ensures project success.
So, whether you're embarking on a new project or looking to improve your current project management practices, remember the invaluable role that Gantt charts can play. By harnessing their capabilities, you can steer your projects towards success, meet deadlines with confidence, and navigate the complexities of project management with ease.