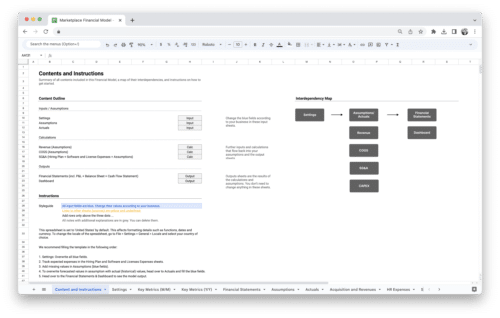
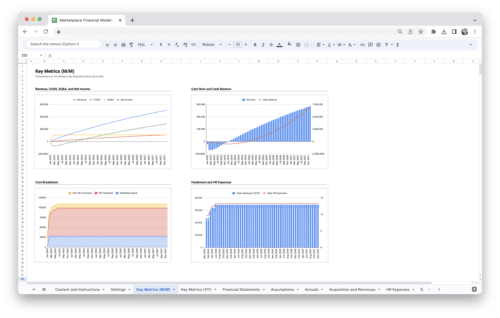
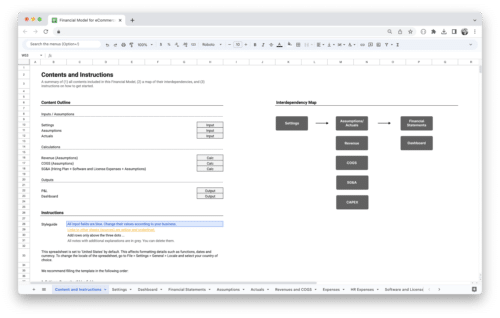
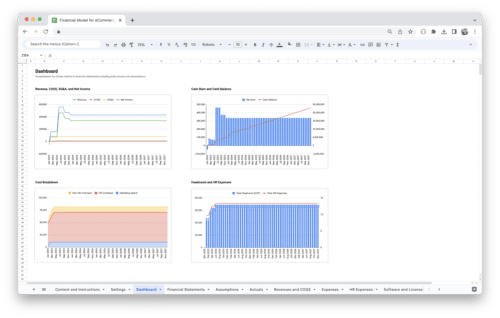
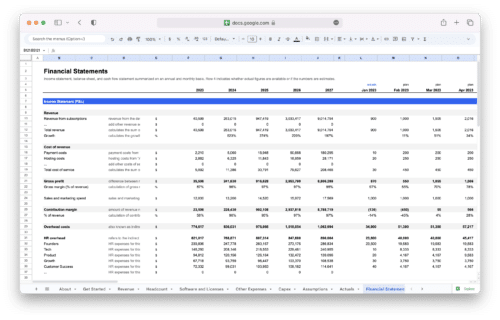
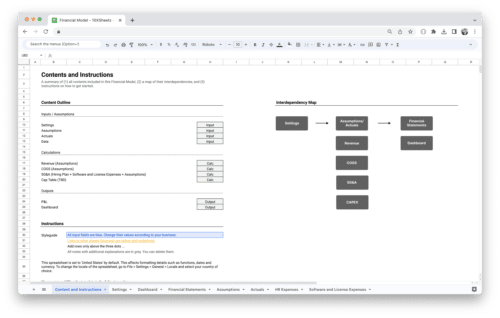
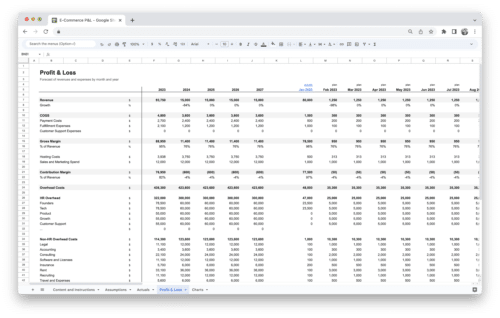
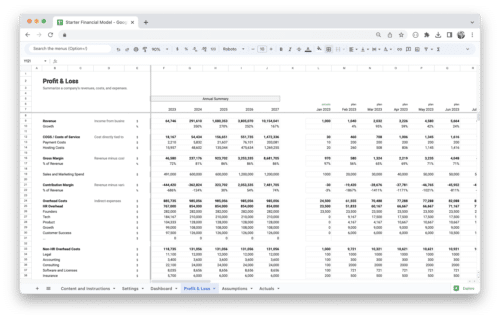
Get Started With a Prebuilt Model

Start with a free template and upgrade when needed.

Are you ready to elevate your financial modeling skills and unlock the true potential of Excel? This guide is your gateway to mastering advanced Excel functions that will empower you to build intricate and accurate financial models. From financial calculations and statistical analysis to data manipulation and visualization, we’ll explore the tools and techniques that financial professionals rely on to make informed decisions and drive success.

What are Advanced Excel Functions for Financial Modeling?

When it comes to financial modeling, Excel is the go-to tool for professionals worldwide. It offers a plethora of advanced functions that can significantly enhance your modeling capabilities. We’ll delve into what these advanced Excel functions are and how they can be harnessed to build complex and accurate financial models.

Understanding Advanced Excel Functions

Advanced Excel functions are specialized tools within Excel that go beyond the basics of arithmetic and basic data manipulation. They are designed to handle complex financial calculations, data analysis, and decision-making processes inherent in financial modeling. These functions provide you with the ability to perform intricate tasks such as cash flow projections, scenario analysis, and risk assessment with precision and efficiency.

Some key categories of advanced Excel functions for financial modeling include:

  • Financial Functions: Functions like NPV, IRR, PMT, and FV enable you to calculate present and future values, perform loan amortization, and assess investment feasibility.
  • Statistical Functions: Functions like AVERAGEIFS, CORREL, and FREQUENCY facilitate statistical analysis, helping you identify trends and correlations within your data.
  • Lookup and Reference Functions: Functions like VLOOKUP, HLOOKUP, INDEX, and MATCH allow you to retrieve specific information from large datasets or perform complex data lookups.
  • Date and Time Functions: Functions like DATE, TIME, and EOMONTH help you manage dates and times in financial models, which is crucial for accurate calculations and reporting.
  • Text Functions: Functions like CONCATENATE, TEXTJOIN, and LEFT/RIGHT/MID assist in formatting, manipulating, and combining text strings.

By mastering these advanced functions, you can create dynamic financial models that can adapt to changing variables, make accurate predictions, and aid in decision-making processes.

Importance of Excel in Financial Modeling

Excel is undeniably the cornerstone of financial modeling for several compelling reasons. It offers a powerful and flexible platform that financial professionals rely on for their modeling needs. Here’s why Excel holds a special place in the world of financial modeling:

  • Widespread Adoption: Excel is universally recognized and used across industries, making it a common language for financial professionals. Its widespread adoption ensures compatibility and ease of communication.
  • Ease of Use: Excel’s user-friendly interface and intuitive formula structure make it accessible to users of varying skill levels, from beginners to advanced analysts.
  • Versatility: Excel’s versatility allows you to create a wide range of financial models, from simple budgeting spreadsheets to complex discounted cash flow models for investment analysis.
  • Advanced Functionality: As we’ve discussed in previous sections, Excel offers advanced functions and tools designed specifically for financial modeling, providing the accuracy and complexity required for robust financial analyses.
  • Customization: You can tailor your financial models in Excel to suit specific business needs, adjusting formulas, formatting, and charts to meet your requirements.
  • Visual Representation: Excel’s charting and graphing capabilities allow you to present financial data in a visually compelling manner, aiding in the communication of complex financial insights.
  • Integration: Excel seamlessly integrates with other Microsoft Office applications, such as Word and PowerPoint, making it convenient for creating comprehensive reports and presentations.
  • Accessibility of Resources: A vast community of Excel users and experts provides resources, templates, and support, making it easier to troubleshoot issues and continuously improve your modeling skills.

Excel’s enduring importance in financial modeling is a testament to its adaptability, power, and user-friendly nature. Whether you’re an entry-level analyst or a seasoned financial professional, Excel remains an indispensable tool for creating accurate, insightful, and impactful financial models.

Essential Excel Functions for Financial Modeling

Let’s delve into the core Excel functions that every financial modeler should master to build robust and accurate financial models.

SUMIF and SUMIFS Functions

SUMIF: This function allows you to sum values in a range that meet a specific condition. It’s handy when you need to calculate totals based on criteria.

Example: Summing up the total sales for a particular product category.

=SUMIF(CategoryRange, "Electronics", SalesRange)

SUMIFS: When you have multiple criteria to consider, SUMIFS comes to the rescue. It lets you sum values based on multiple conditions.

Example: Calculating total sales for electronics in the North region.

=SUMIFS(SalesRange, CategoryRange, "Electronics", RegionRange, "North")

VLOOKUP and HLOOKUP Functions

VLOOKUP: This function is essential for searching for a value in a table and retrieving corresponding information. It’s vertical in nature and widely used for data lookup.

Example: Finding the price of a product based on its code.

=VLOOKUP(ProductCode, ProductTable, 2, FALSE)

HLOOKUP: Similar to VLOOKUP, HLOOKUP is used for data lookup, but it searches horizontally in a table. HLOOKUP is perfect for horizontal data lookup in a table. For instance, finding the price of a product in a row of prices based on the product name.

Example: Finding the price of a product.

=HLOOKUP("Product A", A1:E10, 2, FALSE)

INDEX and MATCH Functions

INDEX: The INDEX function is a powerful tool to retrieve data from a specific location within a table. It’s often combined with other functions for more advanced lookup capabilities.

Example: Retrieving a customer’s details using their unique ID.

=INDEX(CustomerData, MATCH(CustomerID, IDColumn, 0), ColumnNumber)

MATCH: MATCH, combined with INDEX, helps you locate the position of a specific value within a range. For instance, finding the position of a customer’s name in a list.

Example: Locating the position of a customer’s name.

=MATCH("John Smith", A1:A100, 0)

IF and Nested IF Functions

IF: IF functions allow you to make decisions within your models. They return one value if a condition is true and another if false.

Example: Determining bonus payouts based on sales performance.

=IF(Sales > 100000, "High Bonus", IF(Sales > 50000, "Medium Bonus", "No Bonus"))

Nested IF functions are used when you have multiple conditions to evaluate within a single formula.

PMT and IPMT Functions for Loan Amortization

PMT: PMT helps you calculate the periodic payment for a loan, taking into account the interest rate, loan term, and loan amount.

Example: Calculating monthly mortgage payments.

=PMT(InterestRate/12, LoanTerm*12, LoanAmount)

IPMT: IPMT allows you to determine the interest portion of each loan payment. For instance, calculating the interest paid in the first month of a loan.

Example: Calculating the interest portion of a loan payment.

=IPMT(0.05/12, 1, 36, -10000)

NPV and IRR Functions for Investment Analysis

NPV: Net Present Value (NPV) helps you assess the profitability of an investment by calculating the present value of future cash flows.

Example: Calculating the NPV of an investment.

=NPV(Rate, CashFlows)

IRR: The Internal Rate of Return (IRR) function helps you find the rate at which an investment breaks even. For instance, determining the IRR of a series of cash flows.

Example: Calculating the IRR of an investment.

=IRR(B1:B5)

DATE and TIME Functions for Date Calculations

DATE: The DATE function is vital for working with dates in Excel. You can create specific dates, calculate differences between dates, and more.

Example: Calculating the number of days between two dates.

=DATE(2023, 12, 31) - DATE(2023, 1, 1)

TIME: TIME functions enable you to manipulate time values and perform various calculations. For instance, adding hours and minutes to a given time.

Example: Adding 2 hours and 30 minutes to a time value.

=TIME(14, 30, 0) + TIME(2, 30, 0)

TEXT Functions for Formatting

Excel’s TEXT functions are crucial for formatting numbers and dates to match your reporting requirements.

Example: Displaying a date in a custom format.

=TEXT(TODAY(), "dd-mmm-yyyy")

By mastering these essential Excel functions, you’ll have a solid foundation for building complex financial models and performing detailed analysis in your finance-related tasks

Advanced Excel Functions for Statistical Analysis

In the world of financial modeling, statistical analysis plays a crucial role in making informed decisions and predictions. We’ll explore advanced Excel functions that will empower you to dive deep into data analysis and enhance the accuracy of your financial models.

AVERAGEIFS and COUNTIFS Functions

AVERAGEIFS: When you need to calculate an average based on multiple criteria, the AVERAGEIFS function comes to your rescue. It allows you to consider more than one condition while computing the average.

Example: Finding the average revenue for a specific product category in a certain region.

=AVERAGEIFS(RevenueRange, CategoryRange, "Electronics", RegionRange, "North")

COUNTIFS: Similar to AVERAGEIFS, COUNTIFS counts the number of cells that meet multiple conditions. For instance, counting the number of sales transactions above a certain amount in a specific region.

Example: Counting sales transactions meeting multiple criteria.

=COUNTIFS(RegionRange, "North", AmountRange, ">1000")

CORREL and COVAR Functions for Correlation and Covariance

CORREL: The CORREL function calculates the correlation coefficient between two datasets. This coefficient indicates the strength and direction of the linear relationship between variables.

Example: Evaluating the correlation between stock prices of two companies.

=CORREL(StockPriceCompanyA, StockPriceCompanyB)

COVAR: COVAR, or covariance, measures the degree to which two variables move together. It helps in assessing the joint variability of two sets of data.

Example: Calculating the covariance between two sets of stock returns.

=COVAR(StockReturns1, StockReturns2)

FREQUENCY and PERCENTILE Functions

FREQUENCY: The FREQUENCY function helps you create a frequency distribution from your data. It’s particularly useful for analyzing data that falls into different ranges or bins.

Example: Analyzing the distribution of test scores in a class.

=FREQUENCY(TestScores, Bins)

PERCENTILE: PERCENTILE calculates the value below which a given percentage of data falls. It’s a valuable tool for assessing data distribution and identifying outliers.

Example: Determining the 90th percentile of customer purchase amounts.

=PERCENTILE(PurchaseAmounts, 0.9)

Statistical Data Analysis with Excel

Excel provides a wide range of statistical functions and tools that can be applied to financial modeling and data analysis. Here are some additional techniques you can explore:

  • Descriptive Statistics: Excel offers functions like AVERAGE, MEDIAN, MODE, MIN, MAX, and more to summarize data and understand its characteristics.
  • Regression Analysis: You can use Excel to perform linear and nonlinear regression analysis, helping you identify relationships between variables and make predictions.
  • Hypothesis Testing: Excel’s built-in functions for t-tests, ANOVA, and chi-square tests enable you to test hypotheses and draw meaningful conclusions from your data.
  • Data Sampling: If you have large datasets, Excel’s random sampling functions can help you generate representative samples for analysis.

By leveraging these advanced statistical functions and techniques, you can uncover valuable insights, identify trends, and make data-driven decisions within your financial models.

Financial Functions for Modeling

In the realm of financial modeling, precise calculations are paramount. We’ll explore a suite of financial functions that will enable you to project cash flows, analyze asset depreciation, and conduct financial planning with finesse.

Future Value (FV) and Present Value (PV) Functions

Future Value (FV): The FV function is indispensable for determining the future worth of an investment or a series of cash flows. It takes into account the interest rate, the number of periods, periodic payments or receipts, and the initial amount.

Example: Calculating the future value of an investment.

=FV(Rate, Nper, Pmt, PV, Type)

Present Value (PV): Conversely, the PV function computes the present value of future cash flows, helping you understand their current worth. It is instrumental in evaluating the attractiveness of investment opportunities.

Example: Calculating the present value of future cash flows.

=PV(Rate, Nper, Pmt, FV, Type)

Depreciation Functions (SLN, DB, DDB)

Asset depreciation is a crucial aspect of financial modeling, especially when managing fixed assets and reporting financial statements. Excel offers three primary depreciation functions:

Straight-Line Depreciation (SLN): This method allocates an equal amount of depreciation expense over an asset’s useful life.

Example: Calculating straight-line depreciation.

=SLN(Cost, Salvage, Life)

Declining Balance (DB): The DB function applies a higher depreciation expense in the early years of an asset’s life, making it suitable for assets that lose value more rapidly. For instance, calculating the depreciation expense for an asset.

Example: Calculating the depreciation expense using the Declining Balance method.

=DB(10000, 0, 5, 2)

Double Declining Balance (DDB): DDB, as the name suggests, doubles the depreciation rate of the DB method. It results in higher depreciation expenses in the initial years, making it a more aggressive depreciation method.

Example: Calculating the depreciation expense using the Double Declining Balance method.

=DDB(10000, 0, 5, 2)

RATE and NPER Functions for Financial Planning

RATE: When you need to determine the interest rate required to reach a specific financial goal, the RATE function is your ally. It’s particularly useful for calculating loan or investment interest rates.

Example: Finding the interest rate required to reach a savings goal.

=RATE(Nper, Pmt, PV, FV, Type)

NPER: NPER, on the other hand, helps you calculate the number of periods needed to achieve a financial objective, be it saving for retirement or paying off a loan.

Example: Determining the time it takes to reach a savings goal.

=NPER(Rate, Pmt, PV, FV, Type)

Goal Seek and Scenario Analysis in Financial Modeling

Excel’s built-in tools for Goal Seek and Scenario Analysis are indispensable for exploring different scenarios and assessing the impact of variable changes in your financial models.

Goal Seek: This tool allows you to set a specific goal and have Excel automatically determine the required input values to achieve that goal. It’s exceptionally useful when you want to reverse engineer a financial model.

Example: Using Goal Seek to find the required monthly payment to pay off a loan in a certain number of years.

Scenario Analysis: Scenario Manager in Excel enables you to create and compare multiple scenarios within your financial model. You can change input values and instantly observe how they affect the outcome.

Example: Evaluating the impact of various interest rate scenarios on a project’s profitability.

By mastering these financial functions and modeling techniques, you’ll have the tools needed to project future financial outcomes, manage asset depreciation, perform financial planning, and analyze the potential impact of different scenarios on your financial models with precision and confidence.

Advanced Excel Functions for Data Manipulation

In the world of financial modeling, data is your canvas, and Excel offers a palette of advanced functions and techniques to sculpt and manipulate your data with precision. We’ll explore tools that allow you to reshape and refine your data for more insightful financial modeling.

TEXTJOIN and CONCATENATE Functions

TEXTJOIN: The TEXTJOIN function allows you to combine text from multiple cells into a single, cohesive string. It’s particularly useful when you need to merge data from various sources into a unified format.

Example: Combining first and last names into a single cell.

=TEXTJOIN(" ", FirstNameCell, LastNameCell)

CONCATENATE: While TEXTJOIN excels at merging text strings, CONCATENATE is a simpler function that combines text from multiple cells.

Example: Combining first and last names using CONCATENATE.

=CONCATENATE(FirstNameCell, " ", LastNameCell)

TRANSPOSE and INDEX-MATCH Combination

TRANSPOSE: TRANSPOSE is a powerful function that flips the orientation of your data. It’s exceptionally useful when you want to switch rows and columns in your dataset.

Example: Changing a vertical list of data into a horizontal format.

=TRANSPOSE(VerticalDataRange)

INDEX-MATCH Combination: INDEX and MATCH are often used together to perform advanced data lookups. You can locate specific values within a dataset using the MATCH function and then retrieve corresponding data using the INDEX function.

Example: Retrieving the sales figure for a product.

=INDEX(SalesRange, MATCH("Product A", ProductNames, 0))

Advanced PivotTable Techniques

PivotTables are a formidable tool for data summarization and analysis. With advanced techniques, you can extract deeper insights from your financial data:

  • Slicers: These interactive controls allow you to filter and analyze your PivotTable data dynamically, enhancing the user experience.
  • Calculated Fields/Items: You can create custom calculations within your PivotTable to derive meaningful metrics from your data.
  • Grouping: Grouping enables you to categorize data into intervals or categories for a more concise and readable summary.

Power Query and Data Import

Power Query: Power Query is a versatile tool within Excel that allows you to connect, transform, and load data from various sources. It’s a game-changer for data cleansing and transformation.

Example: Importing data from an external database, cleaning it, and loading it into your financial model.

By mastering these advanced data manipulation functions and techniques, you’ll be equipped to efficiently reshape and refine your data to suit your financial modeling needs. Whether it’s merging text, transposing data, unleashing the full potential of PivotTables, or importing and transforming external data sources, Excel provides you with the tools to ensure your data is structured for accurate and insightful financial analysis.

Macros and Automation in Financial Modeling

In the fast-paced world of financial modeling, efficiency is key. Macros and automation can be your best allies in streamlining repetitive tasks and enhancing productivity. We’ll explore the power of macros and delve into the world of VBA (Visual Basic for Applications).

Introduction to Macros and VBA

Macros: Macros are sequences of actions recorded in Excel to automate repetitive tasks. They allow you to record your keystrokes and mouse clicks, turning them into reusable scripts.

Visual Basic for Applications (VBA): VBA is a powerful programming language that extends Excel’s capabilities. It enables you to create custom functions, automate complex tasks, and build user-friendly interfaces.

Creating and Running Macros

Recording a Macro: To create a macro, you can start by recording your actions. Excel will capture your mouse and keyboard inputs and generate VBA code.

Example: Recording a macro to format financial statements consistently.

Editing VBA Code: Once you’ve recorded a macro, you can fine-tune it by editing the generated VBA code. This allows you to add conditional logic, loops, and custom functions.

Example: Enhancing a macro to perform advanced data cleansing on imported financial data.

Running Macros: After creating or editing a macro, you can execute it at any time to automate a specific task.

Example: Running a macro to generate financial reports with a single click.

Automating Financial Modeling Tasks

Macros and VBA can be particularly beneficial in financial modeling for tasks such as:

  • Data Import and Transformation: Automate the import of external data sources and apply necessary transformations.
  • Report Generation: Create macros to generate standardized financial reports, saving time and ensuring consistency.
  • Scenario Analysis: Build macros that quickly perform scenario analysis by adjusting key variables.
  • Error Checking: Develop macros to detect errors and inconsistencies in your financial models.
  • Model Validation: Use macros to validate your financial models by comparing them to predefined criteria.
  • User Interfaces: Design custom user interfaces to facilitate data input and model interaction.

By harnessing the power of macros and VBA, you can significantly increase your efficiency in financial modeling. Whether you’re automating data manipulation, report generation, or complex calculations, these tools allow you to focus on the strategic aspects of your analysis while leaving repetitive tasks to the machines.

Advanced Charting and Visualization Techniques

In the world of financial modeling, effective data presentation is paramount. Advanced charting and visualization techniques in Excel empower you to convey complex financial information in a clear and compelling manner.

Creating Advanced Charts

Excel offers a rich toolkit for creating a wide range of advanced charts that go beyond the basics. Some key chart types to explore include:

  • Waterfall Charts: Ideal for illustrating how various factors contribute to a final result, such as the breakdown of expenses in a financial report.
  • Gantt Charts: Perfect for project management and showing the timeline of tasks and their dependencies.
  • Heatmaps: Effective for visualizing data density or correlations, often used in risk assessment and portfolio analysis.
  • Pareto Charts: Useful for identifying the most significant factors contributing to an outcome, commonly applied in Pareto analysis.
  • Combo Charts: Combining different chart types, such as bar and line charts, to present multiple data series in a single view.
  • 3D Charts: Adding depth to your data presentation, allowing you to visualize multi-dimensional data.

Example: Creating a waterfall chart to display the contribution of various revenue sources to total revenue.

Dynamic Dashboards in Excel

Excel’s dynamic dashboards are powerful tools for synthesizing financial data and providing real-time insights. They allow you to create interactive and user-friendly reports that adapt to changing data.

Key Components of Dynamic Dashboards:

  • Interactive Controls: Incorporate dropdown lists, slicers, and buttons to allow users to filter and interact with the data.
  • Dynamic Charts: Utilize formulas and named ranges to create charts that automatically update based on user selections.
  • KPI Indicators: Highlight key performance indicators (KPIs) with visual cues like traffic lights or sparklines.
  • Data Tables: Display underlying data tables that change in real-time as users interact with the dashboard.

Example: Building a dynamic financial dashboard that enables users to select specific time periods and instantly see how it affects various financial metrics and charts.

Error Handling and Auditing in Financial Models

In the intricate world of financial modeling, error prevention and detection are paramount. Excel provides tools and techniques to ensure the accuracy and reliability of your financial models.

Detecting and Correcting Errors

Financial models often involve complex calculations, and errors can creep in unnoticed. Excel offers several tools to identify and rectify errors:

  • Error Functions: Functions like IFERROR and ISERROR help you handle errors gracefully by providing alternative values or actions.
  • Error Checking: Excel’s error checking options can automatically highlight cells with errors, making them easy to spot.
  • Data Validation: Implement data validation rules to restrict input and prevent invalid data entry.
  • Watch Window: The Watch Window allows you to monitor specific cells or ranges, keeping an eye on critical variables.
  • Cell Auditing: Excel’s auditing tools, such as Trace Precedents and Trace Dependents, help you understand the relationships between cells and identify potential sources of errors.

Example: Using the IFERROR function to display “N/A” when a division by zero error occurs in a financial ratio calculation.

Auditing Excel Formulas

Auditing financial models requires a systematic approach to review and validate formulas. Excel provides tools for auditing:

  • Formula Auditing Toolbar: This toolbar includes tools like Evaluate Formula, which allows you to step through formula calculations one element at a time.
  • Error Checking: Excel’s error checking options can help you identify and fix formula errors, such as circular references or inconsistent formulas.
  • Formula Auditing Pane: The Formula Auditing Pane provides a visual representation of formula relationships, making it easier to understand complex calculations.
  • Data Validation: Implement data validation rules to ensure that input meets specific criteria, reducing the risk of formula errors.
  • Documentation: Properly documenting your formulas and assumptions is crucial for model transparency and auditability.

By employing error detection and correction techniques and adopting a structured approach to auditing formulas, you can enhance the reliability and accuracy of your financial models, minimizing the risk of costly errors and ensuring the trustworthiness of your analyses.

Excel Add-Ins for Financial Modeling

In the ever-evolving landscape of financial modeling, Excel add-ins can be valuable allies in extending the capabilities of your spreadsheet software. These add-ins offer specialized functions and tools tailored to financial analysis and modeling, helping you work more efficiently and effectively. Here are some notable Excel add-ins worth exploring:

  • Solver Add-In: Solver is a built-in Excel add-in that helps you find optimal solutions to complex financial problems, such as portfolio optimization or resource allocation.
  • Analysis ToolPak: This add-in provides a range of statistical and financial functions, making it easier to perform data analysis and advanced calculations within your financial models.
  • Power Query: Power Query is an essential add-in for data transformation and manipulation. It simplifies data import from various sources and enhances data cleansing and preparation.
  • Power Pivot: Power Pivot is another powerful add-in that allows you to create sophisticated data models and perform data analysis using data from multiple sources.
  • Monte Carlo Simulation Add-Ins: These add-ins enable you to perform Monte Carlo simulations, a valuable technique for risk analysis and decision-making in financial modeling.
  • Financial Modeling Prep (FMP) Add-In: FMP is a specialized add-in that provides financial data and historical stock prices directly within Excel, streamlining the process of retrieving financial information.
  • XIRR and XNPV Add-Ins: These add-ins enhance Excel’s existing XIRR and XNPV functions, making them more robust and precise for complex financial calculations.
  • VBA Add-Ins: Some add-ins offer pre-built VBA macros and functions tailored to specific financial modeling needs, saving you time and effort in coding.
  • Excel Add-Ins by Industry-Specific Providers: Depending on your industry, there may be specialized Excel add-ins designed to address sector-specific financial modeling challenges.

Each add-in serves a unique purpose and can significantly enhance your financial modeling capabilities. Depending on your specific needs and the complexity of your models, you may choose to incorporate one or more of these add-ins into your Excel toolkit.

Best Practices for Financial Modeling in Excel

Excel is a versatile tool for financial modeling, but creating accurate and reliable models requires adherence to best practices. These principles ensure that your models are transparent, error-free, and robust.

  • Consistency: Maintain a consistent structure and naming conventions for your worksheets, cells, and formulas. This makes your models more understandable and reduces the likelihood of errors.
  • Documentation: Clearly document assumptions, data sources, and the logic behind your formulas. Proper documentation enhances model transparency and facilitates future revisions.
  • Error Handling: Implement error-checking mechanisms and use Excel’s error functions to handle errors gracefully, providing meaningful error messages or alternative calculations.
  • Version Control: Establish a version control system to track changes and revisions to your models, ensuring that you can easily revert to previous versions if necessary.
  • Sensitivity Analysis: Perform sensitivity analysis by varying key inputs and assumptions to understand how changes affect your model’s outcomes. This helps in risk assessment and decision-making.
  • Validation and Testing: Regularly validate your models by cross-referencing them with external data or alternative methods. Thoroughly test your financial models to ensure accuracy.
  • Model Size and Efficiency: Keep your models efficient by minimizing the use of volatile functions, avoiding unnecessary calculations, and optimizing data tables.
  • Model Security: Protect sensitive financial models with password encryption and restrict access to authorized users only.
  • Regular Review: Periodically review and update your financial models to reflect changing business conditions, market dynamics, and regulatory requirements.
  • Training: Ensure that your team members are proficient in Excel and knowledgeable about the specific financial modeling techniques and assumptions used in your models.

Adhering to these best practices will help you build robust and reliable financial models that can withstand scrutiny, support informed decision-making, and contribute to your organization’s success.

Conclusion

Mastering advanced Excel functions is your passport to becoming a proficient financial modeler. With these tools in your arsenal, you can navigate complex calculations, analyze data with precision, and create compelling visualizations. Excel’s versatility, coupled with your newfound expertise, will empower you to make informed financial decisions, drive business growth, and excel in your financial modeling endeavors.

Remember, practice makes perfect. Continuously apply and refine your skills, stay updated with the latest Excel features, and leverage the vast resources available to Excel enthusiasts. Whether you’re a finance professional, analyst, or student, the knowledge gained from this guide will be your compass in the dynamic world of financial modeling.

Get Started With a Prebuilt Template!

Looking to streamline your business financial modeling process with a prebuilt customizable template? Say goodbye to the hassle of building a financial model from scratch and get started right away with one of our premium templates.

  • Save time with no need to create a financial model from scratch.
  • Reduce errors with prebuilt formulas and calculations.
  • Customize to your needs by adding/deleting sections and adjusting formulas.
  • Automatically calculate key metrics for valuable insights.
  • Make informed decisions about your strategy and goals with a clear picture of your business performance and financial health.