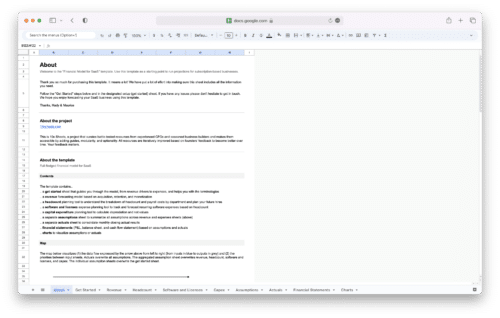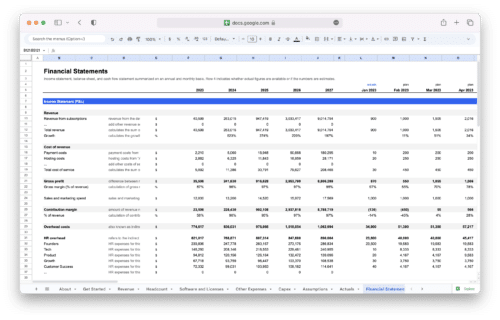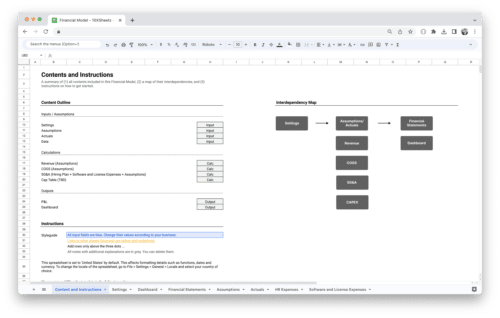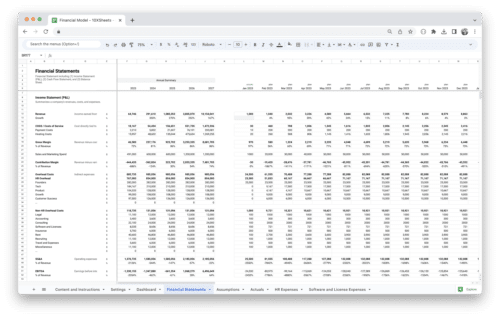
Get Started With a Prebuilt Model
Start with a free template and upgrade when needed.
Are you ready to unlock the secrets of user engagement and elevate your platform’s performance? In this guide, we delve deep into the realm of Weekly Active Users (WAU), the key to understanding how users interact with your digital world.
From calculating WAU and interpreting the data to implementing effective strategies, this guide equips you with the knowledge and tools to boost user engagement, make informed decisions, and drive your platform towards success.
What is WAU?
Weekly Active Users (WAU) is a vital metric that measures the number of unique users who engage with a digital platform or service within a specific seven-day period. It provides insights into user activity over a short timeframe, allowing businesses to assess user engagement and track trends.
The Significance of WAU
Understanding WAU is crucial for several reasons:
- Real-Time Engagement: WAU offers a real-time snapshot of user engagement, reflecting recent user interactions with your platform. This immediacy allows businesses to make timely adjustments and improvements.
- User-Centric Insights: WAU helps businesses gain a deeper understanding of their users’ behavior, preferences, and engagement patterns. This knowledge is essential for tailoring products and services to meet user needs effectively.
- Retention Assessment: WAU plays a key role in measuring user retention and identifying potential churn. Monitoring WAU trends can highlight areas where user retention strategies need improvement.
- Decision-Making: Businesses use WAU data to make data-driven decisions, optimize user experiences, and plan marketing efforts. It serves as a compass guiding strategic choices.
- Benchmarking and Growth: WAU data enables benchmarking against competitors and industry standards. Tracking WAU growth over time is a key indicator of a platform’s success and market relevance.
Why Tracking WAU is Essential for Businesses
WAU serves as the heartbeat of user engagement in the digital landscape. Here’s why tracking WAU is an essential practice for businesses:
- Timely Insights: WAU provides businesses with immediate insights into user engagement trends. Whether it’s the impact of a new feature release or a marketing campaign, WAU data is the first indicator of success or challenges.
- User-Centric Focus: By tracking WAU, businesses prioritize understanding their users’ preferences and behaviors. This user-centric approach fosters stronger customer relationships and loyalty.
- Performance Assessment: WAU is a powerful tool for evaluating a platform’s performance. It helps businesses identify areas for improvement and optimize user experiences to meet evolving needs.
- Strategic Decision-Making: WAU data informs strategic decisions, including resource allocation, marketing strategies, and product development. It empowers businesses to make informed choices aligned with user engagement goals.
- Competitive Advantage: Monitoring WAU allows businesses to benchmark themselves against competitors. A consistently growing WAU indicates a competitive edge in the market.
In summary, WAU is more than just a metric; it’s a vital compass for businesses navigating the digital landscape. By understanding its definition and recognizing its importance, businesses can harness the power of WAU to drive growth, enhance user satisfaction, and stay ahead in a competitive market.
Key WAU Metrics
When it comes to measuring user engagement, Weekly Active Users (WAU) is just one piece of the puzzle. To gain a comprehensive understanding of user behavior and the performance of your digital platform, it’s essential to be familiar with a range of related metrics. In this section, we’ll explore these key metrics and how they contribute to the bigger picture.
Understanding User Engagement Metrics
User engagement metrics provide valuable insights into how users interact with your platform and the level of interest they have in your offerings. Here are some crucial metrics to keep in mind:
- Daily Active Users (DAU): DAU represents the number of unique users who engage with your platform on any given day. It provides a real-time snapshot of your platform’s daily activity.
- Monthly Active Users (MAU): MAU is the count of unique users who interact with your platform over the course of a month. It offers a broader perspective on user engagement.
- Session Duration: This metric measures the average amount of time users spend during each session on your platform. It helps gauge user interest and involvement.
- Churn Rate: Churn rate indicates the percentage of users who stop using your platform within a specific period. It’s a critical metric for assessing user retention.
- User Retention: User retention measures the percentage of users who continue using your platform after a certain time frame, such as a week or a month. It reveals how well you retain your user base.
Each of these metrics provides unique insights into user behavior and engagement. By analyzing them in conjunction with WAU, you can gain a more holistic view of your platform’s performance and identify areas for improvement.
Differentiating WAU from other Engagement Metrics
While all user engagement metrics are valuable, WAU holds a distinct place in the analytics landscape due to its focus on a specific time frame: one week. Here’s how WAU differs from other engagement metrics:
- WAU vs. DAU: WAU considers user engagement over a week, providing a more extended view compared to the daily snapshot offered by DAU. It helps identify weekly trends and patterns.
- WAU vs. MAU: While MAU offers a monthly perspective, WAU provides more frequent insights, allowing you to assess user engagement on a weekly basis. This timeliness is crucial for proactive decision-making.
- WAU vs. Session Duration: Session duration provides insights into the quality of individual user interactions during a session. WAU complements this by giving you context about how these sessions aggregate over a week.
- WAU vs. Churn Rate: Churn rate measures user attrition over a more extended period. WAU, on the other hand, focuses on short-term engagement, making it ideal for addressing immediate issues and opportunities.
Understanding these distinctions and how WAU fits into the broader landscape of engagement metrics will help you make more informed decisions about your platform’s performance and user engagement strategies.
How to Calculate WAU?
Calculating Weekly Active Users (WAU) is a fundamental step in understanding the engagement of your user base over a specific week. In this section, we will walk you through the process of calculating WAU, starting with the data sources and tools you need, followed by the formula for WAU calculation, and practical examples to illustrate the concept.
Data Sources and Tools
To accurately calculate WAU, you’ll need access to user data from your digital platform or service. Here are some essential data sources and tools to consider:
- Analytics Platforms: Utilize web analytics tools like Google Analytics, Mixpanel, or Adobe Analytics to collect and analyze user engagement data. These platforms offer comprehensive insights into user activity.
- Custom Solutions: Some businesses develop custom analytics solutions tailored to their specific needs. Custom solutions can provide greater flexibility and control over data collection and analysis.
- Database Queries: If you have direct access to your user database, you can write SQL queries or use data analysis tools like Python with libraries such as Pandas and NumPy to extract and process user engagement data.
Formula for WAU Calculation
Calculating WAU is straightforward and involves a simple formula:
WAU = Number of unique users in the past week
To put it into practice, let’s consider a hypothetical scenario where you have the following daily user counts for a week:
- Monday: 1,200 users
- Tuesday: 1,300 users
- Wednesday: 1,400 users
- Thursday: 1,500 users
- Friday: 1,600 users
- Saturday: 1,700 users
- Sunday: 1,800 users
To calculate the WAU for this week, you would sum up the unique daily users and divide by seven (the number of days in a week):
WAU = (1,200 + 1,300 + 1,400 + 1,500 + 1,600 + 1,700 + 1,800) / 7 = 11,500 / 7 ≈ 1,643 users
So, in this example, your Weekly Active Users for the week are approximately 1,643 users. This number represents the unique users who engaged with your platform during that specific week.
Practical Examples
Let’s explore a few practical examples to illustrate WAU calculation in different scenarios:
Example 1: E-commerce Website
- Monday: 10,000 users
- Tuesday: 9,800 users
- Wednesday: 10,200 users
- Thursday: 10,100 users
- Friday: 10,300 users
- Saturday: 10,400 users
- Sunday: 10,500 users
WAU = (10,000 + 9,800 + 10,200 + 10,100 + 10,300 + 10,400 + 10,500) / 7 ≈ 10,185 users
In this case, the WAU for the e-commerce website during the week is approximately 10,185 users.
Example 2: Mobile App
- Monday: 5,000 users
- Tuesday: 5,100 users
- Wednesday: 5,200 users
- Thursday: 5,300 users
- Friday: 5,400 users
- Saturday: 5,500 users
- Sunday: 5,600 users
WAU = (5,000 + 5,100 + 5,200 + 5,300 + 5,400 + 5,500 + 5,600) / 7 ≈ 5,271 users
In this example, the WAU for the mobile app during the week is approximately 5,271 users.
By understanding how to calculate WAU and practicing with real data, you can effectively track and measure user engagement on your platform or app. This data is invaluable for making informed decisions and optimizing your user experience.
How to Interpret WAU Data?
Now that you’ve learned how to calculate Weekly Active Users (WAU), the next crucial step is interpreting the WAU data effectively. In this section, we’ll explore various aspects of interpreting WAU data to gain valuable insights into user engagement on your platform.
Analyzing Trends and Patterns
Analyzing trends and patterns in your WAU data is essential for understanding user behavior and making informed decisions. Here’s how you can effectively analyze WAU trends:
- Spikes in WAU: Look for sudden increases in WAU. These spikes could be the result of successful marketing campaigns, new feature releases, or external factors like holidays. Understanding what caused these spikes can help you replicate successful strategies.
- Declines in WAU: On the flip side, be alert to any declines in WAU. Decreases may indicate issues with your product, user dissatisfaction, or increased competition. Investigate the causes of declines promptly to address them.
- Consistency: A consistent and stable WAU over time is a positive sign, indicating a loyal user base. However, remember that growth is essential for long-term success. Monitor your WAU’s growth rate to ensure your user base continues to expand.
- User Segmentation: Segment your user base based on different criteria, such as demographics, geography, or behavior. Analyzing WAU data for different segments can reveal specific trends and preferences among user groups.
- Funnel Analysis: Use funnel analysis to track the user journey from initial sign-up to becoming a weekly active user. Identify drop-off points in the funnel and optimize those stages to improve WAU.
Identifying Seasonal Variations
Many businesses experience seasonal variations in their WAU data, driven by external factors like holidays, seasons, or industry-specific events. Understanding these variations is crucial for effective planning and resource allocation. Here’s how to identify and manage seasonal variations:
- Historical Data Analysis: Examine historical WAU data over multiple years to identify recurring seasonal patterns. This can help you predict when to expect increases or decreases in WAU.
- Event Planning: If you know that certain events or holidays typically drive increased user engagement, plan marketing campaigns and promotions around these times to maximize their impact.
- Resource Allocation: Allocate resources, such as customer support and server capacity, based on expected seasonal variations. This ensures your platform can handle increased activity during peak periods.
- Offer Seasonal Content: Tailor your content and offerings to align with seasonal trends and user preferences. Providing relevant content can boost user engagement during specific seasons.
Comparing WAU with Other Timeframes
To gain deeper insights into user engagement trends, it’s beneficial to compare WAU data with other timeframes. Here’s how you can effectively compare WAU with different timeframes:
- Week-over-Week (WoW): Comparing WAU data on a week-over-week basis helps you identify short-term trends. It’s useful for understanding the immediate impact of changes or campaigns.
- Month-over-Month (MoM): Analyzing WAU data on a month-over-month basis provides a broader perspective. It allows you to assess whether user engagement is increasing or decreasing over longer intervals.
- Year-over-Year (YoY): Comparing WAU data year-over-year helps you identify seasonal patterns and long-term growth trends. It’s particularly useful for strategic planning.
- Event-specific Comparisons: If you run specific events, promotions, or marketing campaigns, compare WAU data during those periods with baseline WAU to measure their effectiveness.
By comparing WAU data with different timeframes, you can track the impact of your strategies and initiatives over varying durations. This enables you to make data-driven decisions and refine your user engagement efforts.
Interpreting WAU data effectively is a continuous process that requires vigilance, data analysis skills, and a willingness to adapt to changing user behavior and market dynamics. By implementing the strategies outlined in this section, you can harness the power of WAU data to drive growth and user satisfaction on your platform.
How to Increase WAU?
Now that you understand how to interpret WAU data effectively, it’s time to explore strategies to increase your Weekly Active Users (WAU). Elevating your WAU requires a combination of user-centric approaches, retention strategies, product enhancements, and strategic marketing efforts. Let’s delve into these strategies.
User Engagement Techniques
User engagement is the cornerstone of increasing WAU. By implementing the following user engagement techniques, you can create a more compelling user experience that encourages frequent interactions:
- Personalization: Tailor user experiences based on individual preferences and behavior. Implement recommendation engines and personalized content to keep users engaged.
- Push Notifications: Use push notifications strategically to remind users of your platform’s value. Notify them about new content, promotions, or personalized recommendations to bring them back regularly.
- Gamification: Introduce game-like elements, such as challenges, badges, and rewards, to make your platform more engaging. Gamification can create a sense of achievement and competition among users.
- Content Creation: Encourage users to generate and share content within your platform. User-generated content not only enhances engagement but also fosters a sense of community and belonging.
- Interactive Features: Implement interactive features like quizzes, polls, and live chat to keep users actively engaged and entertained.
Retention Strategies
User retention is a critical component of increasing WAU. Retaining existing users is often more cost-effective than acquiring new ones. Here are some retention strategies to consider:
- Onboarding Optimization: Ensure a smooth onboarding process that helps users understand your platform’s value quickly. Provide tutorials, guided tours, or tooltips to make the initial experience user-friendly.
- Segmented Communication: Segment your user base and communicate with different user groups based on their behavior and preferences. Send targeted emails, in-app messages, or offers to re-engage users.
- Feedback Loop: Establish a feedback mechanism that allows users to provide input and suggestions. Act on user feedback to improve your platform continuously.
- User Support: Offer responsive customer support to address user queries and issues promptly. Positive support experiences can lead to higher user satisfaction and retention.
- Rewards and Loyalty Programs: Implement rewards and loyalty programs that incentivize users to return to your platform. Offer discounts, exclusive content, or loyalty points for continued engagement.
Product and Feature Enhancements
Constantly improving your product or platform is essential for sustaining user interest and increasing WAU. Consider the following product and feature enhancement strategies:
- User-Centric Development: Prioritize feature development based on user needs and feedback. Conduct user surveys and usability tests to identify areas for improvement.
- Feature Rollouts: Gradually introduce new features and updates rather than overwhelming users with drastic changes. Communicate these enhancements effectively to create anticipation.
- Performance Optimization: Ensure your platform is responsive, fast, and reliable. Users are more likely to engage regularly if they have a seamless experience.
- Content Freshness: Regularly update and refresh your content to provide users with new and relevant information. This is particularly important for content-driven platforms.
- Mobile Optimization: Optimize your platform for mobile devices to accommodate users who prefer mobile engagement. A mobile-responsive design can significantly impact WAU.
Marketing and Outreach Efforts
Effective marketing and outreach efforts are vital for attracting new users and re-engaging existing ones. Here are some strategies to consider:
- Social Media Promotion: Leverage social media platforms to promote your platform and engage with your audience. Share valuable content, run contests, and interact with users to build a community.
- Email Marketing: Use email marketing campaigns to reach out to users with personalized content, updates, and offers. Segment your email lists for more targeted messaging.
- Referral Programs: Encourage users to refer friends and family to your platform through referral programs. Reward both referrers and new sign-ups to incentivize growth.
- Influencer Partnerships: Collaborate with influencers or industry experts to promote your platform. Their endorsement can attract a wider audience.
- Content Marketing: Create high-quality, informative content that showcases your expertise and provides value to your target audience. Content marketing can drive organic traffic and engagement.
By implementing a combination of these strategies, you can create a dynamic and engaging environment that encourages users to return regularly and increase your WAU over time. Remember that user engagement is an ongoing process, and continuous improvement is key to success.
Tools and Software for WAU Tracking
Tracking Weekly Active Users (WAU) effectively requires the right tools and software to collect, analyze, and visualize data. In this section, we’ll explore various options for WAU tracking, including analytics platforms, custom solutions, and considerations for choosing the right tool for your business.
Analytics Platforms
Analytics platforms play a central role in gathering and interpreting WAU data. Here are some popular analytics platforms, including essential spreadsheet tools like Excel and Google Sheets:
- Google Analytics: Google Analytics is a widely used web analytics tool that provides in-depth insights into user behavior on websites and mobile apps. It offers features for tracking WAU and a range of other engagement metrics.
- Mixpanel: Mixpanel is a user analytics platform known for its ability to track user interactions and behaviors across web and mobile applications. It allows you to create custom events and funnels for precise WAU tracking.
- Adobe Analytics: Adobe Analytics offers robust analytics and reporting capabilities, enabling you to measure user engagement across various digital channels. It provides detailed segmentation options for WAU analysis.
- Excel: Excel is a versatile spreadsheet tool that can be used for basic WAU tracking and analysis. You can create custom reports, charts, and pivot tables to visualize WAU data.
- Google Sheets: Google Sheets is a cloud-based spreadsheet tool similar to Excel. It allows for collaborative data analysis and visualization, making it suitable for smaller businesses or teams with basic tracking needs.
While these analytics platforms differ in terms of features and complexity, they all provide valuable insights into user engagement, including WAU. Choose the one that best suits your business’s size, needs, and budget.
Custom Solutions and Dashboards
For businesses with specific tracking requirements or unique data sources, custom solutions and dashboards can be invaluable. Here’s how you can leverage custom solutions:
- Custom Analytics Dashboards: Develop custom dashboards using tools like Tableau, Power BI, or Domo. These platforms allow you to consolidate data from various sources, including WAU data, and create visually compelling reports.
- API Integrations: If you have in-house development resources, consider building custom integrations using APIs (Application Programming Interfaces). This approach allows you to connect your data sources and extract WAU data for analysis.
- Data Warehousing: Store historical WAU data in a data warehouse like Amazon Redshift, Google BigQuery, or Snowflake. Data warehousing enables complex querying and reporting, making it suitable for large-scale businesses.
- Mobile App SDKs: If you have a mobile app, integrate Software Development Kits (SDKs) like Firebase Analytics or Amplitude to track user engagement, including WAU, within your app.
Choosing the Right Tool for Your Business
Selecting the right tool for WAU tracking depends on several factors, including your business’s size, goals, and budget. Here are considerations to keep in mind:
- Scalability: Consider whether the tool can scale with your business as it grows. Ensure it can handle increasing data volumes and user interactions.
- Budget: Evaluate the cost of the tool, including subscription fees, licensing, and implementation costs. Determine whether the ROI justifies the expenses.
- Data Sources: Assess the compatibility of the tool with your data sources. Ensure it can integrate with your website, mobile app, or other platforms where WAU data is generated.
- Ease of Use: Consider the usability of the tool and whether your team can effectively use it for tracking and analysis. User-friendly tools can expedite the learning curve.
- Customization: Determine whether the tool allows for customization to meet your specific tracking and reporting needs. Customization can lead to more accurate WAU tracking.
- Support and Training: Check if the tool provides adequate customer support and training resources. Responsive support can help resolve issues promptly.
- Security and Compliance: Ensure that the tool complies with data security and privacy regulations, especially if you handle sensitive user data.
- Reporting and Visualization: Evaluate the tool’s reporting and visualization capabilities. Clear and insightful reports are essential for deriving actionable insights from WAU data.
By carefully considering these factors and aligning them with your business’s goals and resources, you can choose the right tool or combination of tools for effective WAU tracking and analysis. Remember that the tool you select should empower you to make data-driven decisions that enhance user engagement and drive business growth.
Common Mistakes to Avoid When Using WAU
To make the most of Weekly Active Users (WAU) data, it’s essential to be aware of common mistakes that businesses and analysts often make. In this section, we’ll explore some of these pitfalls and provide guidance on how to avoid them.
Misinterpretation of Data
- Focusing Solely on High WAU Numbers: While a high WAU is generally positive, it can be misleading if it doesn’t align with your business goals. A large number of users may not necessarily translate to revenue or value. Ensure your interpretation considers the quality of engagement, conversion rates, and other relevant metrics.
- Ignoring User Segmentation: Treating all users as a homogeneous group can lead to misinterpretation. Segment your user base based on demographics, behavior, or other relevant factors to uncover insights specific to different user groups.
- Overemphasizing Short-Term Trends: Weekly data can exhibit fluctuations. Avoid overreacting to short-term spikes or dips in WAU without considering long-term trends. Analyze data over multiple weeks or months to make more informed decisions.
- Ignoring Context: Context matters when interpreting WAU data. Consider external factors like holidays, marketing campaigns, or product updates that may impact user engagement. Failure to account for such factors can lead to misinterpretation.
Overlooking Key Metrics
- Ignoring Cohort Analysis: Cohort analysis involves grouping users by a common characteristic or behavior. It helps you track the engagement and retention of specific user groups over time. Overlooking cohort analysis can result in missed opportunities for improvement.
- Neglecting User Lifetime Value (LTV): WAU alone doesn’t provide insights into the long-term value users bring to your business. Calculate user LTV to understand the economic impact of different user segments and optimize your marketing and retention strategies accordingly.
- Not Tracking Churn Rate: Churn rate, the percentage of users who stop using your platform, is a critical metric for understanding user retention. Neglecting to track churn rate can result in missed opportunities to identify and address issues.
- Disregarding Engagement Quality: WAU represents quantity, but it doesn’t reveal the quality of user engagement. Assess user behavior within sessions, conversion rates, and user satisfaction to gain a more complete picture of engagement.
Neglecting User Feedback
- Lack of Feedback Mechanism: Failing to establish a feedback mechanism for users to voice their opinions and suggestions can hinder your ability to identify pain points and areas for improvement.
- Ignoring Negative Feedback: Negative feedback can provide valuable insights into user dissatisfaction and pain points. Ignoring or dismissing negative feedback can lead to user churn and missed opportunities for enhancement.
- Not Acting on Feedback: Collecting feedback is just the first step; taking action based on user input is equally important. Users appreciate when their suggestions lead to positive changes in the platform.
- Failure to Communicate Changes: If you make improvements based on user feedback, be sure to communicate these changes to your user base. Transparency can build trust and increase user satisfaction.
By being mindful of these common mistakes and actively working to avoid them, you can ensure that your use of WAU data is more accurate, insightful, and beneficial for your business.
Conclusion
Weekly Active Users (WAU) are your compass to navigate the seas of user engagement. By harnessing the power of WAU, you can steer your digital ship towards success, ensuring users stay engaged, satisfied, and loyal. Remember, it’s not just about numbers; it’s about understanding your audience, learning from their behavior, and constantly improving your platform. With the insights and strategies provided in this guide, you’re well-equipped to embark on a journey of growth, one WAU at a time.
As you move forward, always keep your users at the forefront of your efforts. Listen to their feedback, adapt to their needs, and evolve with their preferences. Continuously track your WAU, analyze the trends, and refine your strategies. User engagement is an ongoing voyage, and with the right knowledge and dedication, you can navigate it successfully.
Get Started With a Prebuilt Template!
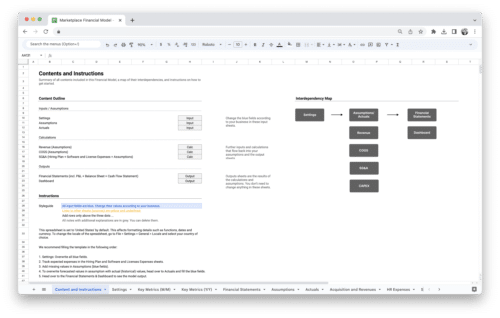
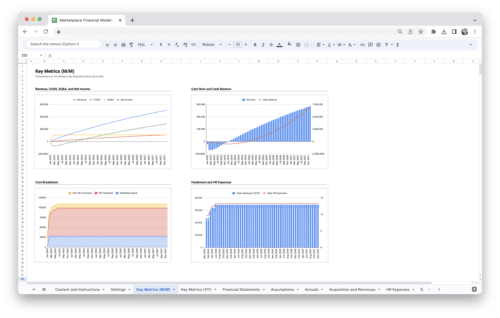
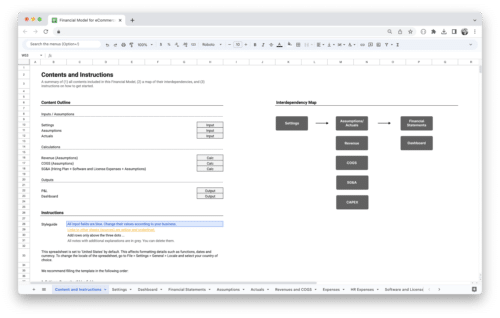
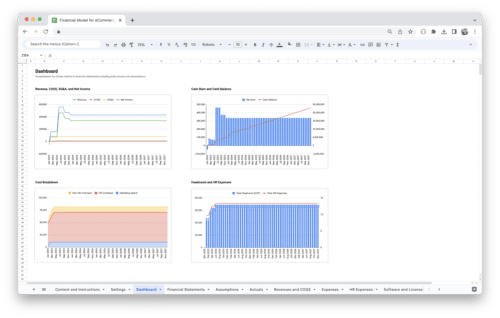
Looking to streamline your business financial modeling process with a prebuilt customizable template? Say goodbye to the hassle of building a financial model from scratch and get started right away with one of our premium templates.
- Save time with no need to create a financial model from scratch.
- Reduce errors with prebuilt formulas and calculations.
- Customize to your needs by adding/deleting sections and adjusting formulas.
- Automatically calculate key metrics for valuable insights.
- Make informed decisions about your strategy and goals with a clear picture of your business performance and financial health.
-
Sale!
Marketplace Financial Model Template
184,03 €Original price was: 184,03 €.125,21 €Current price is: 125,21 €.Value added tax is not collected, as small businesses according to §19 (1) UStG.
Add to Cart Details -
Sale!
E-Commerce Financial Model Template
184,03 €Original price was: 184,03 €.125,21 €Current price is: 125,21 €.Value added tax is not collected, as small businesses according to §19 (1) UStG.
Add to Cart Details -
Sale!
SaaS Financial Model Template
184,03 €Original price was: 184,03 €.125,21 €Current price is: 125,21 €.Value added tax is not collected, as small businesses according to §19 (1) UStG.
Add to Cart Details -
Sale!
Standard Financial Model Template
184,03 €Original price was: 184,03 €.125,21 €Current price is: 125,21 €.Value added tax is not collected, as small businesses according to §19 (1) UStG.
Add to Cart Details -
Sale!
E-Commerce Profit and Loss Statement
100,00 €Original price was: 100,00 €.66,39 €Current price is: 66,39 €.Value added tax is not collected, as small businesses according to §19 (1) UStG.
Add to Cart Details -
Sale!
SaaS Profit and Loss Statement
100,00 €Original price was: 100,00 €.66,39 €Current price is: 66,39 €.Value added tax is not collected, as small businesses according to §19 (1) UStG.
Add to Cart Details

