Have you ever wondered how businesses predict future trends, make strategic decisions, and stay ahead of the competition? Trend analysis is the key. It’s like peering into a crystal ball of data to uncover patterns, identify shifts, and anticipate what’s coming next. In the world of data-driven decision-making, trend analysis serves as a powerful tool, enabling organizations to extract insights from historical data, forecast future outcomes, and adapt their strategies to changing market conditions.
Whether it’s forecasting sales, analyzing financial market trends, or optimizing supply chain operations, trend analysis provides the roadmap for organizations to navigate the complexities of today’s dynamic business environment. In this guide, we’ll explore the fundamentals of trend analysis, its importance and applications across various industries, and practical strategies for conducting effective trend analysis.
What is Trend Analysis?
Trend analysis is a statistical technique used to identify and analyze patterns or trends in data over time. It involves examining historical data points and identifying recurring patterns, relationships, or directional changes in the data. Trend analysis enables organizations to understand the past performance, anticipate future trends, and make informed decisions based on empirical evidence rather than intuition or guesswork.
Importance and Applications of Trend Analysis
Trend analysis holds significant importance across various industries and domains, serving as a valuable tool for decision-making, strategic planning, and performance optimization:
- Business Planning and Strategy: Trend analysis helps organizations forecast future demand, identify market opportunities, and develop strategic plans to capitalize on emerging trends and mitigate risks.
- Financial Management: In finance, trend analysis is used to analyze historical financial data, identify patterns in revenue, expenses, and profitability, and make informed investment decisions.
- Marketing and Sales: Marketers use trend analysis to track consumer behavior, identify changing preferences, and develop targeted marketing campaigns to reach their target audience effectively.
- Supply Chain Management: Trend analysis is applied in supply chain management to forecast demand, optimize inventory levels, and improve operational efficiency and responsiveness.
- Risk Management: Risk managers leverage trend analysis to identify potential risks, assess their likelihood and impact, and develop strategies to mitigate risks before they escalate.
- Performance Evaluation: Trend analysis helps organizations monitor performance metrics, track progress towards goals, and identify areas for improvement or optimization.
Overview of How Trend Analysis Works
Trend analysis typically involves the following steps:
- Data Collection: Gather historical data from relevant sources, such as internal databases, external sources, or industry reports.
- Data Preparation: Clean and preprocess the data to ensure accuracy, completeness, and consistency.
- Exploratory Data Analysis (EDA): Conduct exploratory data analysis to identify patterns, trends, and relationships in the data using descriptive statistics, charts, and visualizations.
- Trend Identification: Use statistical techniques such as moving averages, linear regression, or exponential smoothing to identify trends and patterns in the data.
- Forecasting: Generate forecasts for future trends based on historical data and analytical models, taking into account factors such as seasonality, cyclical fluctuations, and external variables.
- Interpretation and Action: Interpret the results of trend analysis, draw actionable insights, and make informed decisions to guide business strategy, planning, and operations.
By following these steps, organizations can leverage trend analysis to gain valuable insights, anticipate market dynamics, and drive sustainable growth and innovation.
Types of Trends
Understanding the nuances of different types of trends is fundamental for conducting accurate trend analysis. Let’s explore each type in greater depth:
Upward Trends
Upward trends, also known as bullish trends, are characterized by a consistent and sustained increase in the values of a variable over time. These trends often signify growth, prosperity, and positive market sentiment. In the business world, upward trends may manifest as rising sales figures, increasing profitability, expanding market share, or climbing stock prices. They are indicative of a healthy and thriving market environment where demand is on the rise, consumer confidence is high, and businesses are experiencing positive outcomes.
Identifying upward trends early on allows businesses to capitalize on opportunities for growth and expansion. By recognizing the factors driving the upward trajectory, companies can allocate resources effectively, invest in strategic initiatives, and capitalize on market trends before competitors. Additionally, understanding the underlying drivers of upward trends enables businesses to make informed decisions about product development, marketing strategies, and expansion into new markets.
Downward Trends
Conversely, downward trends, also referred to as bearish trends, entail a sustained decline in the values of a variable over time. These trends are often associated with contraction, adversity, and negative market sentiment. In business, downward trends may manifest as decreasing sales figures, declining profitability, shrinking market share, or plummeting stock prices. They indicate challenges and obstacles that businesses may face, such as changing consumer preferences, economic downturns, or increased competition.
Recognizing and mitigating the impact of downward trends is crucial for businesses to maintain stability and resilience in challenging market conditions. By identifying the root causes of the downward trajectory, companies can implement strategies to minimize losses, streamline operations, and explore new revenue streams. Proactively addressing the challenges posed by downward trends allows businesses to adapt and evolve, ensuring their long-term sustainability and success in dynamic market environments.
Sideways Trends
Sideways trends, also known as horizontal or ranging trends, occur when the values of a variable fluctuate within a relatively narrow range over time. These trends indicate a lack of clear directionality in the data, often characterized by stability, consolidation, or indecision in the market. While sideways trends may not exhibit the dramatic shifts seen in upward or downward trends, they still provide valuable insights into market dynamics and potential areas of opportunity or risk.
For businesses, sideways trends present both challenges and opportunities. On one hand, they may signify market stagnation or uncertainty, making it difficult for businesses to forecast demand, plan investments, or develop growth strategies. On the other hand, sideways trends can also indicate periods of consolidation or accumulation, where market participants are assessing their positions and waiting for clearer signals before taking action. By closely monitoring sideways trends and identifying emerging patterns, businesses can position themselves strategically to capitalize on future market movements.
Seasonal Trends
Seasonal trends refer to patterns in data that occur at regular intervals, typically influenced by seasonal factors such as holidays, weather patterns, or cultural events. These trends exhibit predictable fluctuations in demand, consumption, or behavior, depending on the time of year. In industries such as retail, hospitality, or tourism, seasonal trends play a significant role in shaping business operations, marketing strategies, and revenue projections.
Understanding and forecasting seasonal trends is essential for businesses to optimize inventory management, resource allocation, and marketing campaigns throughout the year. By analyzing historical data and identifying recurring patterns, businesses can anticipate changes in consumer behavior, adjust their product offerings, and capitalize on seasonal opportunities. For example, retailers may ramp up their marketing efforts ahead of major holidays, launch seasonal promotions, or adjust their product mix to align with seasonal preferences. By leveraging seasonal trends effectively, businesses can maximize sales, enhance customer satisfaction, and drive long-term growth.
Cyclical Trends
Cyclical trends involve periodic fluctuations in data that occur over longer time frames, typically spanning several years. Unlike seasonal trends, which follow a predictable pattern based on calendar months or seasons, cyclical trends are driven by broader economic cycles, industry dynamics, or demographic shifts. These trends reflect the ebb and flow of economic activity, market sentiment, and consumer behavior over extended periods.
Examples of cyclical trends include the boom and bust cycles of financial markets, the housing market, or industries such as technology and automotive. Cyclical trends are influenced by factors such as interest rates, inflation, employment levels, and geopolitical events, which impact the overall health and direction of the economy. Recognizing the phases of the economic cycle and anticipating cyclical trends is essential for businesses to navigate changing market conditions, manage risks, and capitalize on emerging opportunities.
In summary, understanding the different types of trends and their implications is critical for businesses to make informed decisions, anticipate market dynamics, and adapt to changing conditions. By conducting thorough trend analysis and staying vigilant to emerging patterns, businesses can position themselves strategically for success in an increasingly competitive and dynamic business environment.
Trend Analysis Methods
Exploring various methods of trend analysis is crucial for accurately interpreting data patterns and making informed decisions. Let’s delve into each method in detail:
Moving Averages
Moving averages are a fundamental technique used in trend analysis to smooth out fluctuations in data and identify underlying trends. This method involves calculating the average value of a variable over a specified time period, with the “moving” aspect referring to the fact that the average is recalculated as new data becomes available.
How It Works:
- Moving averages are calculated by taking the average of a set of data points within a defined window or period.
- The moving average smooths out short-term fluctuations, making it easier to identify long-term trends.
- Common types of moving averages include simple moving averages (SMA) and exponential moving averages (EMA), each with its own calculation method and characteristics.
Example: Suppose you’re analyzing monthly sales data for a retail store. You calculate a 3-month moving average to smooth out short-term fluctuations and identify the underlying sales trend over time.
Linear Regression
Linear regression is a statistical method used to model the relationship between a dependent variable and one or more independent variables. In trend analysis, linear regression is employed to identify and quantify the direction and strength of trends in data.
How It Works:
- Linear regression fits a straight line to the data points, representing the best-fit trendline that minimizes the sum of squared errors.
- The slope of the regression line indicates the rate of change or trend direction, while the intercept represents the starting point of the trend.
- Linear regression analysis also provides metrics such as R-squared and p-values to assess the goodness of fit and statistical significance of the trend.
Example: Consider a scenario where you’re analyzing the relationship between advertising spending and sales revenue. By performing linear regression analysis, you can determine the extent to which changes in advertising expenditure impact sales performance over time.
Exponential Smoothing
Exponential smoothing is a technique for forecasting data points by assigning exponentially decreasing weights to historical observations. This method gives more weight to recent data points while gradually diminishing the influence of older observations.
How It Works:
- Exponential smoothing calculates a weighted average of past data points, with greater weight assigned to more recent observations.
- The smoothing parameter, often denoted as alpha (α), controls the rate at which older observations are discounted. A higher alpha value places more emphasis on recent data, while a lower alpha value gives greater weight to historical data.
- Exponential smoothing is particularly effective for capturing short-term trends and forecasting future values based on the latest information.
Example: Suppose you’re predicting monthly electricity consumption based on historical usage data. By applying exponential smoothing, you can generate forecasts that reflect recent consumption patterns while adjusting for seasonal variations and random fluctuations.
Time Series Decomposition
Time series decomposition involves breaking down a time series into its constituent components, such as trend, seasonality, and random noise. This method enables analysts to isolate and analyze each component separately, gaining insights into underlying patterns and trends.
How It Works:
- Time series decomposition typically involves separating the original data into three main components: trend, seasonality, and residuals (or error).
- The trend component represents the long-term direction or trajectory of the data.
- Seasonality captures recurring patterns or cycles that occur at fixed intervals, such as daily, weekly, or monthly.
- Residuals account for random fluctuations or irregularities in the data that cannot be explained by the trend or seasonality.
Example: Imagine you’re analyzing monthly sales data for a retail store. By decomposing the time series into trend and seasonality components, you can identify whether sales are growing steadily over time or if there are seasonal patterns driving fluctuations in sales volume.
Autocorrelation Analysis
Autocorrelation analysis examines the correlation between a time series and a lagged version of itself. This method helps identify patterns or dependencies within the data that repeat over time, providing insights into underlying trends and dynamics.
How It Works:
- Autocorrelation measures the degree of similarity between a time series and its lagged values at different time lags.
- Positive autocorrelation indicates a systematic relationship between past and present observations, suggesting the presence of a trend or pattern.
- Negative autocorrelation implies an inverse relationship between past and present observations, indicating potential reversals or cycles in the data.
Example: Suppose you’re analyzing daily stock returns for a particular asset. By conducting autocorrelation analysis, you can identify whether there are significant correlations between today’s returns and those from previous days, helping you anticipate future price movements and trends.
Data Collection and Preparation for Trend Analysis
Effectively collecting and preparing data is the cornerstone of successful trend analysis. Let’s explore each aspect in depth:
Identifying Relevant Data Sources
Identifying the right data sources is crucial for conducting meaningful trend analysis. Depending on the nature of your analysis and the specific variables you’re interested in, data sources can vary widely. These may include internal databases, external APIs, industry reports, government databases, or third-party data providers.
Considerations for Identifying Data Sources:
- Relevance: Ensure that the data sources you choose are relevant to your analysis objectives and provide the necessary information to answer your research questions.
- Reliability: Verify the reliability and credibility of the data sources to ensure that the data is accurate, up-to-date, and trustworthy.
- Scope: Assess the scope and coverage of the data sources to determine whether they encompass the entire population or sample of interest.
- Accessibility: Consider factors such as accessibility, availability, and cost associated with accessing the data sources.
Example: Suppose you’re conducting market research to analyze trends in consumer preferences for electric vehicles. You may gather data from industry reports, automotive manufacturers’ websites, consumer surveys, and government agencies’ databases to obtain comprehensive insights into consumer behavior and market dynamics.
Data Cleaning and Preprocessing
Data cleaning and preprocessing involve identifying and rectifying errors, inconsistencies, and anomalies in the dataset to ensure its accuracy and reliability for analysis. This process is essential for eliminating noise, improving data quality, and preparing the data for further analysis.
Steps in Data Cleaning and Preprocessing:
- Removing Duplicates: Identify and remove duplicate records or observations from the dataset to prevent redundancy and ensure data integrity.
- Handling Outliers: Detect and handle outliers or extreme values that may skew the analysis results or distort the underlying trends in the data.
- Standardizing Formats: Standardize data formats, units of measurement, and variable names to maintain consistency and facilitate analysis.
- Dealing with Errors: Address errors, inconsistencies, or missing values in the dataset through techniques such as data imputation, interpolation, or deletion.
- Data Transformation: Transform categorical variables into numerical representations and normalize skewed distributions to improve the performance of analytical models.
Example: In a dataset containing sales transactions for a retail business, you may encounter duplicate entries, missing values, and inconsistencies in product codes or pricing information. By conducting data cleaning and preprocessing, you can remove duplicates, fill in missing values using appropriate methods, and standardize product codes to ensure accurate and reliable analysis of sales trends.
Handling Missing Data
Missing data is a common challenge in data analysis that can compromise the integrity and validity of trend analysis results. It’s essential to implement strategies for handling missing data effectively to minimize bias and ensure the robustness of the analysis.
Strategies for Handling Missing Data:
- Data Imputation: Impute missing values using techniques such as mean imputation, median imputation, or regression imputation based on patterns observed in the remaining data.
- Deletion: Remove observations with missing values from the dataset, either listwise deletion (removing entire rows) or pairwise deletion (removing missing values on a variable-by-variable basis).
- Predictive Modeling: Use predictive modeling techniques such as machine learning algorithms to predict missing values based on other variables in the dataset.
- Multiple Imputation: Generate multiple imputed datasets and combine the results to account for uncertainty and variability in the missing data.
Example: In a dataset containing customer demographics and purchase history, you may encounter missing values for certain demographic variables such as age or income. By applying data imputation techniques, you can estimate missing values based on available information such as gender, location, or purchasing behavior, thereby preserving the integrity of the dataset for trend analysis.
Normalization and Standardization
Normalization and standardization are techniques used to transform data into a common scale or format, making it easier to compare variables and interpret the results of trend analysis. These techniques are particularly useful when dealing with variables that have different scales or units of measurement.
Normalization vs. Standardization:
- Normalization: Rescales data to a range between 0 and 1, often used when the distribution of the data is unknown or non-normal.
- Standardization: Centers the data around a mean of 0 and standard deviation of 1, making it suitable for variables with different scales or units.
Benefits of Normalization and Standardization:
- Facilitates Comparison: Allows for meaningful comparison of variables with different scales or units of measurement.
- Improves Model Performance: Enhances the performance and convergence of analytical models by ensuring that all variables contribute equally to the analysis.
- Interpretability: Simplifies the interpretation of coefficients, coefficients of variation, and other statistical measures derived from the data.
Example: Suppose you’re analyzing customer satisfaction scores and sales revenue for a retail business. By normalizing or standardizing both variables, you can compare their relative importance and impact on overall business performance, regardless of their original scales or measurement units.
How to Perform Trend Analysis?
Analyzing trends requires a systematic approach involving the selection of appropriate analytical tools, visualization of trends, interpretation of results, and identification of outliers and anomalies.
Selecting Appropriate Analytical Tools
Choosing the right analytical tools is critical for conducting effective trend analysis. The selection process involves considering factors such as the nature of the data, analysis objectives, and the complexity of the trends being analyzed.
Factors to Consider When Selecting Analytical Tools:
- Data Characteristics: Assess whether the data is time-series data, cross-sectional data, or panel data, as different types of data may require different analytical techniques.
- Analysis Goals: Determine the specific objectives of the analysis, such as identifying long-term trends, forecasting future values, or detecting patterns in the data.
- Complexity of Trends: Consider the complexity of the trends present in the data, such as linear trends, seasonal patterns, or cyclical fluctuations.
- Technical Expertise: Evaluate the technical proficiency of the analyst and the availability of tools and software for performing the analysis.
Visualizing Trends with Charts and Graphs
Visualizing trends using charts and graphs is an essential step in trend analysis, as it allows analysts to explore patterns, identify outliers, and communicate insights effectively.
Common Types of Charts and Graphs Used for Trend Analysis:
- Line Charts: Display trends over time by connecting data points with a line, making them ideal for visualizing continuous data series.
- Bar Charts: Compare trends across different categories or time periods using vertical or horizontal bars, facilitating comparisons and highlighting variations.
- Scatter Plots: Explore relationships between two variables by plotting data points on a two-dimensional graph, enabling analysts to identify correlations or clusters.
- Histograms: Illustrate the distribution of data values by dividing them into bins or intervals and displaying the frequency of observations in each bin.
Interpreting Trend Analysis Results
Interpreting trend analysis results involves extracting meaningful insights from the data, understanding the implications of observed trends, and drawing conclusions to inform decision-making.
Key Steps in Interpreting Trend Analysis Results:
- Identify Trends: Determine the direction, magnitude, and significance of trends observed in the data, such as upward trends, downward trends, or seasonal patterns.
- Understand Drivers: Explore the factors driving the observed trends, such as changes in market conditions, consumer behavior, or external events.
- Assess Implications: Evaluate the potential impact of the observed trends on business performance, market dynamics, or future outcomes.
- Draw Conclusions: Synthesize the findings of the analysis and draw actionable conclusions to guide decision-making and strategy development.
Identifying Outliers and Anomalies
Detecting outliers and anomalies is crucial for ensuring the accuracy and reliability of trend analysis results. Outliers may indicate errors in the data, unusual events, or significant deviations from expected patterns.
Approaches for Identifying Outliers and Anomalies:
- Statistical Methods: Use statistical techniques such as z-scores, quartiles, or standard deviations to identify observations that fall outside the expected range.
- Visualization Techniques: Visualize the data using scatter plots, box plots, or histograms to identify data points that deviate significantly from the overall trend.
- Domain Knowledge: Leverage domain expertise and subject matter knowledge to interpret outliers in the context of the specific industry, market, or business environment.
- Machine Learning Algorithms: Apply machine learning algorithms such as clustering, classification, or anomaly detection to automatically identify unusual patterns or anomalies in the data.
By systematically selecting appropriate analytical tools, visualizing trends effectively, interpreting analysis results accurately, and identifying outliers and anomalies, analysts can conduct comprehensive trend analysis and derive actionable insights to support decision-making and strategic planning processes.
Trend Analysis Applications
Trend analysis finds extensive applications across various industries and domains, providing valuable insights for decision-making, strategy development, and performance optimization.
Business Forecasting
Business forecasting involves predicting future trends, outcomes, or events based on historical data and analytical techniques. Trend analysis plays a crucial role in business forecasting by identifying patterns, extrapolating trends, and generating forecasts for key business metrics such as sales, revenue, expenses, and customer demand. By leveraging trend analysis, organizations can anticipate market dynamics, allocate resources effectively, and develop strategies to capitalize on emerging opportunities and mitigate potential risks.
Financial Market Analysis
In financial markets, trend analysis is utilized to analyze price movements, identify market trends, and make investment decisions. Technical analysts use various charting techniques, such as moving averages, trendlines, and chart patterns, to analyze historical price data and forecast future price movements. Trend analysis helps traders and investors identify bullish or bearish trends, detect trend reversals, and develop trading strategies based on momentum or trend-following approaches. Additionally, trend analysis is applied in fundamental analysis to assess the long-term performance and growth prospects of companies, industries, and economies.
Marketing Strategy Development
Trend analysis plays a critical role in marketing strategy development by providing insights into consumer behavior, market trends, and competitive dynamics. Marketers use trend analysis to identify evolving consumer preferences, emerging market trends, and shifts in industry dynamics. By analyzing historical sales data, market research findings, and consumer insights, marketers can identify patterns, forecast future demand, and develop targeted marketing campaigns to reach their target audience effectively. Trend analysis also helps marketers monitor the performance of marketing initiatives, evaluate the effectiveness of promotional activities, and adapt strategies to changing market conditions.
Risk Management
Risk management involves identifying, assessing, and mitigating risks that may impact the achievement of organizational objectives. Trend analysis is used in risk management to identify potential risk factors, assess their likelihood and impact, and develop risk mitigation strategies. By analyzing historical data and trends, risk managers can identify recurring patterns, anticipate potential threats, and implement proactive measures to mitigate risks before they escalate. Trend analysis also helps organizations monitor key risk indicators, detect early warning signs of emerging risks, and make informed decisions to protect against adverse events and uncertainties.
Supply Chain Optimization
In supply chain management, trend analysis is used to optimize inventory management, production planning, and logistics operations. By analyzing historical demand patterns, supplier performance data, and lead times, supply chain professionals can identify trends, forecast future demand, and optimize inventory levels to meet customer requirements while minimizing costs and maximizing efficiency. Trend analysis also helps organizations identify opportunities for process improvement, identify bottlenecks or inefficiencies in the supply chain, and implement strategies to enhance operational performance and responsiveness to changing market conditions.
By applying trend analysis in business forecasting, financial market analysis, marketing strategy development, risk management, and supply chain optimization, organizations can gain valuable insights, make informed decisions, and drive sustainable growth and profitability. Trend analysis serves as a powerful tool for understanding past trends, predicting future outcomes, and navigating uncertainties in a dynamic and competitive business environment.
Trend Analysis Challenges and Limitations
Trend analysis, while a valuable tool for decision-making and strategic planning, comes with its own set of challenges and limitations that practitioners need to be aware of:
- Data Quality: One of the primary challenges in trend analysis is ensuring the quality and reliability of the data. Inaccurate, incomplete, or biased data can lead to erroneous conclusions and undermine the validity of the analysis results.
- Data Availability: Limited access to relevant data sources or insufficient historical data can hinder the effectiveness of trend analysis. Without access to comprehensive and up-to-date data, analysts may struggle to identify meaningful patterns or trends.
- Assumption of Linearity: Many analytical techniques used in trend analysis assume linear relationships between variables, which may not always hold true in real-world scenarios. Non-linear trends, seasonality, and other complex patterns may require more sophisticated analytical methods.
- Overfitting: Overfitting occurs when analytical models capture noise or random fluctuations in the data, leading to poor generalization and predictive performance. Analysts must strike a balance between model complexity and simplicity to avoid overfitting.
- Interpretation Bias: Human biases and preconceptions can influence the interpretation of trend analysis results, leading to subjective conclusions or misinterpretation of trends. Objectivity and critical thinking are essential to mitigate interpretation bias.
Best Practices for Effective Trend Analysis
To overcome the challenges and maximize the effectiveness of trend analysis, practitioners can follow these best practices:
- Define Clear Objectives: Clearly define the objectives and scope of the analysis, including the specific variables of interest, time frame, and desired outcomes. Having clear objectives helps focus the analysis and guide decision-making.
- Use Multiple Data Sources: Utilize diverse data sources, including internal databases, external sources, and domain-specific data, to gain a comprehensive understanding of trends and patterns.
- Validate Data Quality: Validate the quality and reliability of the data through data validation techniques, data cleansing, and verification against independent sources.
- Consider Multiple Perspectives: Consider multiple perspectives and alternative hypotheses when interpreting trend analysis results to avoid confirmation bias and ensure robustness.
- Leverage Advanced Analytical Techniques: Explore advanced analytical techniques such as machine learning, time series analysis, and predictive modeling to uncover hidden patterns and relationships in the data.
- Regularly Monitor and Update Analysis: Continuously monitor trends, reassess assumptions, and update analysis methodologies as new data becomes available or market conditions change.
- Communicate Findings Effectively: Clearly communicate the findings of trend analysis to stakeholders using visualizations, reports, and presentations, emphasizing actionable insights and recommendations.
By adhering to these best practices, organizations can enhance the quality, accuracy, and relevance of trend analysis, enabling them to make informed decisions, anticipate market trends, and drive sustainable growth and innovation.
Conclusion
Trend analysis is a powerful tool that empowers organizations to make informed decisions, anticipate future trends, and navigate the complexities of today’s business landscape. By leveraging historical data and analytical techniques, organizations can uncover valuable insights, identify patterns, and forecast future outcomes with confidence. Whether it’s optimizing business operations, mitigating risks, or driving strategic growth initiatives, trend analysis provides the roadmap for success in a rapidly changing world.
As we’ve explored in this guide, trend analysis is not just about looking backward; it’s about looking forward with clarity and foresight. By following best practices, utilizing appropriate analytical tools, and staying vigilant to emerging trends, organizations can harness the power of trend analysis to drive innovation, enhance competitiveness, and achieve sustainable growth in the ever-evolving marketplace.
Get Started With a Prebuilt Template!
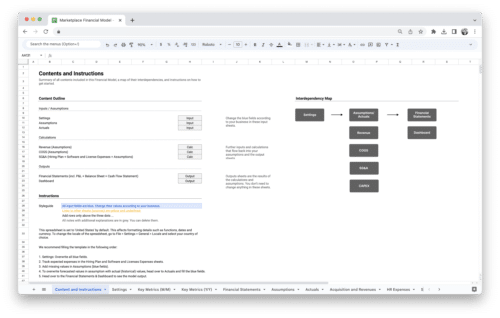
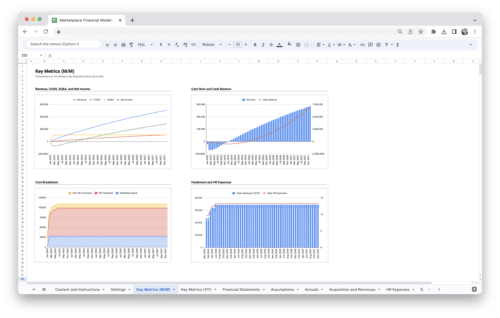
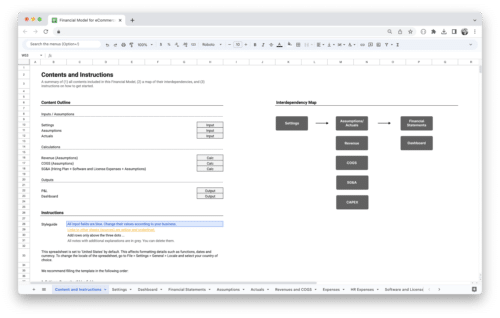
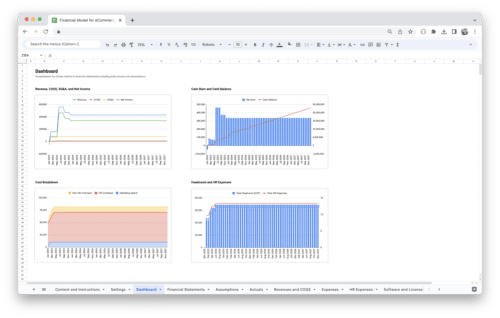
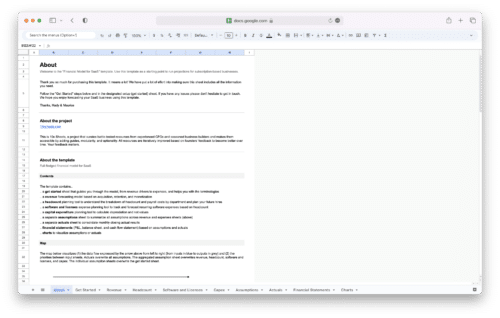
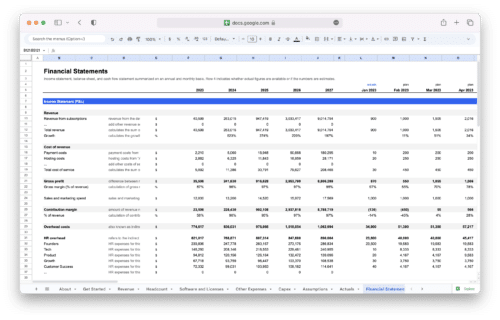
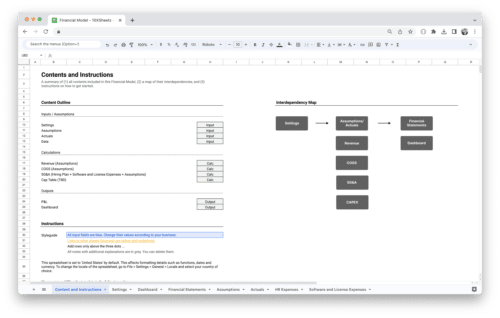
Looking to streamline your business financial modeling process with a prebuilt customizable template? Say goodbye to the hassle of building a financial model from scratch and get started right away with one of our premium templates.
- Save time with no need to create a financial model from scratch.
- Reduce errors with prebuilt formulas and calculations.
- Customize to your needs by adding/deleting sections and adjusting formulas.
- Automatically calculate key metrics for valuable insights.
- Make informed decisions about your strategy and goals with a clear picture of your business performance and financial health.

