Are you ready to decipher the financial health of a company and make well-informed decisions that can shape its future? Understanding Solvency Ratios is your gateway to unraveling the intricate web of financial stability, risk assessment, and strategic planning. In this guide, we’ll dive deep into the world of Solvency Ratios, demystifying their significance, exploring their real-world applications, and equipping you with the knowledge to navigate the complex landscape of financial analysis with confidence. Join us on this exploration of financial insight and empowerment.
What are Solvency Ratios?
Solvency Ratios are financial metrics that provide insight into a company’s ability to meet its long-term financial obligations. These ratios assess the proportion of debt in a company’s capital structure, its capacity to cover interest and principal payments, and its overall financial stability. Solvency Ratios are essential tools for evaluating a company’s financial health and risk profile.
Importance of Solvency Ratios
Understanding the importance of Solvency Ratios is crucial for investors, creditors, and business owners alike. Here are key reasons why Solvency Ratios hold significant value:
- Risk Assessment: Solvency Ratios help assess the level of financial risk associated with a company’s capital structure. Higher ratios may indicate higher financial risk, while lower ratios suggest a more conservative financial approach.
- Investment Decisions: Investors use Solvency Ratios to gauge the financial stability of potential investments. Companies with stronger solvency profiles are often considered more attractive for long-term investments.
- Creditworthiness: Lenders and creditors rely on Solvency Ratios to evaluate a company’s ability to repay loans. Strong solvency ratios can lead to more favorable lending terms and lower interest rates.
- Strategic Planning: Businesses use these ratios for strategic financial planning. They guide decisions on capital allocation, debt management, and financing options, ensuring alignment with long-term growth objectives.
- Risk Mitigation: Identifying companies with high financial risk through Solvency Ratios allows for proactive risk mitigation measures. Diversifying investments or securing collateral for loans are examples of such strategies.
Why Solvency Ratios Matter to Businesses
For businesses themselves, Solvency Ratios play a critical role in shaping financial decisions and ensuring long-term viability. Here’s why these ratios matter to businesses:
- Financial Stability: Strong Solvency Ratios contribute to financial stability, enabling businesses to navigate economic uncertainties and market fluctuations more effectively.
- Access to Capital: Maintaining healthy solvency ratios enhances a company’s creditworthiness, making it easier to secure financing for growth initiatives or operational needs.
- Strategic Growth: Solvency Ratios guide decisions on the optimal mix of debt and equity for strategic growth. They help businesses strike the right balance between risk and opportunity.
- Investor Confidence: Demonstrating strong solvency ratios can instill confidence in investors and shareholders, attracting capital and support for expansion and innovation.
- Risk Management: Monitoring Solvency Ratios allows businesses to identify potential solvency risks in advance and take timely corrective actions.
- Competitive Advantage: Maintaining favorable solvency ratios can provide a competitive advantage, as it signals financial strength and reliability to customers, suppliers, and partners.
In conclusion, Solvency Ratios are not just analytical tools; they are critical indicators of a company’s financial well-being. They serve as essential compasses for navigating the complex financial landscape, helping stakeholders make informed decisions that ultimately impact a company’s growth, stability, and long-term success.
Types of Solvency Ratios
Let’s delve deeper into the various types of Solvency Ratios that are commonly used to assess a company’s financial stability and ability to meet its long-term obligations. Each of these ratios provides unique insights into different aspects of a company’s financial health.
Debt-to-Equity Ratio
The Debt-to-Equity Ratio is a fundamental solvency ratio that measures the balance between a company’s long-term debt and its shareholders’ equity. It is a key indicator of a company’s financial leverage and risk.
Formula:
Debt-to-Equity Ratio = Total Debt / Shareholder
- Interpretation: A high Debt-to-Equity Ratio indicates that the company relies heavily on debt financing, which can be risky but may also signal potential for higher returns. Conversely, a low ratio suggests a conservative financial structure.
Debt Ratio
The Debt Ratio, sometimes referred to as the Debt-to-Asset Ratio, assesses the proportion of a company’s total assets that are financed by debt. It is a valuable metric for evaluating the financial risk associated with a company’s capital structure.
Formula:
Debt Ratio = Total Debt / Total Assets
- Interpretation: A high Debt Ratio signifies that a significant portion of a company’s assets are funded through debt, potentially increasing financial vulnerability. A lower ratio indicates a more conservative approach to financing.
Interest Coverage Ratio
The Interest Coverage Ratio evaluates a company’s ability to meet its interest expenses with its operating earnings before interest and taxes (EBIT). This ratio is essential for both creditors and investors to assess the company’s capacity to service its debt obligations.
Formula:
Interest Coverage Ratio = EBIT / Interest Expenses
- Interpretation: A higher Interest Coverage Ratio suggests that the company generates sufficient earnings to comfortably cover its interest payments. Conversely, a low ratio may indicate financial distress and an increased risk of default.
Debt Service Coverage Ratio
The Debt Service Coverage Ratio takes a broader perspective by assessing a company’s ability to meet both principal and interest payments on its debt. Lenders often use this ratio to evaluate the company’s financial capacity to repay loans.
Formula:
Debt Service Coverage Ratio = (Net Operating Income + Depreciation) / Total Debt Service
- Interpretation: A ratio greater than 1 indicates that the company generates enough cash flow to cover its debt service obligations. A ratio less than 1 raises concerns about the company’s ability to meet its financial commitments.
Fixed Charge Coverage Ratio
The Fixed Charge Coverage Ratio extends the analysis to include fixed expenses such as lease payments in addition to interest. This ratio offers a comprehensive view of a company’s ability to meet its fixed financial obligations.
Formula:
Fixed Charge Coverage Ratio = (EBIT + Fixed Charges) / (Interest + Fixed Charges)
- Interpretation: A higher Fixed Charge Coverage Ratio suggests that the company can comfortably meet both interest and other fixed expenses, indicating greater financial stability. Conversely, a lower ratio may indicate financial strain.
Understanding these Solvency Ratios and their implications is vital for assessing a company’s financial health and making informed investment or lending decisions. Each ratio provides a unique perspective on a company’s financial stability and risk, allowing you to gain a more comprehensive understanding of its financial position.
How to Calculate Solvency Ratios?
Now that you are familiar with the various types of Solvency Ratios, it’s essential to understand how to calculate them and interpret the results effectively.
Formula and Components for Each Solvency Ratio
Debt-to-Equity Ratio
Formula:
Debt-to-Equity Ratio = Total Debt / Shareholder
- Total Debt: This includes all long-term and short-term debts of the company, such as bank loans, bonds, and credit lines.
- Shareholder’s Equity: Shareholder’s equity comprises common and preferred stock, retained earnings, and additional paid-in capital.
Example: Let’s say Company ABC has total debt of $2 million and shareholder’s equity of $4 million. Using the formula:
In this case, the Debt-to-Equity Ratio is 0.5, indicating that for every dollar of equity, the company has 50 cents in debt.
Debt Ratio
Formula:
Debt Ratio = Total Debt / Total Assets
- Total Debt: As mentioned earlier, this includes all long-term and short-term debts.
- Total Assets: Total assets represent the sum of a company’s current and non-current assets.
Example: Suppose Company XYZ has total debt of $1.5 million and total assets of $3 million. Calculating the Debt Ratio:
Debt Ratio = $1,500,000 / $3,000,000 = 0.5
The Debt Ratio is 0.5 or 50%, meaning that half of Company XYZ’s assets are funded through debt.
Interest Coverage Ratio
Formula:
Interest Coverage Ratio = EBIT / Interest Expenses
Example: If Company PQR has an EBIT of $2 million and incurs $500,000 in interest expenses:
Interest Coverage Ratio = $2,000,000 / $500,000 = 4
The Interest Coverage Ratio of 4 indicates that Company PQR’s earnings are four times its interest expenses, suggesting it can comfortably meet its interest obligations.
Debt Service Coverage Ratio
Formula:
Debt Service Coverage Ratio = (Net Operating Income + Depreciation) / Total Debt Service
Example: Suppose Company LMN has a net operating income of $1.2 million, depreciation of $400,000, and total debt service of $800,000:
Debt Service Coverage Ratio = ($1,200,000 + $400,000) / $800,000 = 2
A Debt Service Coverage Ratio of 2 indicates that Company LMN generates twice the cash flow required to service its debt.
Fixed Charge Coverage Ratio
Formula:
Fixed Charge Coverage Ratio = (EBIT + Fixed Charges) / (Interest + Fixed Charges)
- Fixed Charges: In addition to interest, fixed charges include lease payments, insurance premiums, and other non-variable expenses.
Example: If Company UVW has an EBIT of $3 million, fixed charges of $600,000, and interest expenses of $400,000:
Fixed Charge Coverage Ratio = ($3,000,000 + $600,000) / ($400,000 + $600,000) = 4
With a Fixed Charge Coverage Ratio of 4, Company UVW demonstrates a strong ability to cover both interest and other fixed expenses.
Understanding the formulas and components for each Solvency Ratio is vital for calculating these ratios accurately. These calculations provide valuable insights into a company’s financial structure, risk exposure, and capacity to meet its financial obligations.
Interpretation of Solvency Ratio Results
Interpreting Solvency Ratios is essential to assess a company’s financial health effectively. Here’s how to interpret the results for each ratio:
- Debt-to-Equity Ratio: A high ratio indicates higher financial leverage and risk, while a low ratio suggests a conservative financial structure.
- Debt Ratio: A high Debt Ratio signifies a significant reliance on debt financing, potentially increasing financial vulnerability.
- Interest Coverage Ratio: A higher ratio indicates the company can comfortably cover its interest payments, while a low ratio may indicate financial distress.
- Debt Service Coverage Ratio: A ratio above 1 suggests the company generates enough cash flow to meet its debt service obligations.
- Fixed Charge Coverage Ratio: A higher ratio suggests the company can comfortably meet both interest and other fixed expenses.
Interpretation depends on industry standards, the company’s specific financial goals, and its risk tolerance. Analyzing these ratios collectively provides a comprehensive view of a company’s solvency and helps you make informed financial decisions.
Significance of Solvency Ratios
Understanding the significance of Solvency Ratios is essential for anyone involved in financial analysis or decision-making within a company. These ratios offer valuable insights into a company’s financial health and stability, helping you assess its ability to meet long-term financial obligations.
What Solvency Ratios Reveal About a Company’s Financial Health
Solvency Ratios are powerful indicators that provide a deep dive into a company’s financial health, specifically regarding its long-term financial stability. Here’s what these ratios can reveal:
- Risk Assessment: Solvency Ratios help gauge the level of financial risk a company carries. A higher Debt-to-Equity Ratio or Debt Ratio may indicate greater financial risk, as a significant portion of the company’s financing comes from debt.
- Investment Potential: Investors use Solvency Ratios to assess a company’s attractiveness for long-term investments. Companies with lower risk ratios may be more appealing to investors seeking stability in their portfolios.
- Creditworthiness: Lenders and creditors use these ratios to evaluate a company’s creditworthiness. A high level of solvency suggests a lower risk of default, potentially resulting in more favorable lending terms and lower interest rates.
- Sustainability: Solvency Ratios provide insights into the sustainability of a company’s capital structure. A well-balanced mix of debt and equity can contribute to long-term financial stability.
- Strategic Planning: Companies use Solvency Ratios for strategic financial planning. It helps them make decisions about raising capital, paying down debt, or optimizing their financial structure to align with their growth objectives.
In essence, Solvency Ratios serve as a financial health check, allowing you to assess whether a company is on solid ground or facing financial challenges.
How Solvency Ratios Differ from Liquidity Ratios
It’s important to differentiate between Solvency Ratios and Liquidity Ratios, as they serve distinct purposes in financial analysis.
Solvency Ratios: These ratios focus on a company’s ability to meet long-term obligations, emphasizing financial stability and risk management. Solvency Ratios typically assess the capital structure and whether a company can repay its long-term debts.
Liquidity Ratios: In contrast, Liquidity Ratios primarily evaluate a company’s short-term financial health and its ability to meet immediate financial obligations. Liquidity Ratios, such as the Current Ratio and Quick Ratio, assess a company’s capacity to cover short-term liabilities with short-term assets.
While both types of ratios are crucial for a comprehensive financial analysis, Solvency Ratios are more concerned with long-term sustainability, whereas Liquidity Ratios focus on short-term cash flow and liquidity. Utilizing both sets of ratios provides a well-rounded view of a company’s overall financial well-being and helps you make informed decisions based on its specific financial needs and goals.
How to Use Solvency Ratios for Financial Analysis?
Understanding how to apply Solvency Ratios in practical financial analysis is crucial for making informed decisions in various aspects of business and investment. We’ll explore the applications of Solvency Ratios and discuss common industry standards and benchmarks that can guide your assessments.
Practical Applications in Decision-Making
Solvency Ratios serve as valuable tools in several financial decision-making scenarios, enabling you to make informed choices that align with your financial goals and risk tolerance:
- Investment Decisions: Investors use Solvency Ratios to assess the financial stability of companies before making investment decisions. A company with strong Solvency Ratios is often viewed as a safer long-term investment, whereas one with higher financial risk may offer the potential for higher returns but comes with greater uncertainty.
- Lending and Credit Decisions: Lenders and creditors rely on Solvency Ratios when evaluating loan applications. A company with healthy Solvency Ratios is more likely to secure loans at favorable terms and lower interest rates, as it demonstrates its ability to meet long-term obligations.
- Mergers and Acquisitions: When considering mergers or acquisitions, understanding a target company’s Solvency Ratios is essential. It helps assess the target’s financial stability and the potential risks associated with integrating it into your organization.
- Strategic Planning: Companies use Solvency Ratios as a strategic planning tool. These ratios guide decisions on capital structure, debt management, and financing options to align with growth objectives while minimizing financial risk.
- Risk Mitigation: Identifying companies with high levels of financial risk through Solvency Ratios allows you to take proactive measures to mitigate potential risks. This might involve diversifying your investment portfolio or securing collateral for loans.
- Comparative Analysis: Comparing a company’s Solvency Ratios to industry standards and competitors can provide insights into its relative financial strength. This information can guide strategic adjustments and competitive positioning.
Common Industry Standards and Benchmarks
To effectively use Solvency Ratios, it’s crucial to have a benchmark or reference point for comparison. Industry standards and benchmarks provide context for interpreting a company’s ratios. These benchmarks can vary by industry, but some common standards include:
- Debt-to-Equity Ratio: While acceptable levels of debt can vary widely by industry, a Debt-to-Equity Ratio below 1.0 is generally considered conservative, while ratios above 2.0 may indicate higher financial risk.
- Debt Ratio: A Debt Ratio below 0.5 (50%) is often seen as a conservative financial structure, while ratios exceeding 0.7 (70%) may suggest a high degree of financial leverage.
- Interest Coverage Ratio: A ratio of at least 2.0 is often considered a minimum threshold, indicating that a company generates enough earnings to cover its interest payments.
- Debt Service Coverage Ratio: A ratio greater than 1.0 indicates a company can meet its debt service obligations, but specific industry standards may vary.
- Fixed Charge Coverage Ratio: A ratio of 2.0 or higher is generally considered a sign of strong financial stability, but, as with other ratios, industry benchmarks may differ.
It’s important to note that industry standards can fluctuate over time and may be influenced by economic conditions. Therefore, it’s advisable to consider both industry-specific benchmarks and broader economic factors when analyzing Solvency Ratios.
By applying Solvency Ratios in various decision-making contexts and comparing them to relevant benchmarks, you can gain valuable insights into a company’s financial strength, assess risk, and make well-informed financial decisions that align with your objectives.
Solvency Ratios Limitations
As valuable as Solvency Ratios are in assessing a company’s financial health, it’s important to recognize their limitations. We’ll go through the factors that can impact the interpretation of Solvency Ratios and the potential pitfalls that may arise when relying solely on these ratios for financial analysis.
Factors That Can Impact Solvency Ratio Interpretation
Interpreting Solvency Ratios requires a nuanced understanding of various factors that can influence the results:
- Industry Variability: Different industries have varying levels of acceptable financial leverage. What may be considered a high Debt-to-Equity Ratio in one industry could be entirely normal in another. Therefore, it’s crucial to consider industry-specific benchmarks when interpreting these ratios.
- Economic Conditions: Economic cycles can significantly affect a company’s solvency ratios. During economic downturns, a company may experience reduced profitability and increased financial risk, leading to lower solvency ratios. Conversely, in periods of economic growth, these ratios may improve.
- Timing of Debt Issuance: The timing of debt issuance can distort solvency ratios. For instance, if a company recently issued debt to finance a major expansion project, its ratios may temporarily appear less favorable until the project generates returns.
- Quality of Assets: The composition of a company’s assets matters. If a significant portion of its assets is in illiquid or hard-to-value assets, it can impact the interpretation of solvency ratios. Liquidating such assets may not be straightforward in times of financial distress.
- Accounting Policies: Differences in accounting policies and practices can affect the values of assets and liabilities on a company’s balance sheet. This, in turn, can influence solvency ratios. It’s essential to compare ratios of companies using similar accounting principles.
Potential Pitfalls in Reliance on Solvency Ratios
While Solvency Ratios provide valuable insights, relying solely on them for financial analysis can lead to potential pitfalls:
- Overlooking Liquidity: Focusing exclusively on solvency can cause you to overlook liquidity concerns. A company may have strong solvency ratios but face short-term cash flow challenges, potentially leading to default on immediate obligations.
- Ignoring Operational Efficiency: Solvency Ratios do not reflect a company’s operational efficiency or its ability to generate profits. A company with high solvency ratios may still struggle to maintain profitability, affecting its long-term sustainability.
- Dynamic Nature of Ratios: Solvency Ratios can change over time due to various factors, including business decisions and market conditions. Failing to regularly update your analysis can result in outdated and inaccurate conclusions.
- Limited Context: Solvency Ratios provide a snapshot of a company’s financial position but lack the broader context. It’s essential to complement solvency analysis with a comprehensive review of a company’s overall financial statements and strategic objectives.
- External Influences: External events, such as changes in regulations or unexpected economic shocks, can impact a company’s solvency. These events may not be evident from the ratios alone.
In summary, while Solvency Ratios are valuable tools, it’s crucial to use them in conjunction with other financial metrics and consider the broader economic and industry context. Recognizing the limitations and potential pitfalls of solvency analysis ensures a more holistic and accurate assessment of a company’s financial health and risk profile.
How to Improve Solvency Ratios?
Now that you understand how Solvency Ratios work and their significance, you might be wondering how companies can actively work to enhance these ratios. Here are some strategies that you can employ to strengthen your Solvency Ratios, ultimately leading to greater financial stability.
Strategies to Enhance Solvency
Improving Solvency Ratios involves a combination of financial management strategies that reduce the company’s financial risk and enhance its long-term financial stability:
- Debt Refinancing: Companies can explore opportunities to refinance existing debt at more favorable terms, such as lower interest rates or extended repayment periods. This can reduce the financial burden and improve solvency.
- Equity Issuance: Raising additional equity through stock offerings or private placements can boost shareholders’ equity, thereby lowering the Debt-to-Equity Ratio and Debt Ratio.
- Profitability Improvement: Increasing profitability through cost control measures, revenue growth, and operational efficiency can enhance EBIT, which positively impacts the Interest Coverage Ratio and Debt Service Coverage Ratio.
- Asset Optimization: Identifying and divesting underperforming or non-core assets can generate cash that can be used to pay down debt, reducing the Debt Ratio.
- Capital Structure Adjustments: Companies can rebalance their capital structure by reducing debt levels relative to equity, which directly affects the Debt-to-Equity Ratio.
- Debt Reduction: Paying down debt ahead of schedule, whenever possible, can lower both the Debt-to-Equity Ratio and Debt Ratio.
- Risk Management: Implementing robust risk management practices, such as hedging against interest rate fluctuations or currency risks, can mitigate potential solvency threats.
- Strategic Planning: Companies should incorporate solvency objectives into their long-term strategic planning, ensuring that financing decisions align with maintaining or improving solvency ratios.
Reducing Debt and Managing Financial Risk
A fundamental aspect of improving Solvency Ratios is reducing debt and effectively managing financial risk. Here are some specific steps companies can take:
- Debt Consolidation: Combining multiple high-interest loans into a single, lower-interest loan can reduce interest expenses and improve the Interest Coverage Ratio.
- Debt Repayment Priority: Prioritizing the repayment of high-interest or short-term debt can lead to quicker improvements in Debt Ratios.
- Operating Lease Conversion: Converting operating leases to capital leases can change lease obligations to long-term debt, impacting the Debt-to-Equity Ratio.
- Cash Flow Management: Companies can implement rigorous cash flow management practices to ensure sufficient funds are available to service debt obligations.
- Diversification: Reducing dependency on a single source of revenue or a limited number of customers can enhance financial stability and reduce solvency risk.
- Contingency Planning: Developing contingency plans for adverse economic scenarios can help companies prepare for unexpected challenges.
- Communication: Open and transparent communication with creditors and investors during challenging times can lead to more favorable terms and support in maintaining solvency.
- Regular Monitoring: Continuously monitoring Solvency Ratios and other key financial indicators allows companies to proactively address potential solvency issues.
Enhancing Solvency Ratios requires a proactive and strategic approach to financial management. Companies should carefully assess their financial position, establish clear solvency goals, and implement appropriate measures to strengthen their long-term financial stability. By doing so, they can better weather economic downturns and position themselves for sustainable growth.
Examples of Solvency Ratios in Action
To grasp the practical relevance of Solvency Ratios, let’s explore real-world scenarios where these ratios come into play and their impact on decision-making:
Investment Decision-Making
Imagine you’re an investor looking to allocate your funds into different stocks. You come across Company A and Company B, both operating in the same industry. To assess their financial stability, you examine their Solvency Ratios.
- Company A: It has a Debt-to-Equity Ratio of 0.8, indicating a conservative capital structure with lower reliance on debt. This suggests that the company is financially stable and less exposed to financial risk.
- Company B: It has a Debt-to-Equity Ratio of 2.2, indicating a higher level of debt in its capital structure. While this might signal growth opportunities, it also implies greater financial risk.
In this scenario, Solvency Ratios provide you with valuable insights. You may opt to invest in Company A due to its stronger financial position, lower risk of default, and potentially more consistent returns.
Credit Assessment for Lending
As a bank evaluating a loan application from Company X, you need to determine the borrower’s creditworthiness. Solvency Ratios play a pivotal role in this assessment.
- Company X: It has a Debt Service Coverage Ratio of 1.2, indicating that its operating income can cover 120% of its total debt service obligations. This suggests that the company has a reasonable capacity to service its debt.
- Company Y: It has a Debt Service Coverage Ratio of 0.8, implying that its operating income can only cover 80% of its total debt service obligations. This raises concerns about its ability to meet debt payments consistently.
In this lending scenario, Solvency Ratios help you make an informed decision. You may be more inclined to approve the loan for Company X, as it demonstrates a better ability to meet its financial commitments.
Strategic Planning for Growth
A growing manufacturing company, Company Z, is considering expanding its operations by acquiring a competitor. To determine the feasibility of this acquisition and assess potential risks, the company’s management team looks at its Solvency Ratios.
- Company Z (Before Acquisition): It has a Debt Ratio of 0.5, indicating that half of its assets are financed by debt. The company’s Debt Service Coverage Ratio is 1.5, suggesting it can comfortably service its debt.
- Company Z (After Acquisition): Upon acquiring the competitor, Company Z’s Debt Ratio increases to 0.7, reflecting the additional debt taken on. However, its Debt Service Coverage Ratio remains at 1.3, showing that it can still meet its obligations.
In this strategic planning scenario, Solvency Ratios guide Company Z’s decision-making process. While the acquisition increases leverage, the company’s strong Debt Service Coverage Ratio assures management that it can manage the added debt without compromising financial stability.
These examples illustrate how Solvency Ratios serve as practical tools in various financial scenarios, influencing investment choices, lending decisions, and strategic planning. They provide stakeholders with a clear understanding of a company’s financial strength and risk profile, enabling well-informed and prudent financial choices.
Conclusion
Solvency Ratios are powerful tools that offer a clear window into a company’s financial well-being. By evaluating these ratios, you can assess risk, make informed investment decisions, and guide your business toward long-term stability. Remember, financial analysis is not about complex equations; it’s about making smart, well-informed choices that lead to financial success.
So, whether you’re an investor looking for promising opportunities or a business leader charting a course for growth, harness the power of Solvency Ratios to ensure you’re on the path to financial prosperity. Keep analyzing, keep learning, and keep making those wise financial decisions.
Get Started With a Prebuilt Template!
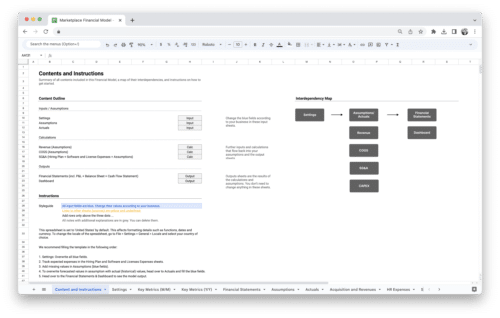
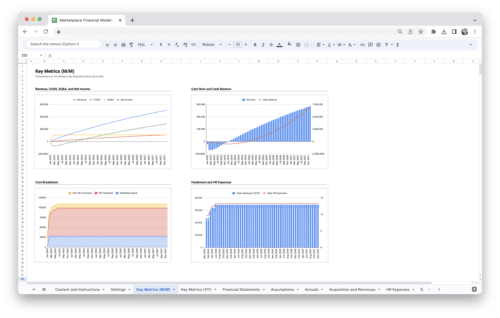
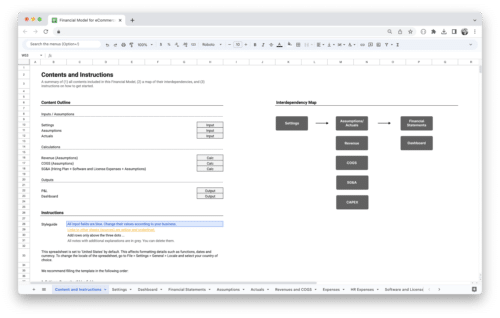
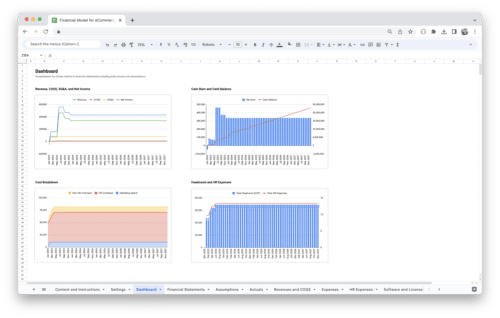
Looking to streamline your business financial modeling process with a prebuilt customizable template? Say goodbye to the hassle of building a financial model from scratch and get started right away with one of our premium templates.
- Save time with no need to create a financial model from scratch.
- Reduce errors with prebuilt formulas and calculations.
- Customize to your needs by adding/deleting sections and adjusting formulas.
- Automatically calculate key metrics for valuable insights.
- Make informed decisions about your strategy and goals with a clear picture of your business performance and financial health.


