Ever wondered how efficiently a company is utilizing its assets to generate profits? Enter Return on Assets (ROA) – a powerful financial metric that offers valuable insights into a company’s profitability and operational efficiency. In this guide, we’ll dive deep into the world of ROA, exploring its definition, calculation, significance, limitations, and practical applications. Whether you’re an investor, analyst, or business owner, understanding ROA is essential for making informed financial decisions and driving sustainable growth.
What is ROA?
Return on Assets (ROA) is a financial metric used to measure a company’s ability to generate profits from its assets. It provides insight into how efficiently a company utilizes its assets to generate earnings and is calculated by dividing net income by total assets.
ROA = (Net Income / Total Assets) x 100
Purpose of ROA Analysis
ROA analysis serves several important purposes in financial assessment and decision-making:
- Profitability Evaluation: ROA helps evaluate a company’s profitability by assessing its ability to generate income from its asset base. A higher ROA indicates greater profitability, as the company generates more income per dollar of assets employed.
- Asset Efficiency Assessment: ROA measures the efficiency of asset utilization within a company. It indicates how effectively a company is using its resources to generate profits. A higher ROA suggests better asset management and utilization.
- Comparative Analysis: ROA enables comparisons between companies within the same industry or sector. By comparing ROA ratios, investors and analysts can assess relative performance and identify industry leaders or underperforming companies.
- Investment Decision-making: ROA plays a crucial role in investment decision-making. Investors use ROA as one of the indicators to assess the attractiveness of potential investments. Companies with higher ROA ratios are often perceived as more attractive investment opportunities.
- Financial Health Indicator: ROA provides insights into a company’s overall financial health and stability. A declining or negative ROA may indicate underlying financial challenges or operational inefficiencies, while a consistently high ROA suggests a well-managed and profitable business.
- Management Performance Evaluation: ROA is used to evaluate management performance and effectiveness. Executives and board members often use ROA as a benchmark for assessing management’s ability to generate returns for shareholders and allocate resources efficiently.
By analyzing ROA and understanding its implications, stakeholders can gain valuable insights into a company’s profitability, asset efficiency, and overall financial performance. ROA serves as a critical tool for making informed decisions and driving business success.
How to Calculate ROA?
Return on Assets (ROA) is a fundamental financial metric used by investors, analysts, and business owners to assess a company’s profitability in relation to its asset base. Understanding how ROA is calculated is essential for interpreting financial performance and making informed decisions. Let’s delve into the components of ROA calculation and explore some examples to illustrate its application.
Formula for ROA Calculation
The formula for calculating Return on Assets (ROA) is straightforward:
ROA = (Net Income / Total Assets) x 100
Where:
- Net Income refers to the total profits earned by the company after deducting all expenses, taxes, and interest payments.
- Total Assets represent the sum of all assets owned and utilized by the company, including both tangible and intangible assets.
ROA is typically expressed as a percentage, representing the ratio of net income generated per dollar of assets employed.
Components of ROA Calculation
To better understand ROA, let’s break down its components:
Net Income
Net income, also known as the bottom line or profit, is the amount of money a company earns after subtracting all expenses from its total revenue. This includes operating expenses, interest payments, taxes, and other costs associated with running the business. Net income is a key indicator of a company’s profitability and financial performance.
Total Assets
Total assets encompass all the resources owned or controlled by a company that have economic value and can be used to generate future income. These include tangible assets such as cash, inventory, property, plant, and equipment, as well as intangible assets like patents, trademarks, and goodwill. Total assets provide insight into the scale and scope of a company’s operations and its ability to generate returns for shareholders.
Examples
Let’s consider a couple of examples to illustrate how ROA is calculated:
Example 1: Company XYZ
Company XYZ reported a net income of $500,000 for the fiscal year ended December 31, 20XX. The company’s total assets amounted to $5,000,000 during the same period. Using the ROA formula:
ROA = ($500,000 / $5,000,000) x 100 = 10%
This indicates that for every dollar of assets employed, Company XYZ generated a return of 10 cents in net income.
Example 2: Company ABC
Company ABC, a retail chain, reported a net income of $1,200,000 for the fiscal year. The company’s total assets were $15,000,000. Calculating ROA:
ROA = ($1,200,000 / $15,000,000) x 100 = 8%
In this case, Company ABC achieved an ROA of 8%, indicating that it generated $0.08 in net income for every dollar of assets utilized.
Understanding these examples demonstrates how ROA can vary based on a company’s profitability and asset utilization. ROA serves as a valuable tool for assessing financial performance and comparing the efficiency of different businesses within an industry.
Importance of ROA in Financial Analysis
Return on Assets (ROA) is a key financial metric that holds significant importance in financial analysis. Whether you’re an investor evaluating potential investments, a creditor assessing a company’s creditworthiness, or a manager seeking to optimize business performance, ROA provides valuable insights into a company’s profitability and efficiency in asset utilization.
Here are several reasons why ROA is essential in financial analysis:
- Performance Measurement: ROA serves as a measure of a company’s ability to generate profits relative to its asset base. It provides a clear indication of how effectively a company is utilizing its resources to generate returns for shareholders.
- Comparative Analysis: ROA facilitates comparisons between companies operating in the same industry or sector. By comparing the ROA of different companies, investors and analysts can identify industry leaders, assess relative performance, and make informed investment decisions.
- Profitability Assessment: ROA helps assess a company’s profitability by examining the relationship between net income and total assets. A higher ROA indicates better profitability, while a lower ROA may signal operational inefficiencies or underperformance.
- Asset Management: ROA highlights the efficiency of asset utilization within a company. By analyzing ROA trends over time, managers can identify opportunities to optimize asset allocation, improve operational efficiency, and enhance overall performance.
- Investment Decision-making: For investors, ROA is a crucial factor in evaluating the attractiveness of potential investments. Companies with higher ROA ratios are generally perceived as more attractive investment opportunities, as they demonstrate stronger profitability and asset efficiency.
- Risk Assessment: ROA can also be used as a risk assessment tool. A declining ROA may indicate deteriorating financial health, increased risk of insolvency, or poor management decisions. Monitoring changes in ROA over time can help identify emerging risks and vulnerabilities.
- Financial Health Indicator: ROA provides valuable insights into a company’s overall financial health and stability. A consistently high ROA indicates a well-managed and profitable business, while a declining or negative ROA may signal underlying financial challenges or operational issues.
- Management Performance Evaluation: ROA is often used as a performance measure for evaluating management effectiveness. Executives and board members may use ROA as a benchmark for assessing management’s ability to generate returns for shareholders and allocate resources efficiently.
In summary, ROA plays a crucial role in financial analysis by providing valuable insights into a company’s profitability, asset efficiency, and overall financial health. By understanding the importance of ROA and its implications, investors, analysts, and managers can make informed decisions to drive business success and maximize shareholder value.
How to Interpret ROA Results?
Understanding how to interpret Return on Assets (ROA) results is essential for gaining insights into a company’s financial performance and efficiency. Let’s explore the significance of both high and low ROA, as well as the various factors that can influence ROA outcomes.
High ROA vs. Low ROA
High ROA
A high ROA typically indicates that a company is effectively utilizing its assets to generate profits. Companies with high ROA ratios are often considered more efficient and profitable, as they generate more income per dollar of assets employed. High ROA can be attributed to several factors, including:
- Operational Efficiency: Companies with high ROA ratios typically have streamlined operations, efficient resource allocation, and effective cost management practices.
- Strong Profit Margins: High ROA may result from healthy profit margins, indicating that the company generates significant profits relative to its revenue and asset base.
- Effective Asset Utilization: High ROA reflects optimal asset utilization, with the company generating substantial returns from its investments in both tangible and intangible assets.
Low ROA
Conversely, a low ROA suggests that a company is struggling to generate profits relative to its asset base. Low ROA ratios may indicate operational challenges, inefficiencies, or underperformance. Several factors can contribute to a low ROA, including:
- Poor Operational Performance: Companies with low ROA ratios may face issues such as declining sales, high operating expenses, or inefficient production processes.
- Weak Profitability: Low profit margins and declining net income can contribute to a low ROA, indicating that the company is struggling to generate profits from its assets.
- Underutilized Assets: Low ROA may result from underutilized assets or poor asset management practices, where the company fails to generate sufficient returns from its investments.
Factors Influencing ROA
Several factors can influence a company’s ROA, impacting its profitability and efficiency in asset utilization. These factors include:
- Industry Dynamics: Different industries have varying capital requirements, profit margins, and asset turnover ratios, leading to differences in ROA benchmarks. It’s essential to consider industry-specific factors when interpreting ROA results.
- Economic Conditions: Economic factors such as market demand, interest rates, inflation, and exchange rates can impact a company’s profitability and asset performance. Economic downturns or recessionary periods may negatively affect ROA due to lower sales and profitability.
- Management Decisions: Management practices, strategic decisions, and corporate governance can significantly influence ROA outcomes. Effective management teams can enhance ROA by implementing efficient operational processes, strategic investments, and cost-saving initiatives.
- Capital Structure: The company’s capital structure, including its debt-to-equity ratio and financing decisions, can impact ROA. Companies with high debt levels may have lower ROA ratios due to higher interest expenses, affecting profitability and asset utilization.
- Competitive Landscape: Market competition and industry rivalry can influence a company’s ROA performance. Companies operating in highly competitive industries may face pressure to maintain profitability and efficiency, impacting their ROA ratios.
- Business Lifecycle: The stage of the business lifecycle, whether it’s in the growth phase, maturity, or decline, can affect ROA. Growing companies may have lower ROA initially due to high investment in assets, while mature companies may strive to maintain or improve ROA through efficiency measures.
Understanding these factors and their impact on ROA results is critical for conducting meaningful financial analysis and making informed business decisions. By analyzing ROA in conjunction with other financial metrics and qualitative factors, stakeholders can gain a comprehensive understanding of a company’s performance and prospects.
ROA Analysis Tools and Resources
Analyzing Return on Assets (ROA) requires access to relevant data and the right tools to perform calculations and interpret results effectively. Let’s explore various tools and resources available for conducting ROA analysis.
Financial Analysis Software
Financial analysis software provides powerful tools and functionalities for analyzing ROA and other financial metrics. Here are some popular financial analysis software solutions widely used by professionals:
- Excel: Microsoft Excel is a versatile tool used for financial modeling, data analysis, and creating customized ROA calculation templates. Excel offers built-in functions and features for performing complex calculations, generating charts and graphs, and conducting sensitivity analysis.
- QuickBooks: QuickBooks is a widely used accounting software that provides features for tracking financial transactions, generating financial statements, and calculating key financial ratios such as ROA. QuickBooks simplifies the process of financial analysis for small and medium-sized businesses by providing user-friendly interfaces and pre-built reports.
- Bloomberg Terminal: Bloomberg Terminal is a comprehensive financial platform used by investment professionals for real-time market data, news, and analytics. Bloomberg Terminal offers sophisticated financial analysis tools and customizable templates for analyzing ROA and other performance metrics across various industries and asset classes.
- SAP ERP: SAP ERP (Enterprise Resource Planning) software provides integrated modules for financial accounting, asset management, and business intelligence. SAP ERP enables companies to analyze ROA in the context of their overall business operations, supply chain, and customer relationships.
Online Resources and Databases
Online resources and databases offer access to a wealth of financial data, industry benchmarks, and research reports for conducting ROA analysis. Here are some valuable online resources and databases:
- Yahoo Finance: Yahoo Finance provides free access to stock market data, financial news, and company profiles. Users can access historical financial statements, analyst estimates, and key financial ratios, including ROA, for publicly traded companies.
- Google Finance: Google Finance offers similar features to Yahoo Finance, providing users with access to real-time stock quotes, financial news, and interactive charts. Users can track ROA trends and compare financial performance across companies and industries.
- SEC EDGAR: The U.S. Securities and Exchange Commission’s Electronic Data Gathering, Analysis, and Retrieval (EDGAR) database provides access to company filings, including annual reports (Form 10-K) and quarterly reports (Form 10-Q). Analysts can use SEC EDGAR to retrieve financial statements and perform in-depth analysis of ROA for publicly traded companies.
ROA Calculation Templates
ROA calculation templates provide pre-built spreadsheet models and formulas for calculating ROA and related financial ratios. These templates can be customized to suit specific business needs and industry requirements.
- Spreadsheet Templates: Various Excel and Google Sheets templates are available for calculating ROA, net income, total assets, and other financial metrics. Users can input their financial data into these templates to generate ROA ratios and visualize trends over time.
- Financial Modeling Software: Dedicated financial modeling software such as Palantir Finance and Finbox provide specialized templates and tools for financial analysis, including ROA modeling. These platforms offer advanced features for scenario analysis, sensitivity testing, and forecasting ROA based on different assumptions.
By leveraging these tools and resources, analysts, investors, and business professionals can conduct comprehensive ROA analysis, gain insights into financial performance, and make informed decisions to drive business success.
How to Improve ROA?
Improving Return on Assets (ROA) is a key objective for businesses seeking to enhance profitability and operational efficiency. By implementing strategic initiatives focused on revenue generation, cost reduction, and asset utilization, companies can optimize their ROA ratios and drive sustainable growth. Let’s explore these strategies in detail.
Market Expansion
Expanding market reach is a fundamental strategy for increasing revenue generation. Companies can target new customer segments, geographical markets, or distribution channels to drive sales growth. Market expansion initiatives may include:
- Product Diversification: Introducing new products or services to cater to evolving customer needs and preferences.
- Geographical Expansion: Expanding into new regions or countries with untapped market potential.
- Channel Optimization: Leveraging online platforms, e-commerce channels, and social media to reach a broader audience.
Customer Acquisition and Retention
Effective marketing and sales strategies are essential for acquiring new customers and retaining existing ones. Companies can invest in targeted marketing campaigns, customer relationship management (CRM) systems, and loyalty programs to enhance customer acquisition and retention rates. Key initiatives may include:
- Customer Segmentation: Identifying and targeting high-value customer segments based on demographics, behavior, and purchasing patterns.
- Personalized Marketing: Implementing personalized marketing tactics such as email campaigns, retargeting ads, and customized promotions to engage customers and drive sales.
- Customer Service Excellence: Providing exceptional customer service and support to build long-term relationships and foster brand loyalty.
Operational Efficiency
Streamlining business operations and optimizing resource allocation are critical for reducing costs and improving profitability. Companies can implement efficiency measures across various functions, including:
- Process Optimization: Identifying and eliminating inefficiencies in workflows, supply chain management, and production processes.
- Automation and Technology Integration: Leveraging technology solutions such as automation, robotics, and data analytics to streamline operations and reduce manual tasks.
- Lean Management Practices: Adopting lean management principles to minimize waste, reduce lead times, and optimize resource utilization.
Cost Control Measures
Implementing cost control measures helps mitigate expenses and preserve profit margins. Companies can explore opportunities to negotiate favorable terms with suppliers, optimize inventory management, and reduce overhead costs. Key initiatives may include:
- Supplier Negotiation: Negotiating volume discounts, extended payment terms, and favorable pricing agreements with suppliers to lower procurement costs.
- Inventory Optimization: Implementing just-in-time (JIT) inventory management practices to minimize inventory holding costs and reduce excess inventory levels.
- Expense Reduction Programs: Implementing cost-cutting initiatives such as travel restrictions, utility conservation measures, and discretionary spending controls.
Asset Management
Effective asset management is essential for maximizing the return on invested capital. Companies can optimize asset utilization by monitoring asset performance, maintenance schedules, and depreciation methods. Asset management strategies may include:
- Asset Tracking and Maintenance: Implementing asset tracking systems and preventive maintenance programs to ensure optimal asset performance and longevity.
- Lifecycle Management: Managing assets throughout their lifecycle, from acquisition to disposal, to maximize value and minimize costs.
- Asset Replacement Planning: Developing asset replacement plans based on usage patterns, technological advancements, and maintenance requirements to avoid downtime and costly repairs.
Asset Turnover Improvement
Increasing asset turnover ratios helps generate more revenue from existing assets and improve overall ROA. Companies can implement strategies to enhance asset turnover rates, such as:
- Inventory Management: Implementing inventory turnover optimization strategies to minimize holding costs and reduce stockouts.
- Asset Utilization Analysis: Conducting regular assessments of asset utilization rates, identifying underutilized assets, and reallocating resources to higher-yielding opportunities.
- Capacity Optimization: Maximizing production capacity and throughput to increase asset turnover and revenue generation without significant capital investment.
By focusing on these strategies to improve revenue generation, reduce costs and expenses, and enhance asset utilization, companies can enhance their ROA ratios and drive sustainable business growth and profitability. Each strategy should be aligned with the company’s goals, market dynamics, and competitive landscape to maximize effectiveness and long-term value creation.
Examples of ROA Analysis
Understanding how Return on Assets (ROA) analysis is applied in real-world scenarios can provide valuable insights into its practical significance. Let’s explore some examples of ROA analysis in different contexts:
Example 1: Retail Company Comparison
Consider two retail companies operating in the same industry: Company A and Company B. Both companies have similar revenue figures, but their ROA ratios differ significantly.
- Company A: Company A has a higher ROA of 12%, indicating that it generates $0.12 in net income for every dollar of assets employed. This suggests that Company A is more efficient in utilizing its assets to generate profits, potentially due to effective inventory management and operational efficiency.
- Company B: Company B, on the other hand, has a lower ROA of 6%. Despite similar revenue figures to Company A, Company B’s lower ROA suggests that it may have higher expenses or less effective asset utilization. This could be attributed to factors such as inefficient inventory turnover or higher operating costs.
By comparing the ROA ratios of Company A and Company B, investors and analysts can assess the relative performance and efficiency of the two companies within the retail industry. This analysis can help identify opportunities for improvement and inform investment decisions.
Example 2: Industry Benchmarking
Imagine an investor looking to invest in the technology sector and comparing the ROA ratios of several leading tech companies.
- Company X: Company X has an ROA of 15%, indicating strong profitability and efficient asset utilization. This high ROA may be attributed to factors such as innovative product offerings, high-margin services, and effective cost management practices.
- Company Y: Company Y, another tech company, has a lower ROA of 8%. Despite being in the same industry, Company Y’s lower ROA suggests that it may face challenges in generating profits from its asset base. This could be due to factors such as increased competition, lower profit margins, or higher operating expenses.
By benchmarking the ROA ratios of various tech companies against industry peers, the investor can gain insights into the relative performance and competitiveness of different companies within the sector. This analysis can inform investment decisions and help identify potential opportunities or risks.
Example 3: Trend Analysis
Consider a manufacturing company analyzing its ROA trends over multiple years to assess operational performance and identify areas for improvement.
- Year 1: The company’s ROA was 10%, indicating healthy profitability and asset utilization.
- Year 2: The ROA declined to 8% due to increased operating expenses and lower profit margins.
- Year 3: The ROA further decreased to 6%, signaling operational challenges and potential inefficiencies in asset utilization.
By conducting trend analysis of ROA over time, the company can pinpoint periods of improvement or decline in profitability and efficiency. This analysis can help management identify underlying factors contributing to changes in ROA and implement corrective actions to improve performance.
These examples illustrate the practical application of ROA analysis in evaluating company performance, benchmarking against industry peers, and identifying trends over time. By leveraging ROA analysis, stakeholders can make informed decisions to drive business growth and success.
Limitations of ROA Analysis
While Return on Assets (ROA) is a valuable financial metric for assessing a company’s profitability and efficiency, it has certain limitations that should be considered when interpreting results. Understanding these limitations is essential for conducting meaningful financial analysis and making informed business decisions.
- Ignoring Capital Structure: ROA does not account for the company’s capital structure, including its debt levels and financing decisions. Companies with high debt-to-equity ratios may have lower ROA ratios due to higher interest expenses, even if they are effectively utilizing their assets.
- Industry Variances: ROA benchmarks vary significantly across industries due to differences in capital intensity, business models, and operating dynamics. Comparing ROA across industries may not provide meaningful insights without considering industry-specific factors and norms.
- Short-term Focus: ROA reflects a company’s performance over a specific period, typically a fiscal year, and may not capture long-term trends or strategic investments. Companies may sacrifice short-term ROA for long-term growth initiatives, such as research and development or market expansion.
- Quality of Assets: ROA does not differentiate between different types of assets or assess their quality. Companies may have high ROA ratios due to inflated asset values or overvalued intangible assets, which may not be sustainable over the long term.
- Dependence on Accounting Methods: ROA calculations rely on financial statements prepared using generally accepted accounting principles (GAAP). Variations in accounting methods, such as depreciation methods or inventory valuation techniques, can impact ROA results and comparability across companies.
- External Factors: ROA can be influenced by external factors beyond the company’s control, such as changes in economic conditions, industry trends, or regulatory requirements. Economic downturns or market disruptions may negatively impact ROA performance, even for well-managed companies.
- Size and Scale Effects: ROA may be influenced by the size and scale of the company, with larger companies typically having lower ROA ratios due to higher asset bases. Comparing ROA across companies of different sizes may not be meaningful without adjusting for scale effects.
- Non-operating Items: ROA includes non-operating items such as interest income, gains or losses from asset sales, and one-time charges, which can distort the ratio’s interpretation. Analysts should carefully evaluate the components of ROA to assess the underlying operational performance.
By recognizing these limitations and considering them in the context of financial analysis, investors, analysts, and managers can make more informed decisions and avoid misinterpretation of ROA results. It’s important to supplement ROA analysis with other financial metrics, qualitative factors, and industry benchmarks to gain a comprehensive understanding of a company’s performance and prospects.
Conclusion
Return on Assets (ROA) is a fundamental metric that provides a clear picture of a company’s profitability and efficiency in utilizing its assets. By understanding ROA and its implications, stakeholders can make informed decisions regarding investment opportunities, strategic planning, and performance evaluation. ROA serves as a valuable tool for assessing financial health, benchmarking against industry peers, and identifying areas for improvement. Remember, while ROA offers valuable insights, it’s essential to consider its limitations and supplement analysis with other financial metrics and qualitative factors for a comprehensive understanding of a company’s performance. By incorporating ROA analysis into your financial toolkit, you can navigate the complexities of the business world with confidence and clarity.
In today’s dynamic business environment, where competition is fierce and margins matter, ROA serves as a guiding light for companies striving to achieve sustainable growth and profitability. Whether you’re a seasoned investor, diligent analyst, or forward-thinking manager, ROA empowers you to unlock hidden opportunities, mitigate risks, and drive strategic decision-making. As you embark on your journey of financial analysis and business optimization, remember that ROA is not just a number; it’s a reflection of a company’s ability to create value for its stakeholders and thrive in an ever-changing landscape.
Get Started With a Prebuilt Template!
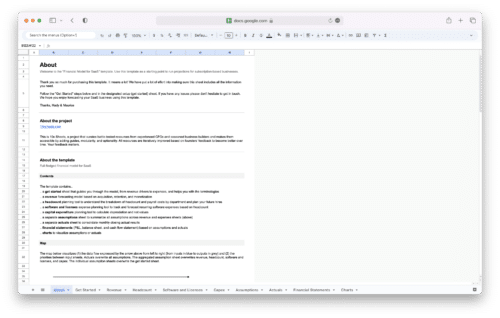
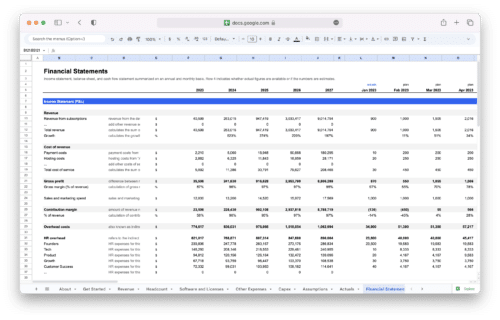
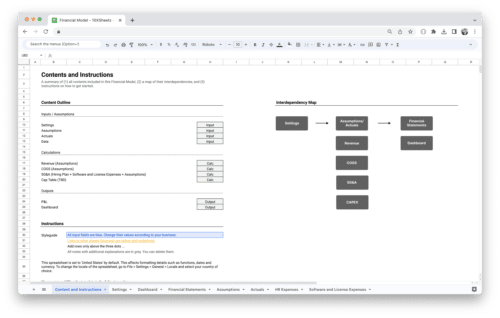
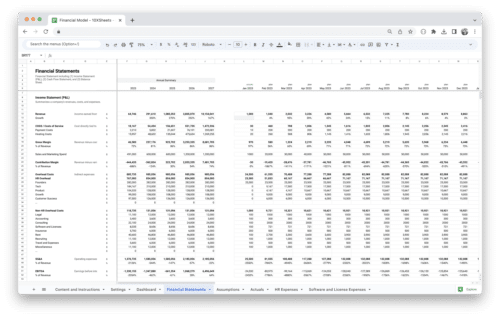
Looking to streamline your business financial modeling process with a prebuilt customizable template? Say goodbye to the hassle of building a financial model from scratch and get started right away with one of our premium templates.
- Save time with no need to create a financial model from scratch.
- Reduce errors with prebuilt formulas and calculations.
- Customize to your needs by adding/deleting sections and adjusting formulas.
- Automatically calculate key metrics for valuable insights.
- Make informed decisions about your strategy and goals with a clear picture of your business performance and financial health.

