- What is Quantitative Analysis?
- Fundamentals of Quantitative Analysis
- Statistical Analysis Techniques
- Quantitative Analysis Examples
- Time Series Analysis
- Quantitative Analysis Tools and Software
- Quantitative Analysis Applications
- Quantitative Analysis Challenges and Limitations
- Quantitative Analysis Best Practices
- Conclusion
Ever wondered how businesses make decisions, predict trends, or assess risks? Quantitative analysis holds the key. In today’s data-driven world, numbers tell stories, and understanding these stories is crucial for success. From finance to healthcare, marketing to environmental science, quantitative analysis is the compass guiding decision-makers through the vast sea of data. But what exactly is quantitative analysis?
It’s a systematic approach to crunching numbers, uncovering patterns, and extracting insights from data. Think of it as a toolkit filled with statistical methods, mathematical models, and computational techniques, all aimed at answering questions, solving problems, and driving innovation. Whether you’re analyzing stock market trends, studying consumer behavior, or optimizing supply chain operations, quantitative analysis provides the roadmap, helping you navigate through the complexities of data to reach informed decisions and achieve desired outcomes.
What is Quantitative Analysis?
Quantitative analysis refers to the systematic approach of understanding phenomena through the use of statistical, mathematical, or computational techniques. Its primary purpose is to uncover patterns, relationships, and trends within data to inform decision-making, problem-solving, and hypothesis testing.
Quantitative analysis involves the collection, processing, and interpretation of numerical data to derive meaningful insights and predictions. It encompasses a wide range of methods and tools, including statistical analysis, mathematical modeling, and computational simulations. The ultimate goal of quantitative analysis is to provide evidence-based answers to research questions, support informed decision-making, and drive innovation across various domains.
Importance of Quantitative Analysis in Various Fields
Quantitative analysis plays a critical role in numerous fields and industries, where data-driven insights are essential for decision-making and problem-solving. Some of the key areas where quantitative analysis is of paramount importance include:
- Finance and Economics: Quantitative analysis is crucial for financial modeling, risk assessment, investment analysis, and economic forecasting. It enables stakeholders to make informed decisions regarding asset allocation, portfolio management, and market trends.
- Marketing and Market Research: In marketing, quantitative analysis is used to understand consumer behavior, assess market trends, and measure the effectiveness of marketing campaigns. It helps businesses identify target audiences, optimize pricing strategies, and evaluate market opportunities.
- Healthcare and Biomedical Research: Quantitative analysis is integral to healthcare analytics, clinical research, and public health initiatives. It facilitates the analysis of patient data, medical imaging, and genomic information to improve diagnosis, treatment, and disease prevention.
- Operations Management and Supply Chain: In operations management, quantitative analysis aids in optimizing production processes, inventory management, and supply chain logistics. It enables businesses to minimize costs, improve efficiency, and meet customer demand effectively.
- Environmental Science and Sustainability: Quantitative analysis is essential for assessing environmental data, modeling climate change, and designing sustainable solutions. It helps researchers understand the impacts of human activities on the environment and develop strategies for conservation and resource management.
Overview of Quantitative Analysis Methods
Quantitative analysis methods encompass a wide array of techniques for data collection, analysis, and interpretation. Some of the commonly used methods include:
- Descriptive Statistics: Descriptive statistics summarize and describe the basic features of a dataset, including measures of central tendency, variability, and distribution.
- Inferential Statistics: Inferential statistics are used to make inferences and predictions about a population based on sample data. Hypothesis testing, regression analysis, and confidence intervals are common inferential techniques.
- Time Series Analysis: Time series analysis involves studying the behavior of a variable over time to identify patterns, trends, and seasonal variations. Moving averages, exponential smoothing, and ARIMA models are commonly used in time series analysis.
- Regression Analysis: Regression analysis examines the relationship between one or more independent variables and a dependent variable. It is used to predict outcomes and identify causal relationships between variables.
- Machine Learning: Machine learning algorithms enable computers to learn from data and make predictions or decisions without being explicitly programmed. Supervised learning, unsupervised learning, and reinforcement learning are common machine learning techniques used in quantitative analysis.
- Simulation and Optimization: Simulation and optimization techniques are used to model complex systems, evaluate alternative scenarios, and identify optimal solutions. Monte Carlo simulation, linear programming, and genetic algorithms are examples of simulation and optimization methods.
Quantitative analysis methods are selected based on the nature of the data, research objectives, and analytical requirements. By employing appropriate techniques and tools, analysts and researchers can derive meaningful insights, make informed decisions, and drive innovation across diverse fields and industries.
Fundamentals of Quantitative Analysis
We’ll delve into the foundational aspects of quantitative analysis, covering essential concepts, data types, sources, collection techniques, and preprocessing steps.
Quantitative Analysis Concepts and Terminology
Quantitative analysis hinges on several fundamental concepts and terminologies that form the basis of understanding and interpreting numerical data.
- Variables: Variables are characteristics or attributes that can be measured or observed, such as age, height, or income.
- Data Types: Data can be classified into two primary types: categorical (qualitative) and numerical (quantitative). Categorical data represents characteristics or qualities, while numerical data consists of measurable quantities.
- Population vs. Sample: In statistical terms, a population refers to the entire group under study, while a sample is a subset of that population used for analysis.
- Measures of Central Tendency: Measures like mean, median, and mode provide insights into the central or typical value of a dataset.
- Measures of Dispersion: Metrics such as standard deviation, variance, and range quantify the spread or variability of data points around the central tendency.
Data Types and Sources
Understanding the types and sources of data is crucial for effective quantitative analysis.
- Primary Data: Primary data is collected firsthand through observations, surveys, experiments, or direct measurements. It offers researchers control over the data collection process and can be tailored to specific research objectives.
- Secondary Data: Secondary data refers to existing data collected by others for purposes other than the current research. It includes sources like databases, government records, academic journals, and historical datasets. Secondary data can be a valuable resource for research, offering cost and time efficiencies.
- Structured vs. Unstructured Data: Structured data is organized and formatted according to a predefined schema, making it easy to store, query, and analyze. Examples include relational databases and spreadsheets. In contrast, unstructured data lacks a predefined structure and includes text documents, multimedia files, and social media posts. Analyzing unstructured data often requires advanced techniques like natural language processing (NLP) and machine learning.
Data Collection Techniques
Quantitative data can be collected using various techniques, each suited to different research objectives and contexts.
- Surveys: Surveys involve administering questionnaires or interviews to gather data from respondents. Surveys can be conducted in person, via phone, mail, or online platforms. They allow researchers to collect large amounts of data efficiently and can be structured, semi-structured, or unstructured depending on the level of standardization.
- Experiments: Experimental studies involve manipulating one or more variables to observe the effect on another variable. Experiments are characterized by control over variables, random assignment of participants, and replication of conditions. They are commonly used in scientific research to establish cause-and-effect relationships.
- Observational Studies: Observational studies involve observing and recording behaviors, events, or phenomena in their natural settings without intervention or manipulation by the researcher. Observational studies can be descriptive, correlational, or experimental in nature. They are often used in fields like anthropology, sociology, and psychology to study human behavior in real-world contexts.
Data Preprocessing and Cleaning
Data preprocessing and cleaning are essential steps in preparing data for analysis, ensuring its quality, reliability, and suitability for analysis.
- Data Cleaning: Data cleaning involves identifying and correcting errors, inconsistencies, and inaccuracies in the dataset. This may include removing duplicate entries, correcting spelling mistakes, and resolving missing or invalid values. Data cleaning ensures that the dataset is accurate and reliable for analysis.
- Data Transformation: Data transformation involves converting raw data into a suitable format for analysis. This may include normalization, standardization, or logarithmic transformation to improve the distribution and interpretability of data. Data transformation can also involve creating new variables or aggregating existing ones to better represent the underlying phenomenon.
- Missing Data Handling: Missing data are a common issue in datasets and can arise due to various reasons such as non-response, data entry errors, or data corruption. Handling missing data involves strategies such as imputation, where missing values are replaced with estimated values based on available data, or deletion, where observations with missing values are removed from the analysis. The choice of missing data handling technique depends on the nature of the data and the analytical objectives.
Statistical Analysis Techniques
Statistical analysis techniques form the core of quantitative analysis, enabling you to derive insights, make predictions, and draw conclusions from data. We’ll explore various statistical methods, including descriptive statistics and inferential statistics, along with their applications in real-world scenarios.
Descriptive Statistics
Descriptive statistics involve summarizing and describing the characteristics of a dataset. They provide valuable insights into the central tendency and variability of data, aiding in understanding its distribution and overall structure.
Measures of Central Tendency
Measures of central tendency help identify the central or typical value of a dataset, providing a single representative value around which the data points cluster.
- Mean: The mean, or average, is calculated by summing all the values in the dataset and dividing by the total number of observations. It provides a measure of the central location of the data.
- Median: The median is the middle value in a sorted dataset. It is less sensitive to outliers than the mean and provides a robust measure of central tendency.
- Mode: The mode represents the value that appears most frequently in the dataset. It is useful for identifying the most common value or category in a dataset.
Measures of Dispersion
Measures of dispersion quantify the spread or variability of data points around the central tendency, providing insights into the distribution and consistency of the data.
- Standard Deviation: The standard deviation measures the average deviation of data points from the mean. It indicates the degree of variability or dispersion within the dataset.
- Variance: The variance is the square of the standard deviation and represents the average squared deviation from the mean. It provides a measure of the spread of data points around the mean.
- Range: The range is the difference between the maximum and minimum values in the dataset. It provides a simple measure of the spread of data but is sensitive to outliers.
Inferential Statistics
Inferential statistics involve making inferences and predictions about a population based on sample data. These techniques allow you to draw conclusions, test hypotheses, and estimate parameters with a certain level of confidence.
Probability Distributions
Probability distributions describe the likelihood of different outcomes in a random experiment. Common probability distributions include:
- Normal Distribution: The normal distribution, also known as the Gaussian distribution, is characterized by a symmetric bell-shaped curve. Many natural phenomena follow a normal distribution, making it widely used in statistical analysis.
- Binomial Distribution: The binomial distribution describes the number of successes in a fixed number of independent Bernoulli trials. It is used to model binary outcomes, such as success or failure.
- Poisson Distribution: The Poisson distribution models the number of events occurring in a fixed interval of time or space. It is commonly used to model rare events or count data.
Hypothesis Testing
Hypothesis testing is a statistical method used to evaluate the validity of a hypothesis about a population parameter. It involves formulating null and alternative hypotheses and using sample data to assess the likelihood of the null hypothesis being true.
- Null Hypothesis (H0): The null hypothesis represents the status quo or default assumption, often stating that there is no significant difference or effect.
- Alternative Hypothesis (H1 or Ha): The alternative hypothesis contradicts the null hypothesis, proposing that there is a significant difference or effect present in the population.
Confidence Intervals
Confidence intervals provide a range of values within which a population parameter is likely to fall, based on sample data and a specified level of confidence. Commonly used confidence levels include 95% and 99%.
- Confidence Level: The confidence level represents the probability that the confidence interval will contain the true population parameter. For example, a 95% confidence level indicates that there is a 95% probability that the interval contains the true parameter value.
- Margin of Error: The margin of error defines the maximum likely difference between the sample estimate and the true population parameter within the confidence interval.
Correlation Analysis
Correlation analysis examines the strength and direction of relationships between two or more variables. It helps identify patterns and associations in the data, facilitating insights into causal relationships or predictive modeling.
- Pearson Correlation Coefficient: The Pearson correlation coefficient measures the linear relationship between two continuous variables. It ranges from -1 to 1, with 0 indicating no linear correlation, -1 indicating a perfect negative correlation, and 1 indicating a perfect positive correlation.
- Spearman Rank Correlation: Spearman rank correlation assesses the monotonic relationship between variables, allowing for non-linear associations or ordinal data.
Regression Analysis
Regression analysis models the relationship between one or more independent variables and a dependent variable, allowing for prediction and inference. It is widely used in forecasting, risk assessment, and identifying causal relationships.
- Linear Regression: Linear regression models the relationship between variables using a linear equation, with the aim of predicting the value of the dependent variable based on the independent variables.
- Logistic Regression: Logistic regression is used when the dependent variable is binary or categorical, modeling the probability of a certain outcome occurring based on the independent variables.
Quantitative Analysis Examples
Quantitative analysis finds extensive application across various industries and domains, driving evidence-based decision-making and facilitating innovation. Let’s delve into some real-life examples and case studies showcasing the practical implementation of quantitative analysis in action:
1. Financial Market Analysis
In the world of finance, quantitative analysis plays a crucial role in predicting market trends, assessing risk, and optimizing investment strategies. For example, hedge funds and asset management firms utilize quantitative models to analyze historical market data, identify patterns, and execute algorithmic trading strategies. Quantitative analysts (quants) develop complex mathematical models to evaluate stock performance, calculate risk metrics, and construct diversified portfolios. One notable case study is the use of quantitative analysis in high-frequency trading, where rapid data processing and algorithmic trading algorithms enable traders to capitalize on fleeting market opportunities and gain a competitive edge.
2. Healthcare Analytics and Predictive Modeling
In healthcare, quantitative analysis is employed to improve patient outcomes, optimize healthcare delivery, and reduce costs. For instance, predictive modeling techniques are used to forecast patient readmission rates, identify high-risk individuals, and personalize treatment plans. Researchers at healthcare institutions leverage electronic health records (EHR) data to develop predictive models for diseases such as diabetes, heart disease, and cancer. By analyzing patient demographics, medical history, and clinical variables, healthcare providers can proactively intervene, prevent adverse events, and improve the quality of care. A notable example is the use of machine learning algorithms to predict patient deterioration in intensive care units (ICUs), allowing medical staff to prioritize interventions and allocate resources effectively.
3. Marketing and Consumer Behavior Analysis
Quantitative analysis plays a pivotal role in marketing and consumer behavior analysis, enabling businesses to understand customer preferences, optimize marketing campaigns, and drive sales. For instance, e-commerce companies utilize data analytics tools to track website traffic, analyze customer behavior, and personalize product recommendations. A case study of quantitative analysis in action is the use of A/B testing to optimize website design and marketing messaging. By randomly assigning users to different versions of a webpage or advertisement and measuring their response, marketers can determine which variation yields the highest conversion rates and optimize their digital marketing efforts accordingly.
4. Environmental Data Analysis and Climate Modeling
Environmental scientists rely on quantitative analysis to study climate patterns, assess environmental risks, and develop strategies for mitigation and adaptation. For example, climate scientists use numerical models and statistical techniques to analyze temperature data, precipitation patterns, and atmospheric conditions. By analyzing historical climate data and projecting future scenarios, researchers can assess the impacts of climate change on ecosystems, water resources, and human health. A notable case study is the use of quantitative analysis in climate modeling to predict the effects of greenhouse gas emissions on global temperatures, sea levels, and extreme weather events. These models inform policymakers, guide climate policy decisions, and support efforts to mitigate the impacts of climate change.
These examples illustrate the diverse applications and practical implications of quantitative analysis across different sectors. From finance and healthcare to marketing and environmental science, quantitative analysis empowers decision-makers to harness the power of data, gain valuable insights, and drive positive change in the world.
Time Series Analysis
Time series analysis is a specialized branch of quantitative analysis focused on understanding and forecasting data points collected over successive time intervals. It has widespread applications in finance, economics, signal processing, and environmental science. Let’s explore the key aspects of time series analysis in detail.
What is Time Series Analysis?
Time series analysis involves studying the behavior of a variable over time to identify patterns, trends, and relationships. It deals with data that is indexed chronologically, such as stock prices, weather observations, or economic indicators. The primary goal of time series analysis is to make predictions about future values based on past observations, enabling informed decision-making and strategic planning.
Components of Time Series
A time series typically comprises four main components, each contributing to the overall pattern and variability of the data:
- Trend: The long-term movement or directionality observed in the data over time. Trends can be upward (increasing), downward (decreasing), or horizontal (stable).
- Seasonality: Periodic fluctuations or patterns that occur at regular intervals within the data. Seasonality is often associated with calendar or environmental factors, such as seasons, holidays, or weather patterns.
- Cyclicality: Longer-term fluctuations or cycles in the data that are not necessarily tied to seasonal patterns. Cycles may occur irregularly and can span several years or decades.
- Irregularity: Random or unpredictable variations in the data that cannot be attributed to trends, seasonality, or cyclicality. Irregular components represent noise or random fluctuations in the data.
Understanding these components is essential for modeling and forecasting time series data accurately.
Time Series Models
Time series models are mathematical representations used to describe and predict the behavior of time series data. Several models exist, each tailored to specific patterns and characteristics observed in the data.
Moving Average (MA)
The moving average model is a simple yet effective method for smoothing out fluctuations in time series data. It calculates the average of a specified number of consecutive observations, with each observation weighted equally. Moving averages help identify trends and filter out noise in the data.
The formula for a simple moving average (SMA) is:
SMA_t = (X_1 + X_2 + ... + X_n) / n
Where:
SMA_tis the moving average at timet.X_1, X_2, ..., X_nare the data points within the moving average window.nis the number of data points in the moving average window.
Exponential Smoothing
Exponential smoothing is a technique that assigns exponentially decreasing weights to past observations, with more recent observations receiving higher weights. It is particularly useful for capturing short-term trends and adapting quickly to changes in the data.
The formula for exponential smoothing (simple exponential smoothing) is:
S_t = α * X_t + (1 - α) * S_{t-1}
Where:
S_tis the smoothed value at timet.X_tis the observed value at timet.αis the smoothing parameter (0 <α< 1), representing the weight assigned to the current observation.S_{t-1}is the smoothed value at the previous time step.
ARIMA (AutoRegressive Integrated Moving Average)
ARIMA is a powerful and flexible time series model that combines autoregression, differencing, and moving average components to capture different patterns and trends in the data. It is suitable for both stationary and non-stationary time series data and can handle complex patterns such as trends, seasonality, and cyclicality.
The ARIMA model is specified by three main parameters:
- p (Autoregressive Order): The number of lagged observations included in the model.
- d (Differencing Order): The number of times the data is differenced to achieve stationarity.
- q (Moving Average Order): The number of lagged forecast errors included in the model.
ARIMA models are widely used for time series forecasting in various domains, including finance, economics, and environmental science. They offer robustness, scalability, and interpretability, making them a valuable tool for analyzing and predicting time series data.
Quantitative Analysis Tools and Software
Now, let’s explore the diverse range of tools and software available for conducting quantitative analysis. These tools play a crucial role in processing data, performing statistical calculations, and visualizing results, thereby empowering analysts and researchers to gain insights from their data efficiently.
Spreadsheet Tools and Templates
Spreadsheet tools like Microsoft Excel and Google Sheets are ubiquitous in quantitative analysis due to their versatility, user-friendly interface, and wide availability. They offer a range of built-in functions and features that facilitate data manipulation, analysis, and visualization.
- Microsoft Excel: Excel is perhaps the most widely used spreadsheet software worldwide. It provides a rich set of functions for data manipulation, statistical analysis, and charting. Excel’s familiar interface and extensive template library make it accessible to users of all skill levels. It supports advanced features such as pivot tables, regression analysis, and time series forecasting.
- Google Sheets: Google Sheets is a cloud-based spreadsheet tool offered as part of the Google Workspace suite. It enables collaboration in real-time, allowing multiple users to work on the same spreadsheet simultaneously. Google Sheets offers many of the same features as Excel, including formulas, charts, and add-ons, making it a popular choice for collaborative projects and remote teams.
Statistical Software
Dedicated statistical software packages provide advanced analytical capabilities and robust statistical modeling tools, making them indispensable for researchers, statisticians, and data scientists.
- R: R is a powerful open-source programming language and environment for statistical computing and graphics. It offers a vast ecosystem of packages for data analysis, visualization, and machine learning. R’s syntax is designed for statistical analysis, making it highly flexible and customizable. It is widely used in academia, research, and industry for data analysis and research reproducibility.
- Python: Python is a versatile programming language known for its simplicity and readability. It has become increasingly popular in data analysis and machine learning due to libraries like NumPy, Pandas, and SciPy, which provide powerful tools for data manipulation, statistical analysis, and visualization. Python’s extensive ecosystem and ease of integration with other tools make it a preferred choice for many data analysts and researchers.
- SPSS (Statistical Package for the Social Sciences): SPSS is a comprehensive statistical software package widely used in social science research and beyond. It offers a user-friendly interface and a wide range of statistical procedures for data analysis, including descriptive statistics, hypothesis testing, regression analysis, and more. SPSS is known for its ease of use and extensive documentation, making it suitable for both novice and experienced users.
Data Visualization Tools
Data visualization tools enable analysts to communicate insights effectively through charts, graphs, and interactive dashboards. These tools help in uncovering patterns, trends, and relationships within the data, enhancing understanding and decision-making.
- Tableau: Tableau is a leading data visualization tool known for its intuitive drag-and-drop interface and powerful analytical capabilities. It allows users to create interactive dashboards and visualizations from various data sources with ease. Tableau supports a wide range of chart types, including bar charts, line charts, scatter plots, and geographic maps. It is widely used across industries for data exploration, storytelling, and business intelligence.
- Power BI: Power BI is a business analytics tool developed by Microsoft that enables users to visualize and share insights from their data. It offers robust data connectivity, transformation, and modeling capabilities, allowing users to create interactive reports and dashboards. Power BI integrates seamlessly with other Microsoft products, such as Excel and Azure, making it a preferred choice for organizations invested in the Microsoft ecosystem.
These quantitative analysis tools and software empower analysts and researchers to unlock the full potential of their data, enabling data-driven decision-making and actionable insights across various domains and industries,
Quantitative Analysis Applications
Quantitative analysis finds diverse applications across various fields, driving decision-making and problem-solving in real-world scenarios. Let’s explore some of the key domains where quantitative analysis plays a pivotal role.
Finance and Investment Analysis
In finance, quantitative analysis is used extensively for investment decision-making, risk management, and portfolio optimization. Quantitative models and algorithms help investors evaluate asset performance, identify undervalued securities, and construct diversified portfolios. Techniques such as financial modeling, time series analysis, and Monte Carlo simulations enable financial professionals to forecast market trends, assess risk exposure, and develop trading strategies.
Market Research and Consumer Behavior Analysis
Quantitative analysis plays a crucial role in market research and consumer behavior analysis, helping businesses understand customer preferences, market trends, and competitive landscapes. Surveys, experiments, and statistical techniques are used to collect and analyze data on consumer demographics, purchasing behavior, and product preferences. Quantitative market research enables companies to make data-driven decisions regarding product development, pricing strategies, and marketing campaigns.
Operations Management and Supply Chain Optimization
In operations management, quantitative analysis is instrumental in optimizing processes, minimizing costs, and enhancing efficiency in manufacturing and supply chain operations. Techniques such as linear programming, queuing theory, and inventory optimization are used to streamline production processes, manage inventory levels, and allocate resources effectively. Quantitative models help businesses identify bottlenecks, forecast demand, and improve overall operational performance.
Healthcare Analytics
Healthcare analytics leverages quantitative analysis to improve patient care, optimize clinical processes, and enhance health outcomes. Quantitative techniques are applied to analyze electronic health records, clinical trials data, and medical imaging studies. Predictive modeling, machine learning, and data mining enable healthcare providers to identify high-risk patients, personalize treatment plans, and reduce hospital readmissions. Healthcare analytics also facilitates population health management and public health initiatives by identifying disease trends and risk factors.
Environmental Data Analysis
Quantitative analysis plays a vital role in environmental science, enabling researchers to analyze complex datasets, assess environmental risks, and monitor ecosystem health. Statistical techniques, spatial analysis, and geographic information systems (GIS) are used to analyze environmental data, such as climate variables, air quality measurements, and ecological indicators. Quantitative models help scientists understand the impacts of human activities on the environment, predict environmental changes, and inform policy decisions related to conservation and sustainability.
These are just a few examples of the wide-ranging applications of quantitative analysis across different domains. From finance and marketing to healthcare and environmental science, quantitative analysis provides valuable insights and tools for addressing complex challenges and making informed decisions in diverse fields.
Quantitative Analysis Challenges and Limitations
Quantitative analysis, while powerful and versatile, comes with its own set of challenges and limitations that analysts and researchers need to navigate. Understanding these challenges is essential for mitigating potential pitfalls and ensuring the accuracy and reliability of analysis results.
- Data Quality: Poor data quality, including inaccuracies, inconsistencies, and missing values, can compromise the validity of quantitative analysis results. Cleaning and preprocessing data are essential steps to address data quality issues and ensure the integrity of the analysis.
- Assumptions: Quantitative analysis often relies on underlying assumptions about the data and statistical models used. Violations of these assumptions can lead to biased or misleading results. It’s important to assess the validity of assumptions and consider their implications for analysis outcomes.
- Overfitting: Overfitting occurs when a model captures noise or random fluctuations in the data rather than underlying patterns or relationships. This can result in poor generalization performance on unseen data. Techniques such as cross-validation and regularization help mitigate overfitting and improve model robustness.
- Complexity: Some quantitative analysis techniques, such as machine learning algorithms and time series models, can be complex and challenging to interpret. Ensuring transparency and interpretability in analysis results is crucial for stakeholders to understand and trust the findings.
- Data Privacy and Ethics: Quantitative analysis often involves working with sensitive or confidential data, raising concerns about data privacy and ethical considerations. It’s important to adhere to ethical guidelines and regulations governing data usage and protection, such as GDPR and HIPAA, to safeguard individuals’ privacy rights.
Quantitative Analysis Best Practices
To ensure the effectiveness and reliability of quantitative analysis, it’s important to follow best practices throughout the analysis process. Adopting these practices can help mitigate common challenges and enhance the quality and rigor of analysis results.
- Define Clear Objectives: Clearly define the research questions or objectives of the analysis to guide the selection of appropriate methods and techniques. Clearly articulated objectives ensure alignment with stakeholders’ needs and facilitate focused analysis.
- Use Robust Methodologies: Select appropriate quantitative analysis methodologies and techniques based on the nature of the data and research objectives. Consider factors such as data distribution, sample size, and assumptions underlying the chosen methods to ensure robust and reliable results.
- Validate Results: Validate analysis results through sensitivity analysis, robustness checks, and comparison with alternative methodologies or benchmarks. Cross-validation and validation against external data sources can help assess the stability and generalizability of findings.
- Document Processes: Maintain thorough documentation of the analysis process, including data sources, preprocessing steps, model specifications, and interpretation of results. Transparent documentation enhances reproducibility, facilitates peer review, and ensures accountability in analysis outcomes.
- Communicate Effectively: Communicate analysis findings and insights clearly and effectively to stakeholders, using appropriate visualizations, narratives, and presentations. Tailor communication to the intended audience, ensuring accessibility and relevance to decision-makers.
- Continuously Learn and Improve: Stay updated on emerging trends, methodologies, and best practices in quantitative analysis through continuous learning and professional development. Engage in peer collaboration, attend conferences, and participate in training programs to enhance analytical skills and knowledge.
Conclusion
Quantitative analysis serves as a powerful tool in today’s data-driven world, enabling individuals and organizations to make informed decisions, solve complex problems, and drive innovation across various fields. By harnessing the power of numbers, statistical techniques, and mathematical models, quantitative analysis unlocks valuable insights hidden within data, empowering decision-makers to navigate uncertainties and capitalize on opportunities. Whether you’re a financial analyst predicting market trends, a healthcare professional optimizing treatment protocols, or a marketer targeting specific consumer segments, quantitative analysis provides the framework and methodologies to transform data into actionable insights, ultimately leading to improved outcomes and greater success.
Moreover, as technology advances and data availability continues to grow, the importance of quantitative analysis will only increase. By embracing best practices, staying abreast of emerging methodologies, and continuously refining analytical skills, individuals and organizations can leverage the full potential of quantitative analysis to address complex challenges, innovate solutions, and achieve strategic objectives. In a rapidly evolving landscape where data reigns supreme, quantitative analysis serves as a beacon of clarity, guiding us toward evidence-based decisions and a brighter future.
Get Started With a Prebuilt Template!
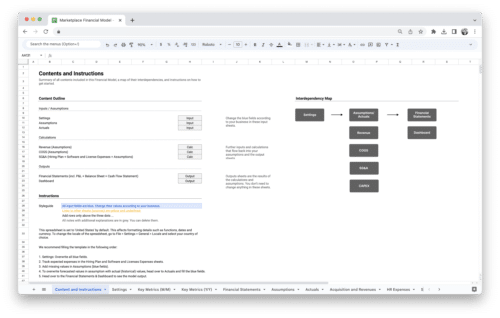
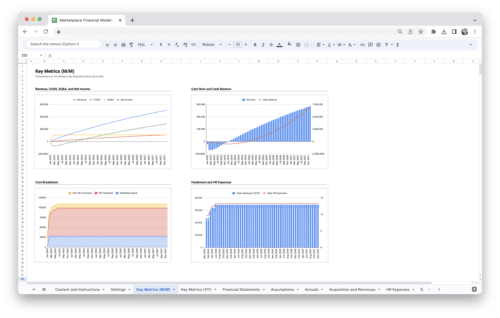
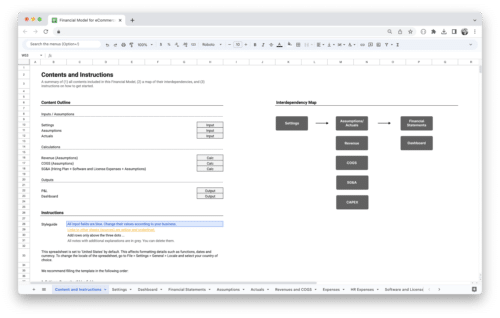
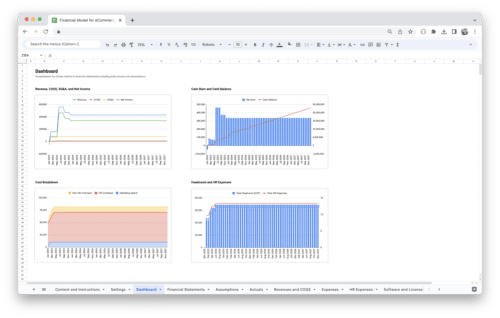
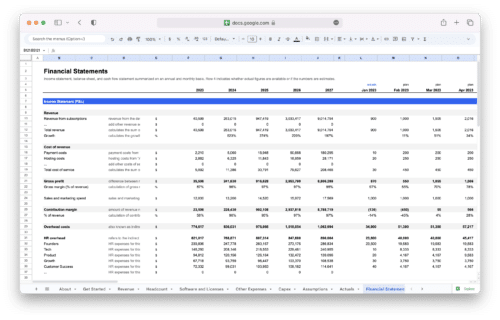
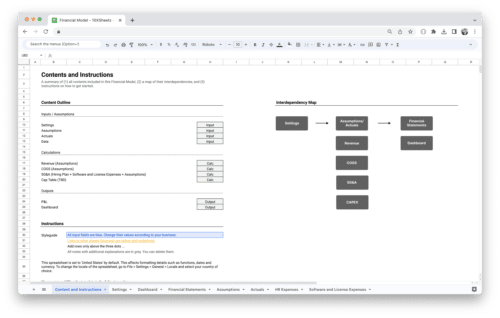
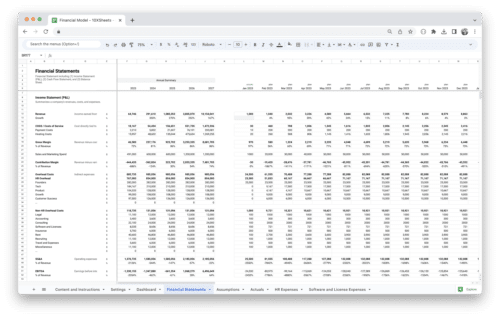
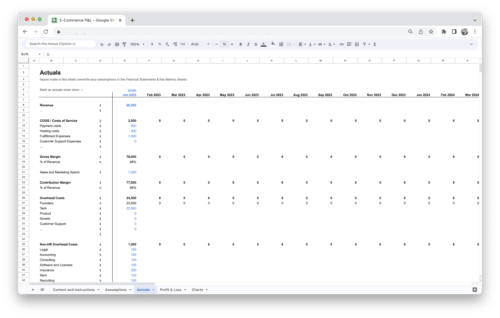
Looking to streamline your business financial modeling process with a prebuilt customizable template? Say goodbye to the hassle of building a financial model from scratch and get started right away with one of our premium templates.
- Save time with no need to create a financial model from scratch.
- Reduce errors with prebuilt formulas and calculations.
- Customize to your needs by adding/deleting sections and adjusting formulas.
- Automatically calculate key metrics for valuable insights.
- Make informed decisions about your strategy and goals with a clear picture of your business performance and financial health.

