Curious about how businesses measure their financial success and efficiency? Profitability ratios serve as powerful tools to gauge a company’s profitability, operational performance, and overall financial health. From gross profit margin to return on equity, these ratios offer valuable insights into a company’s ability to generate profits relative to its revenue, assets, and equity.
In this guide, we’ll delve into the definition, importance, factors affecting, strategies to improve, limitations, and real-world examples of profitability ratios. Whether you’re an investor, analyst, or business owner, understanding profitability ratios is essential for making informed decisions and driving sustainable growth.
What Are Profitability Ratios?
Profitability ratios are financial metrics used to assess a company’s ability to generate profits relative to its revenue, assets, and equity. These ratios provide insights into how effectively a company manages its resources to generate earnings and create value for shareholders. By analyzing profitability ratios, investors, analysts, and stakeholders can evaluate a company’s financial performance, profitability trends, and operational efficiency.
Profitability ratios are essential tools for financial analysis and decision-making processes. They help stakeholders understand a company’s profitability position, compare its performance with industry benchmarks and competitors, and identify areas for improvement.
Overview of Profitability Ratios
Profitability ratios are categorized into several types, including gross profit margin, net profit margin, return on assets (ROA), and return on equity (ROE). Each profitability ratio measures different aspects of a company’s profitability and provides valuable insights into its financial health.
- Gross Profit Margin: Measures the percentage of revenue that exceeds the cost of goods sold (COGS), indicating the efficiency of production and sales processes.
- Net Profit Margin: Indicates the percentage of revenue that translates into net profit after deducting all expenses, including COGS, operating expenses, interest, and taxes.
- Return on Assets (ROA): Evaluates how efficiently a company utilizes its assets to generate profits, indicating the effectiveness of asset management and operational performance.
- Return on Equity (ROE): Measures a company’s profitability relative to its shareholders’ equity, reflecting how effectively it generates profits from shareholders’ investments.
Understanding and analyzing these profitability ratios are crucial for assessing a company’s financial performance, identifying areas for improvement, and making informed investment decisions. By leveraging profitability ratios effectively, stakeholders can gain deeper insights into a company’s profitability, competitiveness, and long-term sustainability.
Types of Profitability Ratios
Profitability ratios are essential metrics used by investors and analysts to assess a company’s ability to generate profits relative to its revenue, assets, and equity. Let’s explore the main types of profitability ratios in more detail:
Gross Profit Margin
The gross profit margin measures the proportion of revenue that exceeds the cost of goods sold (COGS). It indicates how efficiently a company is producing and selling its products or services after accounting for direct production costs.
Formula: Gross Profit Margin = (Revenue – COGS) / Revenue * 100
Interpretation: A higher gross profit margin suggests that a company effectively controls its production costs and can potentially command higher prices for its products or services.
Example: Company XYZ has annual revenue of $1 million and COGS of $600,000. Using the formula: Gross Profit Margin = ($1,000,000 – $600,000) / $1,000,000 * 100 = 40% This means that for every dollar of revenue, Company XYZ retains $0.40 after covering its production costs.
Net Profit Margin
The net profit margin measures the percentage of revenue that translates into net profit after deducting all expenses, including COGS, operating expenses, interest, and taxes. It reflects the overall profitability of a company’s operations.
Formula: Net Profit Margin = (Net Profit / Revenue) * 100
Interpretation: A higher net profit margin indicates that a company effectively manages its expenses and generates more profit from its revenue.
Example: Company ABC reports net income of $100,000 on revenue of $1 million. Using the formula: Net Profit Margin = ($100,000 / $1,000,000) * 100 = 10% This means that for every dollar of revenue, Company ABC retains $0.10 as net profit.
Return on Assets (ROA)
Return on Assets (ROA) measures how efficiently a company utilizes its assets to generate profits. It indicates the percentage of net income generated relative to the total assets employed by the company.
Formula: ROA = Net Income / Total Assets
Interpretation: A higher ROA suggests that a company generates more profit per dollar of assets invested, indicating efficient asset utilization.
Example: Company DEF generates net income of $200,000 and has total assets of $1 million. Using the formula: ROA = $200,000 / $1,000,000 = 20% This means that for every dollar of assets, Company DEF generates $0.20 in net income.
Return on Equity (ROE)
Return on Equity (ROE) measures a company’s profitability relative to its shareholders’ equity. It indicates how effectively a company generates profits from shareholders’ investments.
Formula: ROE = Net Income / Shareholders’ Equity
Interpretation: A higher ROE indicates that a company generates more profit per dollar of shareholders’ equity, reflecting efficient capital utilization and potential for shareholder returns.
Example: Company GHI reports net income of $150,000 and shareholders’ equity of $500,000. Using the formula: ROE = $150,000 / $500,000 = 30% This means that for every dollar of shareholders’ equity, Company GHI generates $0.30 in net income.
Understanding and analyzing these profitability ratios provide valuable insights into a company’s financial performance, operational efficiency, and potential for growth.
Importance of Profitability Ratios in Financial Analysis
Profitability ratios serve as vital tools in financial analysis, offering valuable insights into a company’s performance and financial health. Let’s delve into why these ratios are crucial:
- Performance Evaluation: Profitability ratios help assess how efficiently a company generates profits relative to its revenue, assets, and equity. By analyzing these ratios, investors and analysts can gauge a company’s overall financial performance and operational effectiveness.
- Comparative Analysis: Profitability ratios enable comparisons between companies within the same industry or across different sectors. By benchmarking against industry peers or competitors, stakeholders can identify strengths, weaknesses, and competitive advantages.
- Trend Identification: Tracking changes in profitability ratios over time provides valuable insights into a company’s financial trends and performance trajectory. Analyzing trends helps identify areas of improvement, assess the effectiveness of management strategies, and anticipate future challenges or opportunities.
- Investment Decision Making: Profitability ratios play a crucial role in investment decision-making processes. Investors use these ratios to evaluate the potential returns and risks associated with investing in a particular company. Higher profitability ratios may signal attractive investment opportunities, while declining ratios could indicate potential red flags.
- Financial Health Assessment: Profitability ratios are key indicators of a company’s financial health and sustainability. They provide stakeholders with confidence in the company’s ability to generate profits, meet financial obligations, and create long-term value for shareholders.
- Strategic Planning: Companies use profitability ratios to inform strategic decision-making processes, such as pricing strategies, cost management initiatives, and resource allocation. By understanding their profitability position, companies can identify areas for improvement and formulate actionable strategies to enhance performance and competitiveness.
- Communication Tool: Profitability ratios serve as communication tools between companies and external stakeholders, including investors, creditors, and analysts. Transparent disclosure and analysis of profitability ratios enhance stakeholders’ understanding of a company’s financial performance and foster trust and confidence in its management.
In summary, profitability ratios are indispensable tools in financial analysis, providing valuable insights into a company’s performance, competitive position, and potential for growth and profitability. By leveraging these ratios effectively, stakeholders can make informed decisions, mitigate risks, and maximize returns on investment.
Factors Affecting Profitability Ratios
Profitability ratios are influenced by various factors that impact a company’s ability to generate profits efficiently. Let’s explore these factors in more detail:
Revenue
Revenue is the primary driver of profitability ratios, as it represents the income generated from the sale of goods or services. Factors that affect revenue include:
- Sales Volume: Higher sales volume leads to increased revenue, positively impacting profitability ratios.
- Pricing Strategy: Pricing decisions directly impact revenue. Adjustments in pricing strategies can influence sales revenue and, consequently, profitability ratios.
- Market Demand: Changes in market demand for products or services can affect revenue levels. Understanding market dynamics is essential for revenue forecasting and strategic planning.
Cost of Goods Sold
The cost of goods sold (COGS) directly affects a company’s gross profit margin and overall profitability. Factors influencing COGS include:
- Raw Material Costs: Fluctuations in the prices of raw materials can impact COGS and gross profit margins.
- Production Efficiency: Efficiency in production processes and supply chain management can reduce COGS, improving profitability ratios.
- Inventory Management: Effective inventory management practices minimize carrying costs and obsolescence, positively impacting COGS.
Operating Expenses
Operating expenses include costs incurred in running day-to-day business operations. These expenses affect net profit margin and overall profitability. Key factors influencing operating expenses include:
- Administrative Costs: Expenses related to administrative functions, such as salaries, rent, utilities, and office supplies, impact operating expenses.
- Marketing and Sales Expenses: Investments in marketing and sales activities influence operating expenses but can lead to higher revenue generation if executed effectively.
- Research and Development Costs: Innovation and product development initiatives impact operating expenses but can drive future revenue growth and profitability.
Taxation
Taxation has a significant impact on a company’s net profit margin and overall profitability. Factors related to taxation include:
- Tax Rates: Corporate tax rates imposed by regulatory authorities affect the amount of profit retained by companies.
- Tax Planning Strategies: Effective tax planning strategies can minimize tax liabilities, leading to higher net profit margins and profitability ratios.
- Tax Credits and Incentives: Utilizing tax credits and incentives provided by governments can reduce tax expenses and enhance profitability.
Financial Leverage
Financial leverage refers to the use of debt financing to fund business operations and investments. It influences profitability ratios such as return on equity (ROE). Factors related to financial leverage include:
- Debt Levels: The amount of debt used in a company’s capital structure affects interest expenses and, consequently, net profit margins and ROE.
- Interest Rates: Changes in interest rates impact the cost of debt financing and, consequently, profitability ratios.
- Risk Management: Managing financial risk associated with debt financing is crucial to maintaining profitability and safeguarding shareholder value.
Understanding these factors and their implications on profitability ratios is essential for financial analysis and decision-making processes. By assessing and managing these factors effectively, companies can optimize their profitability and enhance shareholder value.
How to Improve Profitability Ratios?
Improving profitability ratios is essential for enhancing a company’s financial performance and competitiveness in the market. Let’s explore some strategies to improve profitability ratios:
Increasing Revenue
Increasing revenue is a fundamental way to improve profitability ratios. Here are some strategies to boost revenue:
- Expand Market Reach: Identify and tap into new markets or customer segments to increase sales opportunities.
- Product Diversification: Introduce new products or services to cater to evolving customer needs and preferences.
- Price Optimization: Adjust pricing strategies to maximize sales revenue without compromising profitability.
- Sales and Marketing Initiatives: Invest in targeted marketing campaigns and sales promotions to attract new customers and retain existing ones.
Reducing Costs
Cost reduction initiatives can directly impact profitability ratios by improving margins. Consider the following cost-saving strategies:
- Streamline Operations: Identify inefficiencies in business processes and streamline operations to reduce waste and optimize resources.
- Negotiate Supplier Contracts: Negotiate favorable terms with suppliers to lower procurement costs and improve gross profit margins.
- Outsource Non-Core Functions: Outsource non-core activities to specialized service providers to reduce overhead costs and enhance operational efficiency.
- Implement Technology Solutions: Leverage technology solutions to automate repetitive tasks, reduce labor costs, and improve productivity.
Managing Expenses Efficiently
Managing expenses efficiently is crucial for maintaining profitability. Here are some ways to manage expenses effectively:
- Budgeting and Forecasting: Develop detailed budgets and financial forecasts to track expenses and ensure spending remains within allocated limits.
- Expense Control Policies: Implement strict expense control policies and approval processes to prevent unnecessary expenditures.
- Employee Training and Development: Invest in employee training and development programs to enhance skills and productivity, ultimately reducing operational costs.
- Energy and Resource Conservation: Adopt energy-efficient practices and sustainable resource management techniques to minimize utility costs and environmental impact.
Optimizing Capital Structure
Optimizing the capital structure can improve profitability ratios by reducing financing costs and enhancing returns on equity. Consider the following strategies:
- Debt Restructuring: Evaluate existing debt obligations and explore opportunities for refinancing or restructuring debt to lower interest expenses.
- Equity Financing: Consider issuing new equity or preferred shares to raise capital instead of relying solely on debt financing.
- Balancing Debt and Equity: Maintain an optimal mix of debt and equity in the capital structure to minimize financial risk while maximizing returns for shareholders.
- Capital Allocation: Allocate capital strategically to high-return projects and initiatives that align with the company’s long-term growth objectives.
By implementing these strategies effectively, companies can improve profitability ratios, strengthen their financial position, and create sustainable value for shareholders and stakeholders.
Examples of Profitability Ratios in Action
To illustrate how profitability ratios are applied in financial analysis, let’s consider some real-world examples:
Company A: Retail Store
Company A operates a retail store selling consumer electronics. Let’s analyze its profitability ratios for the fiscal year 2023:
- Gross Profit Margin: Company A’s total revenue for the year was $5,000,000, and its cost of goods sold (COGS) amounted to $3,000,000.Gross Profit Margin = (Revenue – COGS) / Revenue * 100 = ($5,000,000 – $3,000,000) / $5,000,000 * 100 = $2,000,000 / $5,000,000 * 100 = 40%Company A’s gross profit margin is 40%, indicating that it retains 40 cents from every dollar of revenue after covering its production costs.
- Net Profit Margin: Company A’s operating expenses, including salaries, rent, utilities, and marketing expenses, amounted to $1,500,000. After deducting operating expenses, interest, and taxes, the company reported a net income of $500,000.Net Profit Margin = (Net Profit / Revenue) * 100 = ($500,000 / $5,000,000) * 100 = 10%Company A’s net profit margin is 10%, indicating that it retains 10 cents as net profit from every dollar of revenue.
- Return on Assets (ROA): Company A’s total assets, including inventory, equipment, and cash equivalents, amounted to $3,000,000.ROA = Net Income / Total Assets = $500,000 / $3,000,000 ≈ 16.67%Company A’s return on assets (ROA) is approximately 16.67%, indicating that it generates about 16.67 cents in net income for every dollar of assets invested.
- Return on Equity (ROE): Company A’s shareholders’ equity, representing owners’ investments in the business, amounted to $1,000,000.ROE = Net Income / Shareholders’ Equity = $500,000 / $1,000,000 = 50%Company A’s return on equity (ROE) is 50%, indicating that it generates 50 cents in net income for every dollar of shareholders’ equity.
These examples demonstrate how profitability ratios provide valuable insights into a company’s financial performance, efficiency, and profitability. By analyzing profitability ratios, stakeholders can assess a company’s profitability position, compare it with industry benchmarks, and make informed decisions regarding investment, strategy, and operations.
Company B: Software as a Service (SaaS) Company
Let’s examine the profitability ratios of Company B, a SaaS company, for the fiscal year 2023:
- Gross Profit Margin: Company B’s total revenue for the year was $10,000,000, and its cost of revenue (which includes hosting expenses, customer support, and maintenance costs) amounted to $3,000,000.Gross Profit Margin = (Revenue – Cost of Revenue) / Revenue * 100 = ($10,000,000 – $3,000,000) / $10,000,000 * 100 = $7,000,000 / $10,000,000 * 100 = 70%Company B’s gross profit margin is 70%, indicating that it retains 70 cents from every dollar of revenue after covering its cost of revenue.
- Net Profit Margin: Company B’s total operating expenses, including salaries, marketing, and research and development, amounted to $5,000,000. After deducting operating expenses, interest, and taxes, the company reported a net income of $2,000,000.Net Profit Margin = (Net Profit / Revenue) * 100 = ($2,000,000 / $10,000,000) * 100 = 20%Company B’s net profit margin is 20%, indicating that it retains 20 cents as net profit from every dollar of revenue.
- Return on Assets (ROA): Company B’s total assets, including intellectual property, software licenses, and cash reserves, amounted to $8,000,000.ROA = Net Income / Total Assets = $2,000,000 / $8,000,000 = 25%Company B’s return on assets (ROA) is 25%, indicating that it generates 25 cents in net income for every dollar of assets invested.
- Return on Equity (ROE): Company B’s shareholders’ equity, representing owners’ investments in the business, amounted to $6,000,000.ROE = Net Income / Shareholders’ Equity = $2,000,000 / $6,000,000 = 33.33%Company B’s return on equity (ROE) is approximately 33.33%, indicating that it generates about 33.33 cents in net income for every dollar of shareholders’ equity.
These examples highlight how profitability ratios vary across industries and companies, providing insights into their financial performance, efficiency, and profitability. By analyzing profitability ratios, stakeholders can assess a company’s profitability position, compare it with industry benchmarks, and make informed decisions regarding investment, strategy, and operations.
Limitations of Profitability Ratios
While profitability ratios are valuable tools for financial analysis, it’s essential to recognize their limitations. Let’s explore some of the key limitations of profitability ratios:
Accounting Distortions
Profitability ratios can be subject to accounting distortions due to differences in accounting methods, principles, and policies employed by companies. Some common accounting distortions include:
- Non-Recurring Items: Profitability ratios may be affected by one-time or non-recurring items, such as restructuring charges, asset write-offs, or gains/losses from discontinued operations.
- Revenue Recognition: Variations in revenue recognition practices can distort profitability ratios, particularly if companies recognize revenue prematurely or defer expenses.
- Depreciation Methods: Differences in depreciation methods used for capital assets can impact net income and, consequently, profitability ratios.
Industry-Specific Factors
Profitability ratios may vary significantly across industries due to differences in business models, operating dynamics, and market conditions. Industry-specific factors that can influence profitability ratios include:
- Capital Intensity: Industries with high capital requirements, such as manufacturing or utilities, may have lower profitability ratios due to higher depreciation and interest expenses.
- Regulatory Environment: Regulatory requirements and compliance costs can affect operating expenses and profitability ratios in regulated industries like banking or healthcare.
- Competitive Landscape: Intense competition within an industry can put pressure on pricing, margins, and profitability ratios.
Economic Conditions
Economic conditions, such as inflation, interest rates, and economic cycles, can impact profitability ratios. Factors related to economic conditions include:
- Inflationary Pressures: Rising inflation can erode purchasing power and squeeze profit margins, particularly if companies cannot pass on increased costs to customers.
- Interest Rate Fluctuations: Changes in interest rates affect borrowing costs and financing expenses, influencing profitability ratios, especially for highly leveraged companies.
- Market Demand: Economic downturns or shifts in consumer behavior can impact sales volumes, pricing, and revenue, directly affecting profitability ratios.
One-Time Events
Profitability ratios may be distorted by one-time events or irregular occurrences that do not reflect the underlying business performance. Examples of one-time events include:
- Mergers and Acquisitions: Accounting for merger-related expenses or integration costs can distort profitability ratios in the short term.
- Asset Sales or Impairments: Gains or losses from asset sales or impairments can affect net income and profitability ratios in a particular period.
- Legal Settlements: Costs associated with legal settlements or litigation can impact expenses and profitability ratios temporarily.
Understanding these limitations is crucial for interpreting profitability ratios accurately and making informed decisions based on financial analysis. Analysts and investors should consider these factors when assessing a company’s financial performance and comparing profitability ratios across different companies and industries.
Conclusion
Profitability ratios are indispensable tools for assessing a company’s financial performance and efficiency. By analyzing metrics like gross profit margin, net profit margin, return on assets, and return on equity, stakeholders can gain valuable insights into a company’s profitability position, operational effectiveness, and potential for growth. These ratios enable informed decision-making, strategic planning, and benchmarking against industry standards and competitors.
In today’s dynamic business environment, mastering profitability ratios is essential for investors, analysts, and business owners alike. By understanding the factors influencing profitability ratios, implementing effective strategies to improve them, and recognizing their limitations, stakeholders can navigate financial complexities with confidence and drive sustainable success. Embracing the insights provided by profitability ratios empowers organizations to optimize profitability, enhance shareholder value, and thrive in an ever-evolving marketplace.
Get Started With a Prebuilt Template!
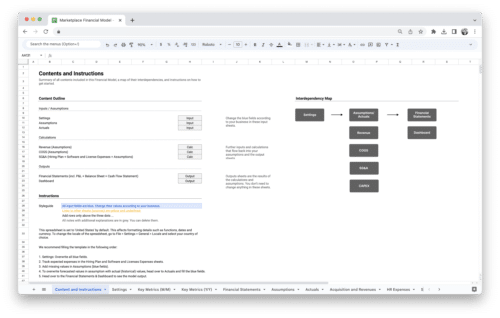
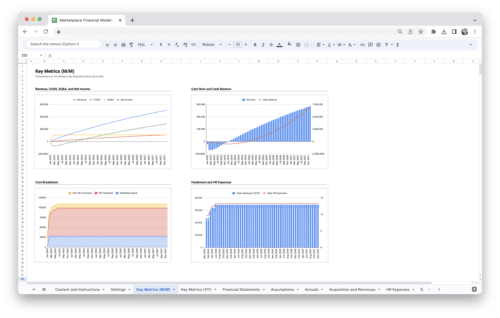
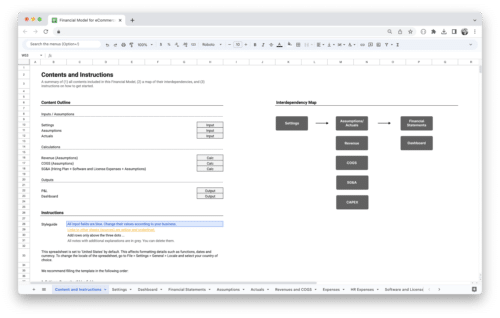
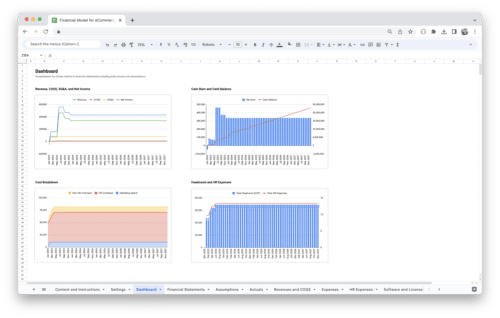
Looking to streamline your business financial modeling process with a prebuilt customizable template? Say goodbye to the hassle of building a financial model from scratch and get started right away with one of our premium templates.
- Save time with no need to create a financial model from scratch.
- Reduce errors with prebuilt formulas and calculations.
- Customize to your needs by adding/deleting sections and adjusting formulas.
- Automatically calculate key metrics for valuable insights.
- Make informed decisions about your strategy and goals with a clear picture of your business performance and financial health.

