- What is Profitability Analysis?
- Understanding Profitability Metrics
- Types of Profitability Analysis
- Key Factors Influencing Profitability
- Profitability Analysis Tools and Techniques
- How to Interpret Profitability Results?
- Profitability Analysis Challenges
- How to Improve Profitability Through Analysis?
- Conclusion
How profitable is your business really? Understanding how much money your business is making compared to what it’s spending is key to ensuring long-term success. Profitability analysis is all about digging into your financial data to uncover how efficiently your company is generating profit. It helps you make smarter decisions, whether you’re looking to increase revenue, reduce costs, or simply track how well your business is doing.
This guide will walk you through everything you need to know about profitability analysis, from key metrics to useful tools and techniques, and show you how it can help you improve your bottom line. Whether you’re just starting out or looking to fine-tune your financial strategies, profitability analysis is the secret to running a successful, sustainable business.
What is Profitability Analysis?
Profitability analysis is a financial assessment that helps a business evaluate its ability to generate profit relative to its revenue, costs, and expenses over a specific period. It involves reviewing key financial data and calculating various profitability metrics to assess how effectively a business is utilizing its resources to create value. By analyzing profitability, businesses can determine whether they are achieving their financial goals, identify areas for improvement, and set strategies to enhance long-term growth.
At its core, profitability analysis focuses on understanding the relationship between the costs incurred and the income generated by a business. It looks at both operational and non-operational aspects, offering a complete picture of the business’s financial health. Companies perform profitability analysis regularly, often during annual reviews or quarterly reports, to measure performance and track changes over time. This process helps organizations refine their strategies and take actionable steps to ensure they remain profitable in a competitive market.
Importance of Profitability in Business Operations
Profitability is not just a key indicator of a company’s financial health; it is also central to the long-term sustainability and success of a business. Without profitability, a company cannot reinvest in growth, expand its operations, or reward its employees and shareholders.
- Profitability provides the funds needed for business expansion, product development, and innovation.
- It ensures that the business can continue its operations and meet financial obligations, even in tough times.
- Profitability supports competitive advantage by allowing businesses to reinvest in marketing, technology, and customer retention strategies.
- High profitability enhances the company’s ability to weather economic downturns or market fluctuations.
- It creates value for shareholders, providing returns on investment and increasing stock value.
- Profitability can boost the company’s reputation in the market, as it reflects financial strength and stability, attracting investors and partners.
How Profitability Analysis Helps in Decision-Making
Profitability analysis offers valuable insights that can guide business decision-making. By understanding where and how profits are generated, businesses can make informed decisions that enhance efficiency, reduce costs, and capitalize on growth opportunities. Analyzing profitability provides a roadmap for prioritizing initiatives, setting budgets, and evaluating financial risks and rewards.
For example, profitability analysis helps determine:
- Which product lines are most profitable, guiding inventory management and resource allocation.
- Whether pricing strategies need to be adjusted to improve margins without losing customers.
- Where cost-cutting measures can be applied, ensuring that money is spent efficiently across operations.
- What areas of the business are underperforming, allowing you to refocus efforts on high-margin opportunities.
- When to invest in expansion by identifying periods of high profitability that can support new ventures or market entry.
By relying on profitability analysis, businesses avoid guesswork and base their decisions on hard data. This leads to better resource management, higher return on investment (ROI), and improved long-term success.
Key Metrics Used in Profitability Analysis
To effectively assess and interpret profitability, businesses rely on several key metrics that provide a detailed view of how efficiently revenue is being converted into profit. These metrics help to pinpoint areas of success and areas that need improvement, guiding businesses toward financial decisions that promote growth and sustainability.
- Gross Profit Margin: This metric indicates how much profit a business makes after deducting the cost of goods sold (COGS). It measures the efficiency of production and how effectively the company is managing its direct costs.
Gross Profit Margin = (Revenue – COGS) / Revenue * 100 - Operating Profit Margin: Operating profit margin shows the percentage of revenue left after covering operating expenses like wages, rent, and utilities, but before accounting for interest and taxes. It reflects the core profitability of a company’s operations.
Operating Profit Margin = Operating Income / Revenue * 100 - Net Profit Margin: Net profit margin is the ultimate measure of profitability, representing the percentage of revenue that remains as profit after all expenses, including taxes and interest, have been subtracted. This metric provides a complete view of a company’s profitability.
Net Profit Margin = Net Income / Revenue * 100 - Contribution Margin: This metric helps businesses understand how much revenue is available to cover fixed costs after covering variable costs. It is often used to evaluate individual products or services.
Contribution Margin = (Revenue – Variable Costs) / Revenue * 100
These metrics are crucial for assessing the profitability of a business and identifying areas where financial performance can be improved. By tracking these key indicators, companies can ensure they are on track to meet their financial goals and make necessary adjustments to enhance profitability.
Understanding Profitability Metrics
Profitability metrics are essential tools for assessing the financial performance of a business. These metrics help you measure how well your company generates profit from its revenue. By understanding these key performance indicators (KPIs), you can make informed decisions that enhance your profitability. Each metric tells a different part of the story, allowing you to evaluate your company’s financial health from multiple angles.
Gross Profit Margin
Gross Profit Margin is one of the most fundamental metrics used in profitability analysis. It provides insight into the efficiency of your production process, showing how much profit you make after covering the direct costs of producing goods or services. Essentially, it tells you how much of your revenue remains after accounting for the cost of goods sold (COGS), which includes materials, labor, and manufacturing expenses.
Gross Profit Margin Formula:
Gross Profit Margin = (Revenue – Cost of Goods Sold) / Revenue * 100
For example, if your revenue is $1,000,000 and your COGS is $600,000, your gross profit margin is calculated as:
(1,000,000 – 600,000) / 1,000,000 * 100 = 40%
A 40% gross profit margin means that for every dollar of revenue, your business retains 40 cents after accounting for the direct costs associated with producing your products or services. The higher this margin, the more efficient your business is in turning revenue into profit.
This metric is especially useful for understanding the pricing structure and production efficiency of your business. A decline in gross profit margin could indicate rising production costs, declining product prices, or inefficiencies in your manufacturing process. On the other hand, an increasing gross profit margin suggests better control over production costs or an ability to charge higher prices for your goods or services.
Operating Profit Margin
Operating Profit Margin provides a deeper look at your business’s profitability by taking into account both the direct costs (COGS) and operating expenses, which include rent, utilities, marketing, salaries, and other costs that are necessary to run your business day-to-day. Unlike the gross profit margin, this metric accounts for all operational costs, giving you a clearer picture of how well your business is managing its operations.
Operating Profit Margin Formula:
Operating Profit Margin = Operating Income / Revenue * 100
Operating income is your gross profit minus all operating expenses, including wages, rent, and marketing costs. If your operating income is $150,000 and your revenue is $1,000,000, the calculation would be:
150,000 / 1,000,000 * 100 = 15%
This means your business retains 15% of every dollar in revenue after covering operating expenses. This metric helps you understand how efficiently your business is generating profit from its operations. A strong operating profit margin indicates that your business is managing its expenses well, while a lower margin could suggest that operating costs are too high relative to revenue.
Operating profit margin is a critical metric for evaluating ongoing operations, as it does not include the effects of financing decisions or one-off events like the sale of assets. It’s particularly useful for businesses that want to understand how their core operations are performing, independent of non-operational factors like taxes or interest expenses.
Net Profit Margin
Net Profit Margin is the most comprehensive measure of profitability because it takes into account all expenses, including interest, taxes, and non-operating costs. This metric reveals how much of your revenue remains as profit after everything has been paid. Essentially, it provides the “bottom line” of profitability and is often used to assess the overall financial health of a business.
Net Profit Margin = Net Income / Revenue * 100
Net income is your total revenue minus all expenses, including operating costs, interest, taxes, and one-time charges. For instance, if your net income is $100,000 and your revenue is $1,000,000, the net profit margin would be:
100,000 / 1,000,000 * 100 = 10%
A 10% net profit margin means that for every dollar of revenue, your business generates 10 cents in profit after covering all expenses. This metric is the ultimate indicator of your business’s profitability and reflects the ability to turn revenue into actual earnings. A higher net profit margin suggests that your business is efficiently managing all aspects of costs, from production to financing.
Net profit margin is crucial for comparing the profitability of businesses in the same industry. It allows you to evaluate whether your business is more or less efficient than competitors in generating profit from sales. A declining net profit margin over time may indicate that your business is facing rising costs or inefficiencies that need to be addressed.
Contribution Margin
Contribution Margin focuses specifically on the profitability of individual products or services. It highlights how much revenue from each sale contributes to covering fixed costs and generating profit. Unlike gross profit margin, which looks at the overall costs of goods sold, contribution margin isolates variable costs (those that fluctuate with production volume) to show how much profit each product contributes after these costs are covered.
Contribution Margin = (Revenue – Variable Costs) / Revenue * 100
For example, if a product generates $50,000 in revenue and has variable costs of $20,000, the contribution margin would be:
(50,000 – 20,000) / 50,000 * 100 = 60%
This means that 60% of the revenue from this product contributes to covering fixed costs and generating profit. Contribution margin is an invaluable metric when deciding which products or services are the most profitable for your business. It helps you prioritize high-margin products or services that can drive greater profitability.
By analyzing the contribution margins of various products or services, you can make more informed decisions about where to allocate resources. For example, if a particular product has a low contribution margin, you might want to reconsider its pricing strategy or look for ways to reduce its variable costs.
This metric is particularly useful in cost-volume-profit (CVP) analysis, which helps businesses understand the relationship between costs, sales volume, and profitability. It helps in making pricing decisions, evaluating product performance, and deciding whether to continue or discontinue certain product lines.
Understanding and analyzing profitability metrics like gross profit margin, operating profit margin, net profit margin, and contribution margin is essential for gaining insights into the financial performance of your business. These metrics help you pinpoint areas where improvements can be made, guide strategic decisions, and ensure that your business remains financially healthy and profitable over time.
Types of Profitability Analysis
When conducting profitability analysis, you have several methods at your disposal. Each type of analysis offers a unique perspective, helping you understand different aspects of your business’s financial health. By employing these methods, you can uncover trends, evaluate financial performance, and make data-driven decisions that enhance your profitability. Let’s explore these common types of profitability analysis.
Horizontal Analysis
Horizontal analysis is a method of comparing financial data over time to identify trends, growth patterns, or potential issues. This type of analysis allows you to track how key financial metrics, such as revenue, expenses, and profits, change from one period to another—typically on a year-over-year or quarter-over-quarter basis. It helps you spot whether your company is improving or facing a decline in profitability over time.
The core principle of horizontal analysis is the comparison of financial data over multiple periods, enabling you to see changes in amounts or percentages. By tracking historical data, you can identify which areas of your business are growing and which may need attention.
For example, comparing the net profit margin over five years can show whether profitability has been increasing or decreasing. If your net profit margin has dropped year after year, it may be a sign that operating expenses are rising or revenue growth is slowing.
The formula for horizontal analysis is straightforward:
Percentage Change = (Current Period Amount – Previous Period Amount) / Previous Period Amount * 100
If you are comparing revenue from two years and your revenue in Year 1 is $1,000,000, and in Year 2, it’s $1,200,000, the calculation would look like this:
(1,200,000 – 1,000,000) / 1,000,000 * 100 = 20%
A 20% increase in revenue from Year 1 to Year 2 suggests that your business is experiencing healthy growth. If there is a negative percentage change, however, it signals potential issues that need addressing.
Horizontal analysis is particularly useful for long-term planning, budgeting, and forecasting. It allows you to compare actual results with past performance and adjust strategies accordingly to maintain or boost profitability.
Vertical Analysis
Vertical analysis is a method that involves analyzing financial statements by expressing each line item as a percentage of a base figure. It allows you to assess the relative proportions of various elements within a given financial statement. The goal is to identify how different components of your business’s financials relate to overall revenue or assets, giving you a clearer picture of cost structure and profitability.
For an income statement, vertical analysis expresses each expense item (such as the cost of goods sold, operating expenses, and taxes) as a percentage of total revenue. Similarly, on a balance sheet, each asset, liability, and equity item is expressed as a percentage of total assets. This method makes it easier to compare companies of different sizes and assess how efficiently resources are being allocated.
For example, if you’re analyzing an income statement where total revenue is $1,000,000 and the cost of goods sold (COGS) is $400,000, the vertical analysis would show:
COGS as a percentage of revenue = (400,000 / 1,000,000) * 100 = 40%
This means that 40% of every dollar in revenue is spent on producing goods or services. By applying this approach to all line items, you can gain a better understanding of which expenses are eating into your profits.
Vertical analysis is particularly helpful when comparing profitability across different companies or industries, as it normalizes financial data, making it easier to identify cost inefficiencies or profitability gaps. It can also help highlight areas where you can reduce costs or adjust pricing.
Break-even Analysis
Break-even analysis is a critical tool for understanding the point at which your business neither makes a profit nor incurs a loss. The break-even point (BEP) is where total revenue equals total costs, which means that all fixed and variable costs have been covered by the revenue generated. Knowing your break-even point helps you set sales targets and understand the financial thresholds needed for your business to become profitable.
This analysis allows you to calculate how many units of a product or service you need to sell in order to cover your costs. Once you’ve reached this point, every sale beyond the break-even point contributes directly to profit.
The basic formula for break-even analysis is:
Break-even Point (in units) = Fixed Costs / (Selling Price per Unit – Variable Cost per Unit)
For example, if your fixed costs are $100,000, your selling price per unit is $50, and your variable cost per unit is $30, the calculation would be:
100,000 / (50 – 30) = 5,000 units
This means that you would need to sell 5,000 units of your product to break even. Any sales beyond this point represent profit.
Break-even analysis is crucial for determining pricing strategies, understanding the impact of cost changes, and setting realistic sales goals. By knowing your break-even point, you can focus on reaching and exceeding this threshold to ensure profitability. It’s also a powerful tool for managing risk, as it helps you determine how much margin for error you have before your business starts to lose money.
Contribution Margin Analysis
Contribution margin analysis helps you understand how much each product or service contributes to covering fixed costs and generating profit. Unlike gross profit margin, which looks at overall costs, contribution margin analysis isolates the variable costs associated with producing each unit of a product, giving you a clearer picture of each product’s profitability.
This analysis is particularly useful when evaluating individual products or services within your business, especially when deciding whether to continue, discontinue, or adjust certain offerings. By understanding the contribution margin, you can make more informed decisions about resource allocation and prioritize high-margin products.
The formula for calculating contribution margin is:
Contribution Margin = (Revenue – Variable Costs) / Revenue * 100
For example, if a product generates $100,000 in revenue and has $40,000 in variable costs, the contribution margin would be:
(100,000 – 40,000) / 100,000 * 100 = 60%
This means that 60% of the revenue from this product contributes to covering fixed costs and generating profit. The higher the contribution margin, the more profitable the product is relative to its production costs.
Contribution margin analysis is vital for businesses that offer multiple products or services. It helps you determine which products or services are the most profitable and which may require adjustments, whether through pricing changes, cost reductions, or discontinuation. This method is especially helpful for companies with a diverse product portfolio, allowing you to focus on those that drive the most profitability.
Each of these types of profitability analysis provides valuable insights into the financial performance of your business. By using horizontal and vertical analysis, you can track trends, compare different periods, and analyze the relative proportions of revenue and expenses. Break-even analysis gives you a clear understanding of the financial thresholds needed to achieve profitability, while contribution margin analysis highlights the profitability of individual products. Together, these methods form a comprehensive approach to evaluating and improving profitability, helping you make data-driven decisions that lead to long-term business success.
Key Factors Influencing Profitability
Profitability doesn’t just depend on a few isolated factors; it is influenced by a wide array of internal and external elements. By understanding these factors, you can make smarter decisions that drive your business towards higher profitability. Whether it’s how you generate revenue, control costs, or adapt to market conditions, each of these components plays a critical role in determining how much profit your business can achieve.
Revenue Generation Strategies
Generating revenue is the core of profitability, but how you approach revenue generation can greatly impact your financial outcomes. There are numerous strategies that businesses can use to maximize revenue, each tailored to the unique nature of the business, market, and target customers.
- Diversifying Revenue Streams: Businesses that rely on one source of revenue are more vulnerable to changes in that market. By diversifying—such as introducing new products, offering subscription services, or exploring new customer segments—you spread the risk and have more avenues to generate income.
- Expanding Market Reach: Targeting new geographical areas or expanding into new customer segments can drive significant revenue growth. For example, taking a local product and expanding it internationally can open up a larger pool of potential customers.
- Increasing Customer Retention: Retaining existing customers is often more cost-effective than acquiring new ones. Offering loyalty programs, providing excellent customer service, or creating subscription models can help ensure that customers return for repeat business.
- Leveraging Digital Channels: The rise of e-commerce and digital marketing has made it easier for businesses to reach a broader audience. By improving your online presence, optimizing digital sales channels, and using targeted marketing strategies, you can increase your revenue potential with relatively low overhead costs.
- Upselling and Cross-Selling: Offering complementary products or premium options to your customers can boost average transaction values. Upselling (encouraging customers to purchase more expensive versions) and cross-selling (recommending related products) are powerful strategies for maximizing revenue per customer.
These strategies, if aligned with your business model and customer needs, can help drive consistent revenue growth and improve profitability.
Cost Management and Efficiency
Effective cost management and efficiency are just as critical to profitability as revenue generation. By controlling costs without sacrificing quality, you ensure that your business retains more of its income as profit. There are two main types of costs to consider—fixed and variable—and both need to be optimized for long-term profitability.
- Fixed Costs: These costs do not change regardless of the level of goods or services produced. Examples include rent, salaries, and insurance. While fixed costs remain constant, managing them is crucial. Negotiating better lease terms or finding ways to streamline operations (e.g., automating processes or reducing overhead) can lower fixed costs over time.
- Variable Costs: These fluctuate depending on the volume of production or sales. For example, raw materials or hourly labor costs are considered variable. By improving supply chain management, using energy-efficient equipment, or finding cheaper suppliers, businesses can reduce their variable costs and improve profitability.
- Operational Efficiency: Streamlining business operations through automation, better logistics, and process improvements helps to reduce inefficiencies and lower costs. For example, implementing software solutions that automate invoicing, inventory management, or customer relationship management (CRM) can save both time and money.
- Outsourcing: For non-core functions, outsourcing can be a cost-effective way to improve efficiency. Outsourcing tasks like accounting, IT support, or even customer service can reduce costs while allowing your business to focus on its core activities.
By continuously evaluating and optimizing both fixed and variable costs, and identifying areas where you can operate more efficiently, your business can retain more of its revenue as profit.
Market Conditions and Competition
The broader market environment plays a crucial role in determining your profitability. External factors, including economic conditions, industry trends, and the competitive landscape, can all impact the pricing power, sales volume, and profitability of your business.
- Economic Conditions: Fluctuations in the economy, such as recessions or booms, can significantly affect consumer spending and demand for products and services. During economic downturns, people may cut back on discretionary spending, leading to lower revenues and potentially reduced profit margins. On the other hand, periods of economic growth can increase demand, allowing businesses to charge higher prices and increase profitability.
- Industry Trends: Staying ahead of industry trends can give your business a competitive edge. Whether it’s adopting new technologies, responding to consumer preferences, or capitalizing on market shifts (e.g., the rise of sustainability or remote work), aligning your business with emerging trends can improve profitability.
- Competition: Competition is one of the most immediate forces impacting profitability. In highly competitive markets, profit margins can be squeezed as businesses cut prices to attract customers. Differentiating your product or service—whether through quality, unique features, or superior customer service—can help mitigate competitive pressures and preserve profitability. Regularly monitoring competitor pricing, product offerings, and marketing strategies will allow you to remain agile and adjust your approach when necessary.
By understanding and adapting to market conditions, you can better position your business to maximize profitability, even in the face of external challenges.
Pricing Strategies
Pricing is one of the most influential factors in determining your profitability. Set the right price, and you can achieve high profit margins; set it too low, and you risk eroding your profitability. Setting the right price involves balancing customer perceptions of value with your costs and desired profit margins.
- Cost-Plus Pricing: This strategy involves setting the price of your product or service by adding a standard markup to your costs. It’s simple and ensures that your costs are covered while allowing for a predictable profit margin. However, it may not always be optimal if market conditions or customer willingness to pay aren’t considered.
- Value-Based Pricing: This strategy sets the price based on the perceived value of the product or service to the customer, rather than on costs. If your offering solves a significant problem or provides unique benefits, you may be able to command a higher price, thus increasing profitability.
- Penetration Pricing: For new products or services, penetration pricing involves setting a low price initially to attract customers and gain market share. Once you’ve established a loyal customer base, you can increase the price. This strategy is effective in competitive markets but requires careful consideration of long-term profitability.
- Premium Pricing: This strategy involves pricing your product or service higher than competitors by positioning it as a high-quality, exclusive offering. Luxury brands, for example, often use this strategy to maintain high-profit margins and build brand prestige.
- Dynamic Pricing: This strategy involves adjusting prices based on demand, competition, or other market conditions. For instance, many airlines and hotels use dynamic pricing, offering lower prices during off-peak periods and increasing prices during high demand.
The right pricing strategy for your business will depend on your product, market, and competitive landscape. By choosing the right approach, you can maximize both sales volume and profit margins, driving higher overall profitability.
Each of these factors—revenue generation strategies, cost management, market conditions, and pricing strategies—are essential to driving profitability. By continually refining your approach to each of these areas, you can improve your business’s financial performance and build a solid foundation for long-term growth and success. Balancing these elements allows you to make the most of every dollar in revenue, ensuring that your business is as profitable as possible.
Profitability Analysis Tools and Techniques
Achieving a deep understanding of your business’s profitability requires the right set of tools and techniques to collect, analyze, and interpret financial data. By using a variety of tools, you can track your performance, uncover trends, and make data-driven decisions that directly impact your profitability. From traditional financial statements to advanced software, each tool offers unique insights into different aspects of your business.
Financial Statement Analysis
Financial statement analysis is one of the most basic but powerful tools for profitability analysis. It involves reviewing key financial documents—such as the income statement, balance sheet, and cash flow statement—to gain insights into a company’s financial health. These documents provide a detailed view of your revenue, costs, assets, liabilities, and cash flow, all of which are vital for evaluating profitability.
- Income Statement: This shows the revenues, expenses, and profits over a specific period, giving you a clear picture of operational performance. It helps you understand whether your business is making or losing money during the reporting period.
- Balance Sheet: The balance sheet lists all your company’s assets, liabilities, and equity. Analyzing it helps you understand your financial position at a specific point in time, giving you a snapshot of how well you manage your resources to generate profit.
- Cash Flow Statement: This shows how money flows in and out of your business, helping you understand your ability to maintain cash reserves for operations and investments. It’s crucial for assessing liquidity and sustainability.
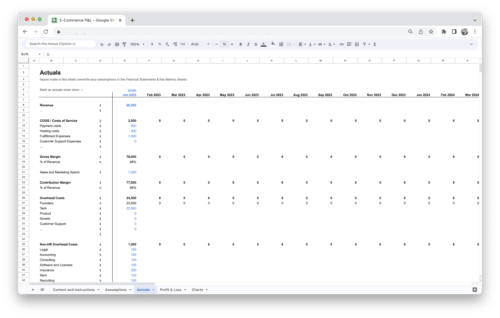
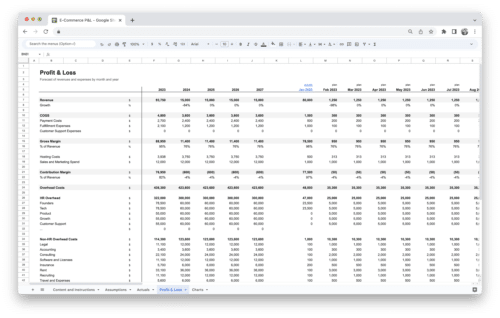
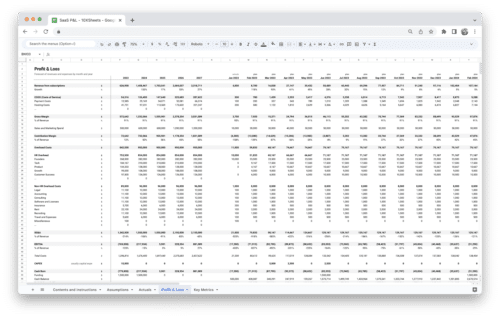
Using spreadsheets or templates can make financial statement analysis more accessible and efficient. These tools allow you to input data and automatically generate financial statements that can be analyzed for profitability. Popular spreadsheet programs like Excel or Google Sheets offer built-in functions to calculate financial ratios, trends, and projections, simplifying the analysis process.
Templates can also be highly beneficial. Many accounting platforms or online resources offer pre-designed templates that automatically organize financial data into comprehensible formats. This way, you can focus on interpreting the results rather than organizing the raw data.
Ratio Analysis Tools
Ratio analysis involves comparing key financial figures to evaluate the profitability, efficiency, and financial health of your business. These ratios help you measure the effectiveness of your business operations and make informed decisions about future growth or adjustments.
- Profitability Ratios: These ratios are designed to assess how well your company is generating profit from its operations. Common profitability ratios include the gross profit margin, operating profit margin, and net profit margin. These ratios provide insights into your business’s ability to convert revenue into profit.
- Liquidity Ratios: These ratios, like the current ratio and quick ratio, measure your company’s ability to meet short-term financial obligations, which can affect its ability to stay profitable in times of financial stress.
- Efficiency Ratios: Ratios like asset turnover and inventory turnover help evaluate how efficiently your company uses its assets to generate sales. Higher efficiency typically leads to higher profitability, as you are making the most out of your resources.
- Leverage Ratios: Ratios such as the debt-to-equity ratio provide insight into your company’s debt levels relative to its equity, which can affect profitability by determining how much of your profits are used to pay interest on borrowed funds.
These ratios can be calculated manually using financial statements, but automated tools make this process much easier and faster. Online platforms like QuickBooks, Zoho Books, or even Excel templates can automatically generate a wide range of profitability ratios based on your financial data, allowing you to quickly assess your business’s performance.
Profitability Analysis Software and Tools
Modern software solutions have revolutionized profitability analysis by automating many of the tasks that traditionally required manual calculation and data entry. These tools not only streamline the process but also provide advanced features that offer deeper insights into profitability.
- Accounting Software: Tools like QuickBooks, Xero, and FreshBooks allow you to generate financial statements, track expenses, and measure profitability all in one place. These platforms often come with built-in reporting features that help you analyze key metrics and identify trends.
- Profitability Analysis Software: There are specialized software solutions, like ProfitWell, that offer in-depth profitability analysis. These tools can break down profitability by product, service, or customer segment, helping you identify the most profitable areas of your business.
- Financial Forecasting Tools: Tools like LivePlan or PlanGuru help forecast future profitability by allowing you to model different financial scenarios. This helps you plan for the future, assessing how changes in expenses, revenue, or market conditions may impact profitability.
- Business Intelligence (BI) Tools: Advanced BI platforms like Tableau or Power BI provide powerful visualization capabilities that allow you to analyze profitability through dynamic dashboards and reports. These tools can integrate with your financial data and present insights in real-time, making it easier to spot trends and anomalies.
Automation not only saves time but also reduces the risk of human error in calculations. By leveraging these tools, you can generate accurate and actionable insights that help you make strategic decisions aimed at increasing profitability.
Benchmarking Against Industry Standards
Benchmarking is a technique that involves comparing your business’s profitability and performance to that of similar companies or industry averages. It provides a context for evaluating how well you’re doing compared to your competitors or industry peers. Benchmarking against industry standards helps you understand whether your profitability is on par with other companies in your sector or if there are areas where you may be underperforming.
- Industry Reports and Data: Many industry organizations, financial analysts, and research firms publish annual reports that offer benchmarks for profitability ratios, margins, and other financial metrics within specific industries. By comparing your numbers to these benchmarks, you can determine how competitive your business is within its market.
- Competitor Analysis: Understanding how your competitors perform financially gives you a valuable perspective on your business’s profitability. While direct competitor data may not always be available, some tools and platforms allow you to estimate competitor performance through market intelligence.
- Custom Benchmarking: If industry-wide benchmarks are not available or don’t apply to your specific business, you can create custom benchmarks by comparing similar-sized businesses within your region or niche. These customized benchmarks offer more tailored insights into where your business stands in relation to others.
Benchmarking can highlight areas where your business excels or falls short in terms of profitability. If you discover that your profit margins are lower than the industry average, it could indicate inefficiencies, pricing issues, or an opportunity for cost reduction. Conversely, higher-than-average profitability may point to effective strategies that can be replicated across other areas of the business.
The tools and techniques discussed—financial statement analysis, ratio analysis, automation tools, and benchmarking—are all integral to understanding and improving your business’s profitability. By leveraging these resources, you can gain deeper insights into your financial performance, spot trends early, and make data-driven decisions that increase profitability. Whether you prefer using traditional methods or adopting advanced software, having the right tools at your disposal is essential for long-term business success.
How to Interpret Profitability Results?
Interpreting profitability results is about more than just looking at raw numbers. It involves analyzing trends, comparing performance over time, and evaluating how different factors influence the bottom line. By developing a deep understanding of your profitability results, you can uncover insights that inform better decision-making and ultimately help improve your business’s financial health.
Identifying Trends and Patterns in Profitability
Identifying trends and patterns in profitability helps you understand whether your business is on a positive trajectory or facing potential challenges. Profitability trends can reveal a lot about the health and direction of your business. By observing how key metrics evolve over time, you can spot both opportunities for growth and potential risks.
One of the first things to look for is growth or decline in profitability over time. Are your profit margins increasing year over year, or are they shrinking? A consistent upward trend in profitability is a strong sign of a healthy business, whereas a downward trend can signal rising costs, declining sales, or inefficiencies in your operations.
Key indicators to look for when identifying trends include:
- Gross Profit Margin: A rising gross profit margin over time suggests that your production processes are becoming more efficient or that you’re able to command higher prices for your products. Conversely, a decrease could signal rising input costs or pricing pressure.
- Operating Profit Margin: This margin will help you understand whether your operational efficiency is improving. A growing operating profit margin might indicate better cost control, more effective operations, or both.
- Net Profit Margin: Changes in this margin reflect the overall health of your business, factoring in not only operating expenses but also financing costs, taxes, and other non-operating factors. Increasing net profit margins often point to improvements in overall business management.
Recognizing these patterns enables you to adjust strategies quickly. For instance, if you notice a decline in profitability, you might look at where costs are rising or how market conditions are changing, giving you the chance to pivot before it impacts your bottom line significantly.
Comparing Profitability Across Different Time Periods
Comparing profitability across different time periods helps you assess whether your business is improving, stagnating, or declining. By looking at multiple periods (monthly, quarterly, or annually), you can evaluate whether your profitability is seasonal, cyclical, or influenced by broader economic conditions.
You may choose to compare your profitability:
- Year-over-year (YoY): This is a common method for assessing long-term performance. It helps eliminate seasonal fluctuations and provides a clearer view of how your business has progressed over a full year.
- Quarter-over-quarter (QoQ): A shorter-term comparison can highlight immediate impacts, such as the effects of a marketing campaign or a change in production costs. These comparisons help you identify which periods are stronger or weaker and why.
- Month-over-month (MoM): While less common for long-term analysis, MoM comparisons can be useful for quickly spotting trends or assessing the impact of short-term actions (like launching a new product or increasing prices).
For example, if your business sees a significant dip in profitability during the summer months, comparing profitability across quarters may reveal this seasonal pattern, allowing you to plan better and adjust for leaner months. Alternatively, a sudden drop in profitability in one quarter compared to another might prompt you to investigate new market dynamics or operational issues.
Assessing Profitability by Product or Service Line
When analyzing profitability at a granular level, it’s essential to look at individual products or service lines. Not all products or services contribute equally to your profitability, and understanding which ones drive the most revenue is key to making strategic decisions about resource allocation, pricing, and product development.
Product-level profitability analysis can help you answer questions such as:
- Which products have the highest profit margins?
- Are there any products that consistently underperform in terms of profitability?
- How do product costs compare to the revenue they generate?
By focusing on profitability by product or service line, you can:
- Prioritize high-margin products: If one product generates significantly higher margins than others, you may want to focus more on promoting or scaling this product.
- Discontinue or improve low-margin products: If certain products are consistently underperforming, you might consider discontinuing them or revisiting their pricing or production strategies to improve their profitability.
- Identify upselling opportunities: If a certain product generates high revenue but low margins, there may be opportunities to increase its profitability through bundling, offering complementary products, or adjusting its pricing strategy.
This level of analysis is particularly useful for businesses with diverse product offerings, as it helps ensure resources are spent on the most profitable areas. By aligning your product strategy with profitability insights, you can make smarter decisions that maximize your business’s overall financial performance.
Profitability in Relation to Market Share
Your market share directly impacts your profitability. A larger market share typically means more customers, which can lead to increased sales and economies of scale. However, understanding the relationship between profitability and market share requires more than just tracking sales volume; it involves assessing how well your business is leveraging its market position to generate profit.
Several factors come into play when considering this relationship:
- Economies of Scale: As your market share grows, you may be able to lower your per-unit costs, leading to higher profitability. For example, larger production volumes often allow businesses to negotiate better terms with suppliers or reduce production costs.
- Pricing Power: A larger market share can provide you with greater pricing power, allowing you to charge premium prices without losing customers. However, this depends on factors like customer loyalty and perceived value.
- Competition: As your market share increases, you may face increased competition. This could put downward pressure on prices or force you to spend more on marketing, which could negatively impact profitability if not managed carefully.
- Market Saturation: If you have captured a significant portion of the market, future profitability growth may become more difficult. In mature markets, maintaining profitability while trying to grow market share can require significant investment in innovation, customer retention, or operational efficiency.
By understanding how your market share affects profitability, you can make strategic decisions about how to compete more effectively. For example, if your market share is shrinking and profitability is declining, it may be time to reassess your pricing, marketing, or product offerings to ensure that you are not losing ground to competitors.
Interpreting profitability results is not just about reviewing numbers—it’s about deriving meaningful insights that inform your business strategy. By identifying trends, comparing performance over time, assessing profitability by product or service line, and understanding the relationship between profitability and market share, you can position your business for sustained financial success. This comprehensive analysis helps you make adjustments as needed and maximize your business’s profitability potential.
Profitability Analysis Challenges
Profitability analysis is an essential part of managing any business, but it comes with its fair share of challenges. These obstacles can make it difficult to obtain accurate and actionable insights, potentially leading to poor decision-making or missed opportunities. Being aware of these challenges can help you take proactive steps to overcome them and ensure that your profitability analysis remains effective.
- Data accuracy and integrity: If the financial data you’re using for profitability analysis is incorrect or incomplete, your results will be skewed, leading to misleading conclusions. Ensuring that all data is accurate, up-to-date, and properly recorded is a constant challenge. Inaccurate reporting, inconsistent data entry, or errors in financial software can all undermine the reliability of your analysis.
- Complexities in cost allocation: Accurately allocating costs, especially indirect costs (like overhead or shared expenses), can be difficult. For example, dividing general administrative costs among different departments or products requires careful estimation and allocation methods. Misallocation of costs can lead to incorrect profitability assessments and hinder effective decision-making.
- Variability in market conditions: External market conditions, such as economic shifts, changing customer preferences, or new regulations, can affect profitability in ways that are hard to predict or control. These factors often introduce volatility, making it difficult to assess profitability trends accurately over time.
- Subjectivity in analysis: Profitability analysis can be influenced by subjective decisions about which metrics to focus on or how to interpret results. For example, one analyst may emphasize gross profit margins while another focuses on net profit margins, leading to different conclusions about the same business performance.
- Time and resource constraints: Conducting thorough profitability analysis requires time, effort, and skilled personnel. Smaller businesses, in particular, may not have the resources to dedicate to detailed profitability assessments. As a result, they may overlook critical insights or fail to adjust strategies in a timely manner.
- Overlooking non-financial factors: Profitability analysis often focuses heavily on financial metrics, but non-financial factors such as customer satisfaction, employee morale, and brand reputation can also impact long-term profitability. Failing to consider these aspects may lead to a short-sighted view of business performance.
How to Improve Profitability Through Analysis?
Improving profitability is the ultimate goal of any business, and profitability analysis plays a critical role in identifying areas of improvement. By understanding where your business stands financially and where changes can be made, you can implement strategies that lead to greater efficiency, cost savings, and higher margins.
- Identify and eliminate inefficiencies: Use profitability analysis to pinpoint areas where costs are disproportionately high relative to revenue. This may include areas like production, supply chain, or administrative functions. Streamlining operations and removing inefficiencies can have a significant impact on your overall profitability.
- Optimize pricing strategies: Profitability analysis helps you understand how well your pricing strategies are working. Adjusting prices, offering tiered pricing, or introducing premium options can increase profitability. Analyzing how price changes impact demand and margins can help you find the optimal pricing model.
- Increase revenue by targeting profitable customer segments: Through profitability analysis, you can identify which customer segments or product lines are the most profitable. Focusing marketing efforts on these high-margin customers or expanding offerings that perform well can drive higher revenue and improve overall profitability.
- Focus on high-margin products or services: Assessing profitability by product line allows you to identify which offerings contribute the most to your bottom line. You can then prioritize these products, increase their availability, or develop complementary products to further capitalize on their success.
- Improve cost control and reduce waste: Profitability analysis highlights where overspending or waste occurs, whether it’s in raw materials, labor, or operational processes. By addressing these inefficiencies, such as by renegotiating supplier contracts or implementing more efficient production methods, you can improve profitability.
- Enhance cash flow management: By examining profitability through cash flow, you can ensure that your business has enough liquidity to support growth and meet financial obligations. Improving cash flow management—through better payment terms, quicker invoicing, or reducing inventory levels—can free up resources and improve profitability over time.
- Invest in technology and automation: Leveraging tools and automation in areas like accounting, inventory management, and customer relationship management can significantly reduce costs and improve efficiency. Profitability analysis can guide decisions about where to invest in technology to streamline operations and drive profitability.
- Focus on customer retention and lifetime value: By using profitability analysis to understand the lifetime value (LTV) of your customers, you can develop strategies to increase retention and reduce churn. Higher customer retention can boost profits by reducing the costs associated with acquiring new customers and maximizing the value of existing ones.
By consistently applying profitability analysis to evaluate performance and drive improvements, your business can increase profitability and achieve long-term financial success.
Conclusion
Profitability analysis is one of the most powerful tools you can use to run a successful business. By understanding how much profit you’re generating and where your costs are coming from, you can make smarter, more informed decisions that directly impact your bottom line. Whether you’re adjusting pricing strategies, cutting unnecessary costs, or focusing on your most profitable products, this kind of analysis allows you to stay on top of your financial health. The metrics and tools discussed throughout this guide give you a clear picture of your business’s strengths and weaknesses, so you can make the necessary changes to improve profitability over time.
In the end, profitability isn’t just about making more money; it’s about making your business more efficient, sustainable, and competitive. By regularly reviewing and interpreting profitability results, you’ll be able to spot trends, identify opportunities for growth, and steer your business in the right direction. Remember, profitability analysis isn’t a one-time task—it’s an ongoing process that helps you keep your business on track and ensure long-term success. The more you rely on data-driven insights, the better equipped you’ll be to navigate challenges, boost profitability, and build a stronger, more resilient business.
Get Started With a Prebuilt Template!
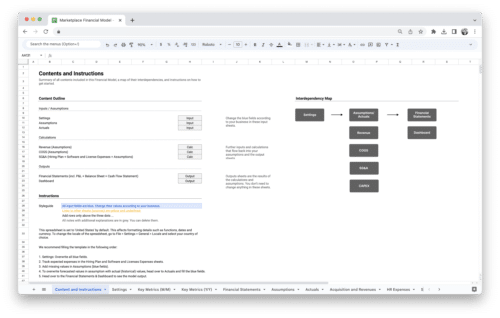
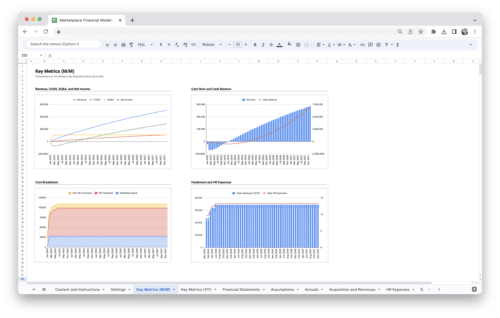
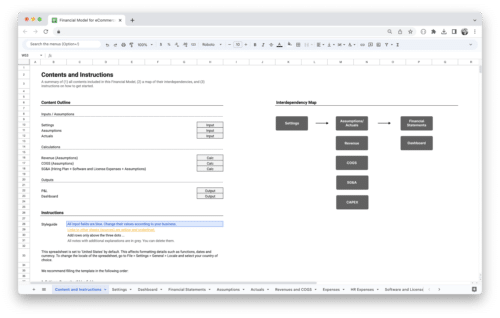
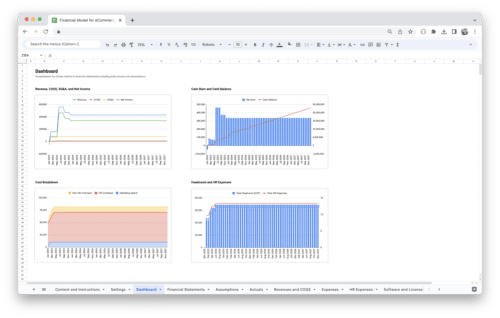
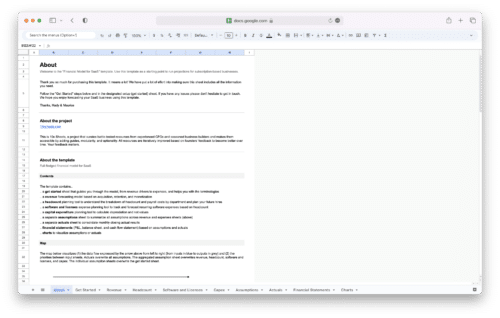
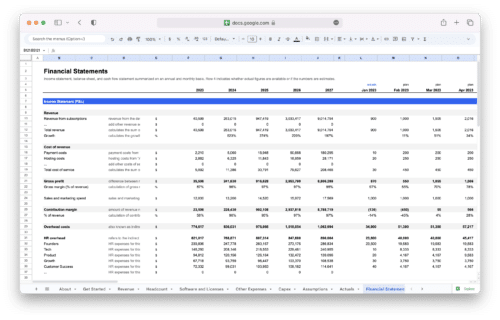
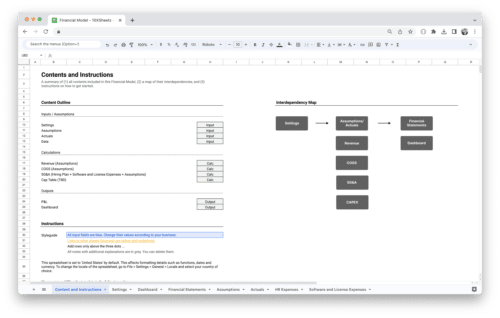
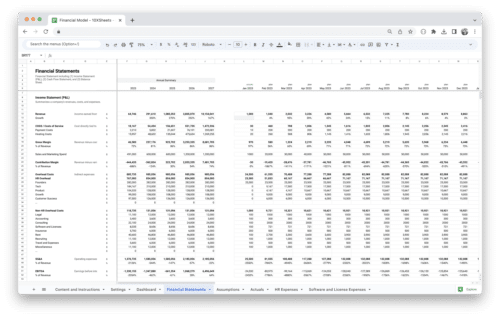
Looking to streamline your business financial modeling process with a prebuilt customizable template? Say goodbye to the hassle of building a financial model from scratch and get started right away with one of our premium templates.
- Save time with no need to create a financial model from scratch.
- Reduce errors with prebuilt formulas and calculations.
- Customize to your needs by adding/deleting sections and adjusting formulas.
- Automatically calculate key metrics for valuable insights.
- Make informed decisions about your strategy and goals with a clear picture of your business performance and financial health.

