What Are Performance Metrics Definition Types Examples
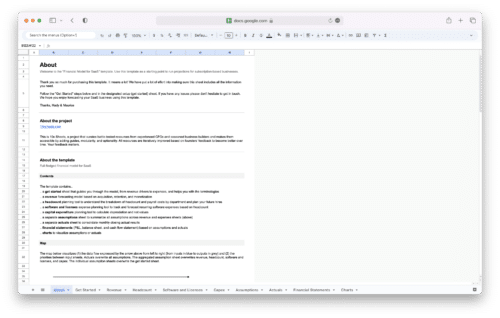
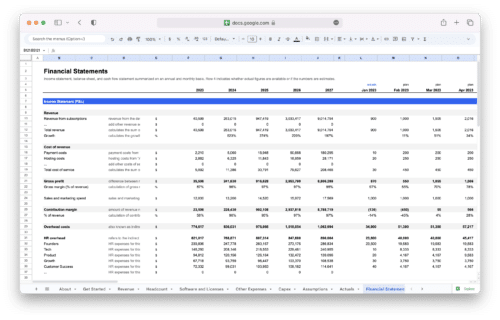
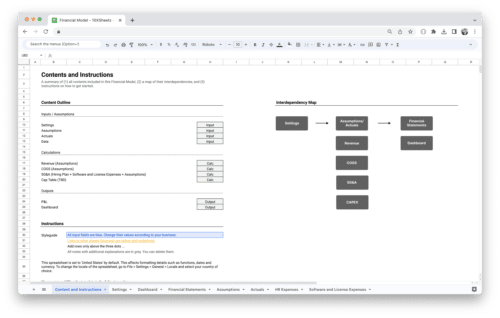
Get Started With a Prebuilt Model

Start with a free template and upgrade when needed.

Are you striving to understand how your business is performing and where it can improve? Performance metrics are the compass that guides organizations through the vast landscape of data, helping them navigate toward success. In today’s fast-paced business world, having a clear understanding of performance metrics is crucial for making informed decisions and driving growth. Whether you’re a small startup or a multinational corporation, performance metrics provide invaluable insights into your operations, finances, customers, and employees.

By measuring key indicators of performance, you can identify strengths, uncover weaknesses, and chart a course for improvement. This guide is designed to demystify the world of performance metrics, offering practical insights, actionable strategies, and real-world examples to help you harness the power of data and propel your business forward.

What Are Performance Metrics?

Understanding the definition of performance metrics is fundamental to grasping their significance and application in business contexts. Performance metrics are quantitative measures used to assess and evaluate the effectiveness, efficiency, and success of various aspects of business operations. These metrics provide actionable insights into key performance areas, allowing organizations to track progress, identify areas for improvement, and make informed decisions.

Performance metrics can encompass a wide range of factors, including financial performance, operational efficiency, customer satisfaction, employee productivity, and more. By defining and measuring performance metrics accurately, organizations can gain valuable insights into their performance and take proactive steps to optimize processes, drive growth, and achieve strategic objectives.

Importance of Performance Metrics in Business

Performance metrics play a crucial role in helping businesses measure, manage, and improve their performance across various functions and departments. Here are several reasons why performance metrics are essential in business:

  • Data-Driven Decision Making: Performance metrics provide objective, quantifiable data that informs decision-making at all levels of the organization. By relying on data rather than intuition or guesswork, businesses can make more informed, evidence-based decisions that drive success.
  • Goal Setting and Monitoring: Performance metrics enable organizations to set clear, specific goals and monitor progress towards achieving them. By establishing measurable targets and tracking performance against these targets, businesses can stay focused and accountable for their objectives.
  • Identifying Areas for Improvement: Performance metrics highlight areas of strength and weakness within the organization, allowing businesses to identify opportunities for improvement and optimization. By pinpointing inefficiencies or bottlenecks, businesses can take targeted actions to enhance performance and drive growth.
  • Driving Accountability: Performance metrics create accountability by establishing clear expectations and benchmarks for performance. When employees and teams are held accountable for their performance against predefined metrics, they are more motivated to deliver results and strive for excellence.
  • Aligning Efforts with Objectives: Performance metrics help align the efforts of individuals, teams, and departments with overarching organizational objectives. By ensuring that everyone is working towards common goals and priorities, businesses can achieve greater cohesion and synergy across the organization.
  • Monitoring Progress Towards Strategic Goals: Performance metrics enable businesses to track progress towards strategic goals and initiatives. By measuring key indicators of success, businesses can gauge whether they are on track to achieve their long-term vision and make course corrections as needed.
  • Enhancing Customer Satisfaction: Performance metrics related to customer satisfaction and loyalty provide valuable insights into the customer experience. By measuring factors such as Net Promoter Score (NPS) or customer retention rate, businesses can identify areas where they can improve customer service and drive loyalty.
  • Optimizing Resource Allocation: Performance metrics help businesses allocate resources effectively by identifying areas of high performance and return on investment. By reallocating resources to high-impact areas and deprioritizing low-performing activities, businesses can optimize their use of time, money, and manpower.
  • Benchmarking and Competitive Analysis: Performance metrics allow businesses to benchmark their performance against industry peers and competitors. By comparing performance against industry averages or best practices, businesses can identify opportunities for differentiation and competitive advantage.

Overall, performance metrics serve as a critical tool for driving continuous improvement, fostering accountability, and achieving strategic objectives in today’s dynamic and competitive business environment. By leveraging performance metrics effectively, businesses can enhance their agility, resilience, and long-term success.

Key Types of Performance Metrics

Understanding the key types of performance metrics is essential for effectively evaluating and improving various aspects of your business. Let’s delve into each category to explore their significance and some commonly used metrics within each.

Financial Metrics

Financial metrics provide insights into the economic health and performance of your business. By analyzing financial metrics, you can assess your company’s profitability, revenue generation, and overall financial stability. Here are some essential financial metrics:

  • Return on Investment (ROI): ROI measures the profitability of an investment relative to its cost. It’s calculated by dividing the net profit generated by an investment by the initial investment cost and expressing the result as a percentage.
    ROI = (Net Profit / Initial Investment) * 100%
  • Operating Income: Operating income, also known as operating profit, represents the profit generated from the core operations of your business. It’s calculated by subtracting operating expenses from gross profit.
    Operating Income = Gross Profit - Operating Expenses
  • Debt-to-Equity Ratio: This ratio indicates the proportion of debt and equity used to finance a company’s assets. It’s calculated by dividing total liabilities by shareholders’ equity.
    Debt-to-Equity Ratio = Total Liabilities / Shareholders' Equity
  • Cash Conversion Cycle (CCC): CCC measures the time it takes for a company to convert its investments in inventory and other resources into cash flows from sales. It’s calculated by adding the days inventory outstanding, days sales outstanding, and days payable outstanding and subtracting accounts payable turnover days.
    CCC = DIO + DSO - DPO
  • Profit Margin: Profit margin indicates the percentage of revenue that exceeds the costs associated with producing goods or services. It’s calculated by dividing net income by revenue and expressing the result as a percentage.
    Profit Margin = (Net Income / Revenue) * 100%

Operational Metrics

Operational metrics focus on assessing the efficiency, productivity, and quality of your business operations. These metrics help you identify areas for improvement and optimize processes to enhance overall performance. Here are some fundamental operational metrics to track:

  • Cycle Time: Cycle time measures the total time required to complete a specific process or task, from start to finish. It helps identify bottlenecks and opportunities for process optimization.
    Cycle Time = Total Processing Time / Number of Units Produced
  • Productivity Rate: Productivity rate quantifies the output generated per unit of input (e.g., labor, resources, or time). It’s calculated by dividing total output by total input.
    Productivity Rate = Total Output / Total Input
  • Customer Complaint Resolution Time: This metric measures the average time taken to resolve customer complaints or issues. It’s crucial for maintaining high levels of customer satisfaction and loyalty.
  • First Pass Yield (FPY): FPY calculates the percentage of products or services that meet quality standards on the first attempt without requiring rework or correction.
    FPY = (Number of Good Units / Total Number of Units) * 100%
  • Inventory Turnover Ratio: Inventory turnover ratio indicates how efficiently a company manages its inventory by measuring the number of times inventory is sold or used within a specific period.
    Inventory Turnover Ratio = Cost of Goods Sold / Average Inventory

Customer Metrics

Customer metrics focus on understanding and improving the customer experience, satisfaction, and loyalty. These metrics provide insights into customer behavior, preferences, and perceptions, allowing businesses to tailor their strategies accordingly. Here are some crucial customer metrics to track:

  • Customer Lifetime Value (CLV): CLV predicts the total revenue a customer is expected to generate over the entire duration of their relationship with your business. It helps prioritize customer acquisition and retention efforts.
    CLV = (Average Purchase Value * Average Purchase Frequency) / Churn Rate
  • Customer Churn Rate: Churn rate measures the percentage of customers who stop doing business with your company over a specific period. High churn rates can indicate underlying issues with product quality or customer service.
    Churn Rate = (Number of Customers Lost / Total Number of Customers) * 100%
  • Net Revenue Retention (NRR): NRR evaluates the revenue retained from existing customers over a certain period, accounting for upgrades, cross-sells, and downgrades.
  • Customer Satisfaction Score (CSAT): CSAT measures the level of satisfaction among customers based on their responses to surveys or feedback forms.
  • Customer Acquisition Cost (CAC): CAC calculates the average cost incurred to acquire a new customer, including marketing, sales, and advertising expenses.

Employee Metrics

Employee metrics focus on evaluating the engagement, satisfaction, and productivity of your workforce. By tracking these metrics, you can identify areas for improvement and create a positive work environment conducive to employee retention and performance. Here are some essential employee metrics:

  • Employee Satisfaction Score: Similar to CSAT for customers, employee satisfaction score measures the level of satisfaction and engagement among employees based on surveys or feedback.
  • Turnover Rate: Turnover rate calculates the percentage of employees who leave the company over a specific period. High turnover rates can indicate dissatisfaction or issues within the workplace.
  • Absenteeism Rate: Absenteeism rate measures the frequency and duration of employee absences from work. Excessive absenteeism can impact productivity and morale.
  • Employee Net Promoter Score (eNPS): eNPS measures the likelihood of employees to recommend your company as a place to work to others. It provides insights into employee loyalty and advocacy.
  • Productivity per Employee: Productivity per employee quantifies the output or value generated by each employee within a certain timeframe. It helps assess individual and team performance levels.

Understanding and effectively utilizing these key types of performance metrics can significantly contribute to the success and growth of your business. By monitoring and analyzing these metrics regularly, you can make informed decisions, identify areas for improvement, and drive overall performance and profitability.

How to Choose the Best Performance Metrics for Your Business?

Selecting the right metrics for your business is crucial for accurately assessing performance and making informed decisions.

1. Understand Business Objectives

Before selecting metrics, it’s essential to have a clear understanding of your business objectives. What are you trying to achieve? Are you aiming to increase revenue, improve customer satisfaction, streamline operations, or enhance employee productivity? By identifying your overarching goals, you can pinpoint which areas of your business require measurement and improvement.

For example, if your primary objective is to increase profitability, you may focus on financial metrics such as gross profit margin, net profit margin, and return on investment. On the other hand, if your goal is to enhance customer satisfaction, you may prioritize metrics like customer satisfaction score (CSAT), Net Promoter Score (NPS), and customer retention rate.

2. Identify Key Performance Areas

Once you’ve defined your business objectives, the next step is to identify the key performance areas that directly impact those objectives. These are the specific aspects of your business operations that you need to measure and monitor to gauge success. Key performance areas may vary depending on the nature of your business, industry, and strategic priorities.

For instance, if you’re running an e-commerce business, key performance areas may include website traffic, conversion rates, average order value, and customer acquisition cost. If you’re in the manufacturing sector, key performance areas may revolve around production efficiency, quality control, and inventory management.

3. Align with Strategic Goals

Metrics should not only reflect your immediate business objectives but also align with your long-term strategic goals. Consider how each metric contributes to your broader vision for the company and whether it helps you move closer to achieving your strategic milestones. Metrics that are directly linked to strategic goals provide clarity and direction for decision-making at all levels of the organization.

For example, if your strategic goal is to expand into new markets, you may focus on metrics related to market penetration, customer acquisition in target regions, and revenue growth from new market segments. By aligning your metrics with strategic goals, you ensure that everyone in the organization is working towards common objectives.

4. Consider Your Industry and Business Model

When selecting metrics, it’s essential to take into account the unique characteristics of your industry and business model. Different industries have varying performance drivers and benchmarks, so what works for one industry may not be relevant for another. Similarly, businesses operating under different models (e.g., B2B, B2C, SaaS) may prioritize different metrics based on their operational nuances and revenue streams.

For instance, a software-as-a-service (SaaS) company may focus on metrics like monthly recurring revenue (MRR), customer lifetime value (CLV), and churn rate, which are critical for subscription-based businesses. Meanwhile, a retail store may emphasize metrics such as same-store sales growth, inventory turnover, and average transaction value.

By considering industry-specific factors and aligning metrics with your business model, you can ensure that your performance measurement framework is tailored to your unique circumstances and objectives. This strategic approach to metric selection enhances the relevance and effectiveness of your performance tracking efforts, ultimately driving better business outcomes.

Examples of Performance Metrics in Action

Performance metrics play a crucial role in assessing the health and success of various aspects of business operations. Let’s explore some real-life scenarios of how performance metrics can be leveraged to drive improvement and make informed decisions:

Example 1: Customer Acquisition Cost (CAC)

Imagine you’re running a digital marketing campaign to acquire new customers for your e-commerce store. By tracking your Customer Acquisition Cost (CAC), you can measure the effectiveness of your marketing efforts and optimize your spending.

Scenario: You invest $5,000 in a Facebook advertising campaign over a month and acquire 200 new customers during that period.

Calculation: CAC = Total Marketing Spend / Number of New Customers Acquired CAC = $5,000 / 200 CAC = $25 per customer

Action: With this insight, you can assess the cost-effectiveness of your marketing campaign. If the CAC exceeds your target or industry benchmarks, you may need to refine your targeting, messaging, or channels to improve ROI.

Example 2: Inventory Turnover Ratio

Suppose you operate a retail store and want to optimize your inventory management to improve cash flow and profitability. By monitoring your Inventory Turnover Ratio, you can assess how efficiently you’re managing your inventory.

Scenario: You sell $500,000 worth of inventory in a year, and your average inventory value is $100,000.

Calculation: Inventory Turnover Ratio = Cost of Goods Sold / Average Inventory Value Inventory Turnover Ratio = $500,000 / $100,000 Inventory Turnover Ratio = 5 times per year

Action: A high inventory turnover ratio indicates that you’re selling your inventory quickly, which is generally positive. However, it could also suggest stockouts or insufficient inventory levels. By analyzing this metric regularly, you can adjust your purchasing and inventory management strategies to optimize turnover while minimizing carrying costs.

Example 3: Employee Turnover Rate

Consider you’re a human resources manager concerned about retaining top talent and maintaining a productive workforce. By tracking your Employee Turnover Rate, you can identify trends and patterns in employee departures and take proactive measures to address retention issues.

Scenario: In a year, your company has 50 employees, and 10 employees leave the organization.

Calculation: Employee Turnover Rate = (Number of Employees Who Left / Total Number of Employees) x 100 Employee Turnover Rate = (10 / 50) x 100 Employee Turnover Rate = 20%

Action: A high employee turnover rate may indicate dissatisfaction, poor morale, or other organizational issues. By analyzing exit interviews, conducting employee surveys, and addressing underlying concerns, you can implement strategies to improve employee retention and foster a positive work environment.

Example 4: Website Conversion Rate

Suppose you operate an e-commerce website and want to optimize your conversion rate to increase sales and revenue. By monitoring your Website Conversion Rate, you can assess the effectiveness of your website design, content, and user experience in driving conversions.

Scenario: Out of 1,000 website visitors, 50 make a purchase.

Calculation: Website Conversion Rate = (Number of Conversions / Total Number of Visitors) x 100 Website Conversion Rate = (50 / 1000) x 100 Website Conversion Rate = 5%

Action: A low conversion rate may indicate issues with website usability, product offerings, or checkout process. By conducting A/B testing, improving website navigation, and optimizing product pages, you can enhance the user experience and increase conversion rates over time.

How to Implement Performance Measurement Systems?

Implementing performance measurement systems is essential for effectively tracking and analyzing key metrics to drive business success.

Selecting Tools and Software

Choosing the right tools and software is the foundation of a robust performance measurement system. There are various options available, ranging from simple spreadsheets to advanced business intelligence platforms. When selecting tools, consider factors such as:

  • Functionality: Ensure that the tools offer the features and capabilities necessary to track and analyze your chosen metrics effectively. Look for features such as customizable dashboards, data visualization tools, and integration with other systems.
  • Scalability: Choose tools that can scale with your business as it grows. Consider whether the tools can handle increased data volume and complexity over time without compromising performance.
  • Ease of Use: Select tools that are user-friendly and intuitive, as they will be used by employees at all levels of the organization. Complex tools may require extensive training and can hinder adoption among users.
  • Cost: Evaluate the cost of implementing and maintaining the tools, including any subscription fees, licensing costs, and implementation expenses. Choose tools that provide the best value for your budget.

Popular performance measurement tools include Tableau, Google Analytics, Microsoft Power BI, and Klipfolio. Additionally, many enterprise resource planning (ERP) systems offer built-in analytics modules for tracking key metrics.

Data Collection and Management

Effective data collection and management are essential for ensuring the accuracy and reliability of performance metrics. Establish standardized processes for collecting, storing, and organizing data to ensure consistency and integrity.

  • Data Sources: Identify the sources of data for each metric, whether it’s from internal systems (e.g., CRM, ERP) or external sources (e.g., market research, customer surveys). Integrate data sources where possible to streamline data collection processes.
  • Data Governance: Implement data governance policies and procedures to ensure data quality, security, and compliance with regulations such as GDPR and CCPA. Assign responsibilities for data management and establish protocols for data access and sharing.
  • Data Storage: Choose appropriate data storage solutions that provide scalability, reliability, and security. Consider whether to store data on-premises or in the cloud, taking into account factors such as data accessibility and disaster recovery.
  • Data Cleaning: Regularly clean and validate data to remove duplicates, errors, and inconsistencies. Use data cleaning tools and techniques to ensure data accuracy and reliability before analysis.

Establishing Baselines and Benchmarks

Establishing baselines and benchmarks is crucial for measuring progress and comparing performance against industry standards or competitors. Baselines represent the starting point for measuring performance, while benchmarks provide context by comparing performance against relevant peers or targets.

  • Baseline Identification: Determine the current performance levels for each metric based on historical data or industry norms. Establish baseline values against which future performance can be measured.
  • Benchmarking: Identify benchmarks for each metric by comparing your performance to industry peers, competitors, or best practices. Benchmarking provides insights into areas of strength and opportunities for improvement.
  • Setting Targets: Set realistic and achievable targets for each metric based on your business objectives, strategic goals, and benchmarking data. Targets provide clear goals for performance improvement and serve as benchmarks for progress tracking.

Ensuring Data Accuracy and Consistency

Maintaining data accuracy and consistency is critical for deriving meaningful insights and making informed decisions based on performance metrics. Implement measures to ensure data quality throughout the data lifecycle, from collection to analysis.

  • Data Validation: Implement validation checks and controls to ensure data accuracy at the point of entry. Validate data against predefined rules, formats, and thresholds to identify and correct errors in real-time.
  • Data Integration: Integrate data from multiple sources to create a single source of truth for performance metrics. Ensure data consistency by aligning definitions, units of measurement, and data formats across different systems and sources.
  • Data Auditing: Conduct regular audits of performance data to identify errors, anomalies, and inconsistencies. Perform data reconciliation and verification processes to ensure that data accurately reflects business operations and transactions.
  • Data Security: Implement robust data security measures to protect sensitive information and prevent unauthorized access or manipulation. Encrypt data during transmission and storage, restrict access to authorized users, and implement role-based access controls.

By implementing effective data governance practices, establishing baselines and benchmarks, and ensuring data accuracy and consistency, you can build a reliable performance measurement system that provides actionable insights for driving business success.

How to Analyze Performance Metrics?

Analyzing and interpreting performance data is a critical step in deriving actionable insights and making informed decisions to drive business success. We’ll explore various techniques and approaches for effectively analyzing and interpreting performance data to identify trends, patterns, anomalies, and root causes.

Trend Analysis

Trend analysis involves examining historical data to identify patterns or trends over time. By analyzing trends, you can gain insights into how performance metrics have evolved and identify potential future trajectories. Here’s how you can conduct trend analysis:

  • Data Visualization: Use charts, graphs, and dashboards to visualize performance data over time. Line charts, bar charts, and area charts are commonly used for trend analysis.
  • Time Series Analysis: Apply time series analysis techniques to identify seasonal patterns, cyclical trends, and long-term trends in performance data. Use methods such as moving averages, exponential smoothing, and trend lines to smooth out noise and highlight underlying patterns.
  • Statistical Analysis: Apply statistical methods to quantify trends and assess their significance. Calculate measures such as slope, correlation coefficients, and p-values to determine the strength and direction of trends.
  • Forecasting: Use historical data to forecast future performance trends and make predictions. Apply forecasting models such as ARIMA, exponential smoothing, or regression analysis to project future values based on historical patterns.

Comparative Analysis

Comparative analysis involves comparing performance metrics across different groups, periods, or entities to gain insights into relative performance and identify areas for improvement. Here’s how you can conduct comparative analysis:

  • Benchmarking: Compare your performance metrics against industry benchmarks, competitors, or best practices to assess your relative performance. Identify gaps and opportunities for improvement by benchmarking against top performers in your industry.
  • Peer Comparison: Compare performance metrics across different business units, teams, or departments within your organization to identify high-performing and underperforming areas. Analyze differences in performance and explore potential reasons for variations.
  • Time Period Comparison: Compare performance metrics between different time periods (e.g., quarters, years) to assess changes over time. Identify trends, seasonal variations, and areas of improvement by comparing performance across different time periods.

Identifying Patterns and Anomalies

Identifying patterns and anomalies involves examining performance data to identify recurring patterns, outliers, or deviations from expected norms. Here’s how you can identify patterns and anomalies:

  • Data Visualization: Use data visualization techniques to identify patterns and anomalies visually. Look for clusters, trends, or irregularities in the data that may indicate underlying patterns or anomalies.
  • Statistical Analysis: Apply statistical methods to detect anomalies and outliers in performance data. Calculate measures such as standard deviation, z-scores, and percentile ranks to identify data points that deviate significantly from the mean or expected values.
  • Machine Learning: Use machine learning algorithms such as clustering, classification, or anomaly detection to automatically identify patterns and anomalies in large datasets. Train machine learning models on historical data to detect unusual patterns or outliers in real-time.

Root Cause Analysis

Root cause analysis involves identifying the underlying causes or drivers of performance issues or anomalies. By understanding the root causes, you can address underlying problems and implement effective solutions to improve performance. Here’s how you can conduct root cause analysis:

  • Cause-and-Effect Analysis: Use techniques such as fishbone diagrams (Ishikawa diagrams) or causal loop diagrams to visualize the relationships between different factors and identify potential root causes of performance issues.
  • Data Driven Analysis: Analyze performance data to identify correlations, relationships, or causal factors that may be contributing to performance issues. Use statistical methods such as regression analysis or correlation analysis to quantify relationships between variables.
  • Qualitative Analysis: Conduct interviews, surveys, or focus groups with stakeholders to gather qualitative insights into potential root causes of performance issues. Use qualitative data to complement quantitative analysis and provide deeper insights into underlying problems.
  • Iterative Analysis: Perform iterative analysis to validate and refine hypotheses about root causes. Test potential solutions, monitor their impact on performance metrics, and adjust strategies based on feedback and results.

By conducting trend analysis, comparative analysis, identifying patterns and anomalies, and conducting root cause analysis, you can gain deeper insights into performance data and make data-driven decisions to improve business outcomes. These analytical techniques provide valuable insights for optimizing processes, identifying opportunities, and addressing challenges in your organization.

How to Drive Performance Improvement?

Driving performance improvement is a dynamic process that involves setting actionable goals, implementing strategic action plans, monitoring progress, and continuously refining strategies to achieve desired outcomes.

Setting SMART Goals

Setting SMART (Specific, Measurable, Achievable, Relevant, Time-bound) goals is the first step in driving performance improvement. SMART goals provide clarity, focus, and accountability, guiding efforts towards specific objectives. Here’s how you can set SMART goals:

  • Specific: Define clear and specific objectives that outline what you want to achieve. Avoid vague or ambiguous goals and ensure that they are well-defined and unambiguous.
  • Measurable: Establish measurable criteria for evaluating progress and success. Define metrics and key performance indicators (KPIs) that allow you to track and quantify progress towards your goals.
  • Achievable: Ensure that your goals are realistic and attainable within the given resources and constraints. Set challenging but achievable targets that stretch your capabilities without being overly ambitious.
  • Relevant: Align your goals with your organization’s mission, vision, and strategic priorities. Ensure that your goals are relevant to your business objectives and contribute to overall success.
  • Time-bound: Set specific timeframes or deadlines for achieving your goals. Establish clear milestones and timelines to track progress and maintain momentum.

Action Planning and Implementation

Once SMART goals are established, the next step is to develop action plans and implement strategic initiatives to drive performance improvement. Action planning involves identifying specific actions, allocating resources, and assigning responsibilities to achieve goals. Here’s how you can develop and implement action plans:

  • Identify Key Initiatives: Break down goals into actionable initiatives or projects that contribute to goal achievement. Prioritize initiatives based on their impact, feasibility, and alignment with strategic objectives.
  • Allocate Resources: Determine the resources (e.g., budget, manpower, technology) required to execute initiatives successfully. Ensure that resources are allocated effectively to support implementation efforts.
  • Assign Responsibilities: Assign clear roles and responsibilities to team members or stakeholders involved in executing action plans. Clarify expectations, provide support, and empower individuals to take ownership of their roles.
  • Develop Timelines: Create detailed timelines and project schedules outlining the sequence of activities and deadlines for each initiative. Establish milestones and checkpoints to track progress and ensure accountability.

Monitoring Progress and Adjustments

Monitoring progress is essential for tracking performance against goals and identifying any deviations or obstacles along the way. Regular monitoring allows you to make timely adjustments and course corrections to stay on track towards achieving your objectives. Here’s how you can monitor progress and make adjustments:

  • Track Key Metrics: Continuously monitor key performance metrics and KPIs to assess progress towards goals. Use performance dashboards, reports, and analytics tools to track real-time data and identify trends or patterns.
  • Conduct Reviews: Schedule regular reviews and progress updates to evaluate the effectiveness of action plans and initiatives. Review performance against targets, discuss challenges, and identify opportunities for improvement.
  • Identify Issues: Identify any issues, bottlenecks, or barriers that may be hindering progress towards goals. Conduct root cause analysis to understand underlying causes and develop strategies to address them.
  • Make Adjustments: Based on performance insights and feedback, make necessary adjustments to action plans, resource allocation, or timelines. Adapt strategies and tactics to overcome challenges and capitalize on opportunities.

Continuous Improvement Strategies

Fostering a culture of continuous improvement is essential for driving sustained performance improvement over time. Encourage innovation, collaboration, and learning within your organization to continually optimize processes, products, and services. Here are some strategies for promoting continuous improvement:

  • Encourage Feedback: Solicit feedback from employees, customers, and stakeholders to identify areas for improvement and innovation. Create channels for open communication and encourage a culture of constructive feedback.
  • Promote Learning: Invest in employee training and development programs to enhance skills, knowledge, and capabilities. Provide opportunities for cross-functional collaboration, peer learning, and skill-sharing.
  • Reward Innovation: Recognize and reward individuals or teams that contribute to innovation and continuous improvement. Celebrate successes, share best practices, and showcase examples of successful initiatives.
  • Iterate and Iterate: Embrace an iterative approach to improvement, where small, incremental changes are made continuously over time. Experiment with new ideas, measure their impact, and iterate based on feedback and results.

By setting SMART goals, developing actionable action plans, monitoring progress, and fostering a culture of continuous improvement, you can drive performance improvement and achieve sustainable business success. Embrace a proactive mindset, adapt to changing circumstances, and continuously strive for excellence in all aspects of your organization.

How to Communicate Performance Metrics Effectively?

Effectively communicating performance metrics is crucial for ensuring alignment, fostering transparency, and driving accountability within your organization.

Reporting Formats and Frequency

Choosing the right reporting formats and frequency is essential for ensuring that performance metrics are communicated in a clear, concise, and timely manner. Consider the preferences and needs of different stakeholders when determining reporting formats and frequency.

  • Tailored Reports: Customize reports to meet the specific needs and interests of different stakeholders. Tailor the content, format, and level of detail to ensure relevance and engagement.
  • Visual Formats: Use visual formats such as charts, graphs, and infographics to present complex data in a more accessible and understandable way. Visualizations can help stakeholders grasp key insights quickly and easily.
  • Regular Updates: Establish regular reporting schedules to provide stakeholders with consistent updates on performance metrics. Consider the frequency of reporting based on the urgency and importance of the metrics being communicated.

Stakeholder Engagement and Alignment

Engaging stakeholders and ensuring alignment with organizational goals is essential for driving accountability and ownership of performance metrics. Foster a culture of transparency, collaboration, and accountability by:

  • Stakeholder Involvement: Involve key stakeholders in the development and review of performance metrics to ensure buy-in and ownership. Solicit feedback and input to tailor metrics to meet stakeholders’ needs and priorities.
  • Alignment with Goals: Communicate how performance metrics align with broader organizational goals and objectives. Help stakeholders understand the significance of the metrics and how their contributions contribute to overall success.
  • Two-Way Communication: Encourage open dialogue and two-way communication between stakeholders and performance measurement teams. Provide opportunities for stakeholders to ask questions, share insights, and provide feedback on performance metrics.

Visualizations and Dashboards

Visualizations and dashboards are powerful tools for presenting performance metrics in a clear, intuitive, and actionable manner. Use visualizations and dashboards to:

  • Highlight Key Insights: Use visualizations to highlight key insights and trends in performance data. Focus on the most relevant and impactful metrics to ensure clarity and effectiveness.
  • Interactive Dashboards: Develop interactive dashboards that allow stakeholders to explore performance metrics dynamically. Provide options for filtering, drilling down, and comparing data to facilitate deeper analysis and understanding.
  • Real-Time Updates: Leverage technology to provide real-time updates and alerts on performance metrics through dashboards. Enable stakeholders to access up-to-date information and track progress in real-time.

Interpreting and Presenting Insights

Interpreting and presenting insights effectively is critical for ensuring that performance metrics are understood and acted upon by stakeholders. When interpreting and presenting insights:

  • Provide Context: Provide context and background information to help stakeholders understand the significance of performance metrics. Explain the methodology, assumptions, and limitations of the data to ensure clarity and accuracy.
  • Focus on Actionable Insights: Highlight actionable insights and recommendations based on performance metrics. Identify opportunities for improvement, areas of concern, and potential strategies for addressing performance gaps.
  • Use Plain Language: Communicate insights in clear, concise, and jargon-free language to ensure accessibility and understanding by all stakeholders. Avoid technical terms and acronyms that may be unfamiliar to non-experts.
  • Tell a Story: Structure presentations and reports in a narrative format that tells a compelling story about performance trends, challenges, and opportunities. Use anecdotes, examples, and case studies to illustrate key points and engage stakeholders.

Overcoming Challenges in Performance Measurement

Overcoming challenges in performance measurement requires proactive management and strategic solutions. Common challenges include:

  • Data Quality: Ensure data accuracy, completeness, and consistency by implementing robust data governance processes and regular quality checks.
  • Lack of Alignment: Foster alignment between performance metrics and organizational goals by engaging stakeholders, providing clarity on objectives, and reinforcing the importance of measurement.
  • Resistance to Change: Address resistance to performance measurement by fostering a culture of transparency, communication, and collaboration. Provide training and support to help employees understand the value of measurement and how it supports their work.
  • Complexity: Simplify performance measurement processes and metrics where possible to reduce complexity and increase accessibility. Focus on the most critical metrics that align with strategic objectives and drive meaningful action.
  • Technology Limitations: Invest in technology solutions that support performance measurement, such as data analytics platforms, visualization tools, and dashboard software. Ensure that systems are user-friendly, scalable, and capable of integrating data from multiple sources.

By addressing these challenges proactively and implementing effective strategies for communicating performance metrics, organizations can foster greater transparency, alignment, and accountability, driving continuous improvement and achieving business success.

Conclusion

Mastering performance metrics is essential for any business looking to thrive in today’s competitive landscape. By leveraging the right metrics, organizations can gain valuable insights into their performance, identify areas for improvement, and make data-driven decisions that drive growth and success. From financial metrics like revenue and profitability to operational metrics like efficiency and productivity, performance metrics provide a comprehensive view of your business’s health and trajectory. By implementing effective measurement systems, communicating metrics clearly, and fostering a culture of continuous improvement, businesses can unlock their full potential and achieve their strategic objectives.

In the ever-evolving business world, the journey towards success is paved with data-driven insights and informed decision-making. By embracing performance metrics as a guiding beacon, businesses can navigate challenges, seize opportunities, and stay ahead of the curve. With the right tools, strategies, and mindset, performance metrics become more than just numbers – they become the catalyst for innovation, growth, and sustainable success.

Get Started With a Prebuilt Template!

Looking to streamline your business financial modeling process with a prebuilt customizable template? Say goodbye to the hassle of building a financial model from scratch and get started right away with one of our premium templates.

  • Save time with no need to create a financial model from scratch.
  • Reduce errors with prebuilt formulas and calculations.
  • Customize to your needs by adding/deleting sections and adjusting formulas.
  • Automatically calculate key metrics for valuable insights.
  • Make informed decisions about your strategy and goals with a clear picture of your business performance and financial health.