Are you seeking a practical approach to making informed decisions, whether it’s optimizing business operations, allocating resources efficiently, or maximizing personal satisfaction? Look no further than this guide on marginal analysis.
Delve into the world of incremental decision-making as we explore the concepts, applications, and tools that empower you to evaluate the impact of small changes and make choices that align with your objectives. Discover how marginal analysis can transform your decision-making process and bring clarity to complex scenarios across a wide range of domains.
What is Marginal Analysis?
Marginal analysis is a decision-making tool used to evaluate the incremental effects of small changes or adjustments in various scenarios. It involves assessing the additional benefits and costs that result from making one more unit of a particular decision or choice. Marginal analysis is employed across multiple fields, from economics and business to personal finance and resource allocation, to make informed decisions and optimize outcomes.
Purpose of Marginal Analysis
The primary purpose of marginal analysis is to help individuals, businesses, and policymakers make rational and data-driven decisions by considering the following:
- Optimization: Marginal analysis aims to identify the level at which incremental benefits equal incremental costs, maximizing the desired outcome. This can apply to profit, satisfaction, resource utilization, or any other objective.
- Efficiency: By assessing marginal values, you can identify opportunities to allocate resources more efficiently, leading to improved resource utilization and cost savings.
- Trade-offs: Marginal analysis helps reveal trade-offs between different options. It allows you to compare the benefits of one choice against the costs of another, facilitating decision-making under scarcity or constraints.
- Sensitivity: Understanding the sensitivity of decisions to small changes in variables or parameters helps assess the robustness of a chosen course of action in the face of uncertainty.
- Continuous Improvement: Marginal analysis is a dynamic process that encourages ongoing evaluation and adjustment of decisions as circumstances change, ensuring that choices remain optimal over time.
Importance in Decision-Making
Marginal analysis plays a pivotal role in decision-making across various domains due to its ability to quantify and compare the incremental effects of choices. Its importance is underscored by the following factors:
- Precision: Marginal analysis provides a quantitative framework for decision-making, offering precise insights into how incremental changes impact outcomes.
- Cost-Benefit Assessment: It enables a systematic cost-benefit assessment, helping decision-makers determine whether a choice is economically viable or efficient.
- Resource Allocation: In resource allocation, marginal analysis helps optimize the allocation of limited resources, such as labor, capital, or time, to achieve the desired goals.
- Profit Maximization: In business and economics, marginal analysis is instrumental in profit maximization, helping companies determine the optimal level of production and pricing.
- Utility Maximization: In personal finance and consumer choice, it assists individuals in allocating resources to maximize their overall satisfaction or utility.
- Policy Development: Policymakers use marginal analysis to design and evaluate policies, considering the trade-offs between costs and benefits for society.
- Risk Management: Marginal analysis helps assess risks and uncertainties by exploring how variations in input parameters affect outcomes.
Marginal analysis is a versatile and powerful tool that empowers decision-makers to make well-informed choices, whether in the context of business, economics, personal finance, or resource management. Its precision, ability to reveal trade-offs, and adaptability make it a fundamental concept in rational decision-making.
Key Concepts in Marginal Analysis
Marginal analysis is built upon a set of fundamental concepts that serve as the foundation for making informed decisions. Each of these concepts plays a pivotal role in understanding how incremental changes can impact various scenarios. Let’s delve deeper into these key concepts:
Marginal Cost (MC)
Marginal Cost (MC) is a critical concept in economics and business. It represents the additional cost incurred when producing one more unit of a product or service. MC is essential for decision-making related to production levels and pricing strategies.
For example, consider a smartphone manufacturer. If the company is producing 1,000 phones and decides to produce one more, the marginal cost would account for the additional expenses, such as the cost of materials, labor, and energy, associated with that extra phone.
MC = Change in Total Cost / Change in Quantity
Understanding MC helps businesses optimize their production levels. When MC is lower than the selling price (marginal revenue), it’s often advantageous to increase production. Conversely, if MC exceeds marginal revenue, it may be more profitable to reduce production.
Marginal Revenue (MR)
Marginal Revenue (MR) represents the additional revenue earned from selling one more unit of a product or service. In other words, it quantifies how much extra income a business generates when it produces and sells an additional unit.
For instance, if a bookstore sells 1,000 copies of a book and decides to sell one more, the marginal revenue would account for the revenue generated from that additional sale.
MR = Change in Total Revenue / Change in Quantity Sold
MR is a crucial concept for businesses aiming to maximize profits. When MR exceeds MC, producing more units is profitable. Conversely, if MC surpasses MR, it’s more beneficial to reduce production to optimize profitability.
Marginal Utility (MU)
Marginal Utility (MU) is a concept often associated with consumer choice and satisfaction. It measures the additional satisfaction or benefit gained from consuming one more unit of a good or service.
Imagine you’re eating a slice of pizza. The first few bites provide substantial satisfaction, but as you continue eating, the additional satisfaction from each bite decreases. MU helps explain why people make consumption choices based on maximizing their overall utility or well-being.
MU = Change in Utility / Change in Consumption
Understanding MU allows individuals and businesses to make decisions that maximize overall satisfaction. It can help you determine how to allocate your resources efficiently to achieve the greatest level of well-being.
Marginal Productivity (MP)
Marginal Productivity (MP) is a critical concept in resource allocation and production. It assesses the additional output or production achieved by employing one more unit of a resource, such as labor, capital, or machinery.
For instance, in a manufacturing plant, if an additional worker is hired, the marginal productivity would measure the increase in production resulting from that additional worker’s efforts.
MP = Change in Output / Change in Resource Input
MP is essential for optimizing resource allocation and determining the most efficient level of resource utilization. Businesses can use MP to decide how many workers to employ or how much capital to invest in a project.
Marginal Rate of Substitution (MRS)
Marginal Rate of Substitution (MRS) is a concept primarily used in consumer choice theory. It quantifies how much of one good a consumer is willing to give up to obtain a bit more of another good while keeping their level of satisfaction constant.
Imagine you have a choice between consuming apples and oranges. MRS helps you understand how many apples you would be willing to give up to have one more orange while maintaining the same level of satisfaction.
MRS = Change in Quantity of Good A / Change in Quantity of Good B
MRS is crucial for understanding how individuals make choices when faced with trade-offs. It helps explain preferences and substitution patterns in consumer decision-making.
These key concepts in marginal analysis form the basis for making rational and informed decisions across various fields, from economics and business to personal finance and beyond. Understanding them empowers you to evaluate the incremental impacts of your choices and optimize your decision-making process.
Marginal Analysis Applications
Marginal analysis is a versatile decision-making tool that finds applications in a wide array of fields. It enables you to make well-informed choices by assessing the incremental effects of various decisions. Here are some notable areas where marginal analysis plays a crucial role:
Business and Economics
In the realm of Business and Economics, marginal analysis serves as a guiding principle for optimizing operations and maximizing profitability. Here’s how it applies:
- Production and Pricing Decisions: Businesses use marginal analysis to determine the optimal production level. By comparing marginal cost (MC) with marginal revenue (MR), they can decide whether to increase or decrease production. When MR exceeds MC, increasing production is profitable, but when MC surpasses MR, it’s more beneficial to reduce output.Example: A car manufacturer uses marginal analysis to decide how many additional vehicles to produce, taking into account the cost of materials, labor, and potential sales revenue.
- Price Optimization: In pricing strategies, businesses consider how changes in pricing affect their profits. Marginal analysis helps in setting prices that maximize revenue. The ideal pricing point is where marginal cost equals marginal revenue.Example: An airline adjusts ticket prices based on marginal analysis to ensure they fill seats without losing revenue.
- Investment Decisions: When evaluating investment opportunities, companies consider the expected marginal revenue generated by the investment versus the marginal cost. This helps them prioritize projects that offer the highest returns.Example: A tech company decides whether to invest in developing a new product by comparing the expected revenue with the costs involved.
Personal Finance
In the realm of Personal Finance, marginal analysis assists individuals in making sound financial decisions, allocating resources efficiently, and achieving their financial goals. Here’s how it applies:
- Budgeting: Marginal analysis helps you make choices about spending and saving. By assessing the marginal utility (MU) of various expenses, you can allocate your budget effectively to maximize your overall satisfaction.Example: You decide how much to spend on entertainment versus savings by considering the additional happiness gained from each dollar spent.
- Investment Choices: When building an investment portfolio, understanding the marginal returns of different assets is crucial. You aim to balance risk and reward while optimizing your returns.Example: You analyze the expected returns of stocks, bonds, and other assets to diversify your investment portfolio effectively.
- Debt Management: Marginal analysis helps you decide whether it’s worthwhile to take on additional debt, such as a mortgage or student loans. You weigh the cost of borrowing (interest rates) against the potential benefits.Example: You evaluate the impact of taking a mortgage on your monthly budget and overall financial well-being.
Environmental Decision-Making
In the realm of Environmental Decision-Making, marginal analysis assists policymakers and environmentalists in addressing complex ecological challenges. Here’s how it applies:
- Resource Allocation: Marginal analysis helps determine the optimal allocation of resources to minimize environmental impact. It assesses the additional costs and benefits of conservation efforts or pollution reduction.Example: A conservation agency uses marginal analysis to decide how many acres of land to protect based on the ecological value of each additional acre.
- Pollution Control: Governments and industries use marginal analysis to set pollution control standards. It considers the trade-off between the cost of reducing pollution (marginal cost) and the benefits in terms of environmental quality.Example: A manufacturing plant assesses the costs and benefits of installing pollution control technology to meet environmental regulations.
Healthcare and Medicine
In the realm of Healthcare and Medicine, marginal analysis aids in resource allocation, treatment choices, and healthcare policies. Here’s how it applies:
- Resource Allocation: Hospitals and healthcare systems use marginal analysis to determine how many additional resources, such as doctors, nurses, or hospital beds, to allocate based on patient needs and budget constraints.Example: A hospital assesses whether hiring additional nurses would lead to better patient care and justify the costs.
- Treatment Decisions: Marginal analysis helps healthcare providers and patients make decisions about treatments and interventions. It considers the incremental benefits and risks of medical procedures.Example: A physician discusses with a patient whether the potential benefits of a particular treatment outweigh the risks and costs.
- Healthcare Policy: Policymakers use marginal analysis to design healthcare policies that balance access to care, quality, and costs. It helps determine the most cost-effective interventions and services.Example: A government evaluates the impact of subsidizing certain healthcare services to improve public health outcomes.
In each of these fields, marginal analysis provides a systematic approach to decision-making, allowing for a more precise assessment of the consequences of various choices. By understanding how incremental changes affect outcomes, individuals, businesses, and policymakers can make better-informed decisions and allocate resources more efficiently.
How to Perform Marginal Analysis?
To effectively utilize marginal analysis as a decision-making tool, it’s essential to follow a structured process. These steps will guide you through the entire process, from gathering data to making informed decisions based on marginal values.
Data Collection
Data collection is the first crucial step in performing marginal analysis. To assess the impact of incremental changes, you need accurate and relevant data. Here’s how you can approach this stage:
- Identify the Decision: Clearly define the decision or scenario you want to analyze. Whether it’s related to production, pricing, resource allocation, or personal finance, specifying the decision is the starting point.
- Gather Historical Data: Collect historical data related to the decision at hand. This data may include information on costs, revenues, consumer preferences, resource inputs, or any other relevant variables.
- Consider Timeframes: Determine the time period for which you want to analyze the decision. Depending on your goal, you may assess short-term or long-term effects.
- Include All Relevant Factors: Ensure that you include all factors that could impact the decision. For instance, in business, consider both variable and fixed costs. In personal finance, account for all income and expenses.
How to Calculate Marginal Values?
Once you’ve collected the necessary data, the next step is to calculate the marginal values associated with your decision. These values will provide insights into how changes impact outcomes:
- Marginal Cost (MC): Calculate the additional cost incurred when making a small change. Divide the change in total cost by the change in quantity:MC = Change in Total Cost / Change in Quantity
- Marginal Revenue (MR): Calculate the additional revenue generated from the change. Divide the change in total revenue by the change in quantity sold:MR = Change in Total Revenue / Change in Quantity Sold
- Marginal Utility (MU): Quantify the additional satisfaction or benefit gained from the change. Divide the change in utility by the change in consumption:MU = Change in Utility / Change in Consumption
- Marginal Productivity (MP): Assess the additional output or production achieved by making the change. Divide the change in output by the change in resource input:MP = Change in Output / Change in Resource Input
- Marginal Rate of Substitution (MRS): Calculate the rate at which one good can be substituted for another while maintaining the same level of satisfaction. Divide the change in the quantity of one good by the change in the quantity of another good:MRS = Change in Quantity of Good A / Change in Quantity of Good B
Comparing Marginal Values
With your marginal values calculated, the next step is to compare them to gain valuable insights into the decision at hand:
- MC vs. MR: In business and economics, compare the marginal cost (MC) to the marginal revenue (MR). If MR > MC, it’s typically profitable to increase production or quantity. Conversely, if MC > MR, reducing production or quantity may be more advantageous.
- MU: In personal finance, assess the marginal utility (MU) of different expenditures. Allocate resources to maximize overall satisfaction by spending more on items with higher MU.
- MP: In resource allocation scenarios, compare the marginal productivity (MP) of various resources. Allocate resources to tasks where MP is the highest to optimize production or output.
- MRS: In consumer choice situations, compare the marginal rate of substitution (MRS) to understand how consumers trade one good for another while maintaining satisfaction. This helps analyze preferences and substitution patterns.
Decision-Making Based on Marginal Analysis
The final step in performing marginal analysis involves decision-making based on the insights gained from the previous steps. Here’s how you can use marginal values to make informed choices:
- Optimize Decisions: Use the information from comparing marginal values to optimize your decision. Make adjustments that maximize benefits or satisfaction while minimizing costs or effort.
- Consider Constraints: Keep in mind any constraints, such as budget limitations, resource availability, or time constraints, when making your final decision.
- Monitor and Iterate: After implementing your decision, continue to monitor the marginal values. Periodically revisit your analysis to ensure that your chosen course of action remains optimal, especially in dynamic environments.
By following these steps, you can harness the power of marginal analysis to make rational and data-driven decisions in various domains, ranging from business and economics to personal finance and resource allocation.
Marginal Analysis Tools and Techniques
To perform effective marginal analysis, you can leverage various tools and techniques that facilitate data analysis and decision-making. These tools provide different perspectives and insights into the incremental effects of your choices. Let’s explore these tools and techniques in detail:
Graphical Representations
Graphical representations are visual tools that help you understand and illustrate the relationship between variables in marginal analysis. They offer a clear and intuitive way to analyze data and make decisions.
- Marginal Cost (MC) and Marginal Revenue (MR) Graphs: In economics and business, MC and MR curves are commonly plotted on the same graph. The intersection point of these curves indicates the optimal production level where MR equals MC, maximizing profit.
- Indifference Curves: In consumer choice theory, indifference curves depict combinations of goods that provide the same level of satisfaction (utility) to a consumer. They help analyze how individuals make trade-offs between different goods.
- Production Possibility Frontier (PPF): PPF graphs illustrate the maximum output combinations a producer can achieve with given resources. They are valuable for resource allocation decisions and highlight opportunity costs.
Mathematical Formulas
Mathematical formulas play a central role in calculating and analyzing marginal values. These formulas provide precise quantitative insights into the impact of incremental changes.
- Marginal Cost (MC): Calculated as the change in total cost divided by the change in quantity produced. Mathematically, it can be expressed as:MC = ΔTotal Cost / ΔQuantity
- Marginal Revenue (MR): Calculated as the change in total revenue divided by the change in quantity sold. The formula for MR is:MR = ΔTotal Revenue / ΔQuantity Sold
- Marginal Utility (MU): Calculated as the change in utility divided by the change in consumption. The mathematical expression for MU is:MU = ΔUtility / ΔConsumption
- Marginal Productivity (MP): MP is computed as the change in output divided by the change in resource input. The formula for MP is:MP = ΔOutput / ΔResource Input
- Marginal Rate of Substitution (MRS): MRS is determined by dividing the change in the quantity of one good by the change in the quantity of another good:MRS = ΔGood A / ΔGood B
Spreadsheet Applications
Spreadsheet applications, such as Microsoft Excel or Google Sheets, are invaluable tools for performing marginal analysis. They provide a structured environment for data manipulation, calculation, and visualization.
- Data Input and Storage: Spreadsheets allow you to input and organize your data systematically. You can create columns for variables like quantity, cost, revenue, utility, or resource input.
- Formulas and Calculations: Excel and similar programs make it easy to perform calculations using built-in functions. You can create formulas to calculate MC, MR, MU, MP, and MRS efficiently.
- Graphs and Charts: Spreadsheet applications offer a range of charting options. You can generate MC-MR graphs, indifference curves, PPFs, and other visual representations to aid in decision-making.
- Scenario Analysis: Spreadsheets are ideal for conducting sensitivity analysis, where you explore how changes in key variables affect outcomes. By adjusting inputs, you can assess the robustness of your decisions.
Sensitivity Analysis
Sensitivity analysis is a technique used to assess how variations in input parameters impact the results of a decision or analysis. It helps you understand the robustness of your decisions in the face of uncertainty.
- One-Way Sensitivity Analysis: In this approach, you vary one input parameter while keeping others constant to observe how it affects the outcome. It helps identify which variables have the most significant impact on your decision.
- Two-Way Sensitivity Analysis: Two-way sensitivity analysis simultaneously varies two input parameters to assess their combined effect on the results. It’s useful for exploring interactions between variables.
- Scenario Analysis: Scenario analysis involves examining multiple possible scenarios or outcomes by adjusting multiple input parameters simultaneously. It helps you consider a range of potential situations.
- Monte Carlo Simulation: Monte Carlo simulation involves running thousands of simulations using random variations in input parameters. It provides a distribution of potential outcomes, offering a more comprehensive view of uncertainty.
By incorporating these tools and techniques into your marginal analysis process, you can enhance your ability to make informed decisions, visualize data effectively, and account for uncertainty and variability in your analyses. These tools are valuable assets across various domains, from economics and business to personal finance and resource management.
Marginal Analysis Examples
To gain a deeper understanding of how marginal analysis is applied in real-world scenarios, let’s explore a range of examples that span from business and economics to personal finance. In each case, we will delve into the calculations and decision-making processes involved.
Business Example: Production Optimization
Scenario: A manufacturing company produces smartphones and wants to determine the optimal production level to maximize profit. The company currently produces 10,000 smartphones at a cost of $250 per unit and sells them for $400 each.
Calculations:
- Marginal Cost (MC): MC is the additional cost of producing one more smartphone. Suppose increasing production to 10,001 units incurs an extra $220 in expenses. Therefore, MC = $220.
- Marginal Revenue (MR): MR represents the additional revenue generated by selling one more smartphone. If selling 10,001 units brings in an extra $400, MR = $400.
Decision: Since MR ($400) exceeds MC ($220), it is profitable for the company to increase production by one unit. This continues until MC equals MR, indicating the point of profit maximization. The company should produce and sell more smartphones until MC = MR.
Economics Example: Consumer Choice
Scenario: A consumer is deciding between purchasing a laptop or a tablet. The consumer has $1,000 to spend and derives utility (satisfaction) from each product. The laptop costs $800 and provides 50 units of utility, while the tablet costs $400 and provides 30 units of utility.
Calculations:
- Marginal Utility (MU): MU measures the additional satisfaction gained from consuming one more unit of a good. For the laptop, MU = (50 units of utility – 0 units of utility) / ($800 – $0) = 0.0625 utility per dollar. For the tablet, MU = (30 units of utility – 0 units of utility) / ($400 – $0) = 0.075 utility per dollar.
Decision: The consumer should spend their budget in a way that maximizes total utility. Since the MU for the tablet is higher (0.075 utility per dollar) than the MU for the laptop (0.0625 utility per dollar), the consumer should purchase the tablet first to maximize satisfaction.
Personal Finance Example: Investment Portfolio
Scenario: An investor is deciding how to allocate $10,000 across two investment options: stocks and bonds. Stocks have an expected annual return of 8%, while bonds offer a return of 4%. The investor seeks to maximize their annual return.
Calculations:
- Marginal Return (MR): MR in this context is the additional return earned by investing one more dollar in a particular asset. For stocks, MR = 8%, and for bonds, MR = 4%.
Decision: To maximize annual return, the investor should allocate more funds to the asset with the higher MR. In this case, they should invest more in stocks because the marginal return is higher (8%) compared to bonds (4%).
Finance Example: Loan Repayment Strategy
Scenario: You have a $10,000 loan with a 5% interest rate, and you’re considering whether to make an extra payment of $1,000 now or invest that $1,000 in a savings account with a 3% annual interest rate.
Calculations:
- Marginal Cost (MC): MC in this case is the additional interest cost incurred by not paying down the loan. If you don’t make the extra payment, the additional interest cost would be 5% of $1,000, which is $50.
- Marginal Benefit (MB): MB represents the additional interest earned by investing the $1,000 in the savings account. At a 3% annual interest rate, the additional interest earned in one year would be 3% of $1,000, which is $30.
Decision: Since MC ($50) exceeds MB ($30), it’s financially prudent to make the extra loan payment of $1,000. This decision reduces the overall cost of the loan and is a more financially beneficial choice.
These examples illustrate how marginal analysis can guide decisions across various domains, providing a systematic way to assess incremental benefits and costs. By calculating and comparing marginal values, individuals and businesses can make informed choices that maximize their objectives, whether it’s profit, satisfaction, return on investment, or cost savings.
Tips for Effective Marginal Analysis
To overcome the limitations and challenges of marginal analysis and use it effectively:
- Choose the Right Metrics: Select the most relevant marginal values for your specific decision. Different decisions may require a focus on MC, MR, MU, MP, or MRS.
- Consider the Time Horizon: Assess whether your decision has short-term or long-term implications. Some decisions may have different marginal effects over time.
- Interpret Results Holistically: Don’t rely solely on marginal values; consider the broader context. Marginal analysis should complement qualitative considerations and expert judgment.
- Iterative Analysis: Recognize that decisions may need adjustment over time. Continuously monitor and evaluate the marginal effects of your choices to adapt to changing circumstances.
- Scenario Planning: Conduct scenario analysis to explore various potential outcomes and assess the robustness of your decisions under different conditions.
- Account for Risk: Incorporate risk analysis into your marginal analysis to understand the potential variability in outcomes. Consider the impact of uncertainties and unexpected events.
- Consult Experts: In complex scenarios, seek input from domain experts who can provide valuable insights and help validate your marginal analysis.
- Ethical Considerations: In sensitive areas such as healthcare or environmental decision-making, ensure that ethical considerations are an integral part of your analysis. Balance efficiency with fairness and social responsibility.
By applying these tips and recognizing the limitations, you can harness the power of marginal analysis while making more informed, well-rounded decisions that consider both quantitative and qualitative factors. Marginal analysis is a valuable tool when used judiciously and in conjunction with a thoughtful understanding of the decision context.
Marginal Analysis Challenges and Limitations
Marginal analysis is a powerful tool, but it’s not without its limitations and challenges. Understanding these limitations is crucial for using marginal analysis effectively:
- Simplifying Assumptions: Marginal analysis often relies on simplifying assumptions that may not hold true in complex real-world scenarios. For example, it assumes constant marginal values, which may not be accurate in dynamic environments.
- Data Accuracy: The accuracy of marginal analysis heavily depends on the quality of the data used. Inaccurate or incomplete data can lead to flawed conclusions and decisions.
- Causality vs. Correlation: Marginal analysis identifies relationships between variables but doesn’t always establish causality. It’s essential to consider other factors that may influence outcomes.
- Diminishing Returns: Marginal analysis assumes diminishing returns, which means that the incremental benefit decreases as you make more changes. In some cases, this assumption may not hold, leading to inaccurate predictions.
- Subjectivity: Marginal utility and marginal rate of substitution can be subjective, varying from person to person. People may have different preferences and tolerance for risk, making it challenging to generalize results.
- Real-World Complexity: Real-world decisions often involve multiple variables and constraints that can complicate marginal analysis. It may be challenging to model all relevant factors accurately.
- Ethical Considerations: In some cases, optimizing decisions based solely on marginal values may raise ethical concerns. For example, in healthcare, decisions should consider fairness and equity, not just efficiency.
Conclusion
Marginal analysis serves as your compass for making better decisions. It helps you weigh the pros and cons of incremental changes, ensuring that each choice aligns with your goals. From business strategies to personal finances, it’s a valuable tool for optimizing outcomes. So, embrace the power of marginal analysis and navigate the path to smarter decision-making.
Remember, in the realm of choices, the journey is smoother when guided by the principles of marginal analysis. By understanding the incremental impacts of your decisions, you can steer towards a future filled with optimized outcomes and success.
Get Started With a Prebuilt Template!
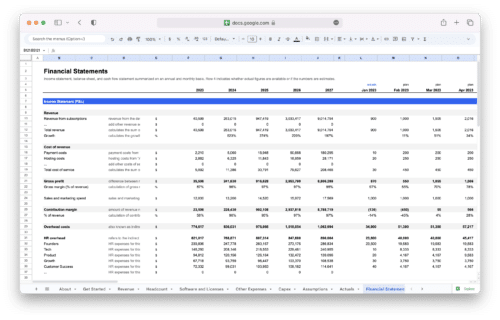
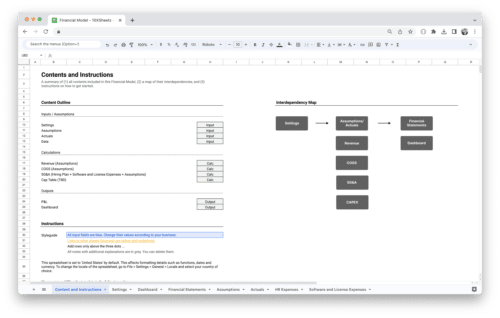
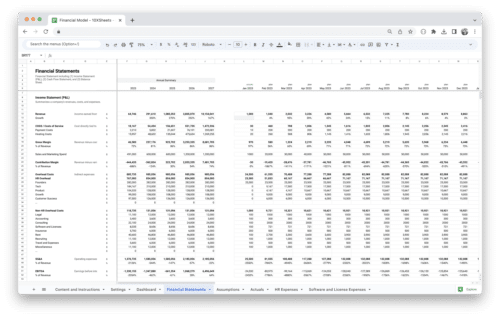
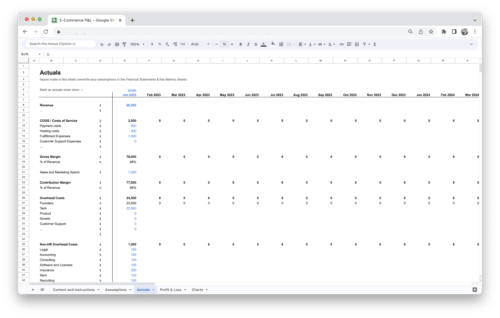
Looking to streamline your business financial modeling process with a prebuilt customizable template? Say goodbye to the hassle of building a financial model from scratch and get started right away with one of our premium templates.
- Save time with no need to create a financial model from scratch.
- Reduce errors with prebuilt formulas and calculations.
- Customize to your needs by adding/deleting sections and adjusting formulas.
- Automatically calculate key metrics for valuable insights.
- Make informed decisions about your strategy and goals with a clear picture of your business performance and financial health.


