- What is Inventory Turnover Ratio?
- How to Calculate Inventory Turnover Ratio?
- What is a Good Inventory Turnover Ratio?
- Understanding the Significance of Inventory Turnover Ratio
- How to Improve Inventory Turnover Ratio?
- Examples of Inventory Turnover Ratio in Practice
- Tools and Software for Analyzing Inventory Turnover Ratio
- Inventory Turnover Ratio Best Practices
- Conclusion
Are you curious about how efficiently your business manages its inventory? Inventory turnover ratio holds the key to unlocking insights into your inventory management practices and financial health. In this guide, we’ll delve into the intricacies of inventory turnover ratio, from its calculation to its significance in various industries.
You’ll discover practical strategies for improving your ratio, explore real-world examples, and learn about the tools and best practices to monitor and maintain optimal turnover levels. Whether you’re in retail, manufacturing, or the service industry, understanding and leveraging inventory turnover ratio can drive efficiency, profitability, and long-term success for your business.
What is Inventory Turnover Ratio?
Inventory turnover ratio, also known as stock turnover ratio, is a financial metric used to measure the efficiency with which a company manages its inventory. It calculates how many times a company’s inventory is sold and replaced over a specific period, usually a year. This ratio indicates how quickly inventory is being sold and replenished, providing insights into inventory management effectiveness.
The formula for calculating inventory turnover ratio is straightforward:
Inventory Turnover Ratio = Cost of Goods Sold / Average Inventory
Importance of Inventory Turnover Ratio
Understanding the significance of inventory turnover ratio is crucial for businesses across various industries. Here are some key reasons why this metric is important:
- Efficient Resource Utilization: A high inventory turnover ratio indicates efficient utilization of resources, as inventory is sold quickly, minimizing storage costs and freeing up capital.
- Optimized Inventory Levels: By analyzing inventory turnover ratio, businesses can determine the ideal level of inventory to meet customer demand without overstocking or stockouts.
- Financial Health Indicator: Inventory turnover ratio is a key indicator of a company’s financial health and operational efficiency, influencing profitability and liquidity.
Objectives of Analyzing Inventory Turnover Ratio
Analyzing inventory turnover ratio serves several objectives, each contributing to improved inventory management and overall business performance. Here are the primary objectives:
- Optimizing Inventory Levels: By analyzing inventory turnover ratio, businesses can identify opportunities to optimize inventory levels, reducing carrying costs while ensuring adequate stock availability.
- Identifying Slow-Moving Inventory: A low inventory turnover ratio may indicate slow-moving or obsolete inventory that needs to be addressed to prevent tying up capital and storage space.
- Improving Cash Flow: Efficient inventory turnover contributes to improved cash flow by minimizing inventory holding costs and ensuring faster conversion of inventory into revenue.
Understanding these objectives provides businesses with a roadmap for leveraging inventory turnover ratio to drive strategic decision-making and operational excellence.
How to Calculate Inventory Turnover Ratio?
Understanding how to calculate inventory turnover ratio is essential for assessing your business’s inventory management efficiency. Let’s delve deeper into the calculation process, interpretation of the ratio, and the various factors that can influence it.
Formula
The formula for calculating inventory turnover ratio is straightforward:
Inventory Turnover Ratio = Cost of Goods Sold / Average Inventory
Where:
- Cost of Goods Sold (COGS) refers to the total cost of producing or acquiring the goods that were sold during a specific period.
- Average Inventory is the average value of inventory held during the same period.
To calculate average inventory, you can use the following formula:
Average Inventory = (Beginning Inventory + Ending Inventory) / 2
Interpretation of the Ratio
Interpreting the inventory turnover ratio is crucial for understanding how efficiently your company manages its inventory.
- High Ratio: A high inventory turnover ratio indicates that your inventory is selling quickly relative to the cost of goods sold. This can be a positive sign of efficient inventory management and strong sales performance. However, excessively high ratios may suggest stockouts or insufficient inventory levels to meet demand.
- Low Ratio: Conversely, a low inventory turnover ratio suggests that your inventory is not selling as quickly as expected relative to the cost of goods sold. This may indicate overstocking, slow sales, or obsolete inventory. Low ratios can lead to higher holding costs and tie up capital in inventory.
Factors Affecting Inventory Turnover Ratio
Several factors can influence your inventory turnover ratio:
- Seasonality: Seasonal fluctuations in demand can affect inventory turnover. For example, retailers may experience higher turnover during peak seasons like holidays.
- Economic Conditions: Changes in the economy, such as recessions or economic booms, can impact consumer spending habits and, consequently, inventory turnover.
- Industry Trends: Industry-specific factors, such as technological advancements or shifts in consumer preferences, can affect product demand and inventory turnover ratios.
By understanding these factors and regularly monitoring your inventory turnover ratio, you can make informed decisions to optimize your inventory management processes and improve overall business performance.
What is a Good Inventory Turnover Ratio?
Determining what constitutes a “good” inventory turnover ratio can vary depending on factors such as industry norms, business size, and market conditions. Generally, a higher inventory turnover ratio indicates more efficient inventory management, but what qualifies as “good” can differ across industries.
For example:
- In the retail sector, where inventory turnover tends to be higher due to fast-moving consumer goods, a ratio of 5 to 10 may be considered good. This means inventory is sold and replaced 5 to 10 times a year.
- In manufacturing industries with longer production cycles, a ratio of 3 to 5 may be considered acceptable. This indicates that inventory is turned over 3 to 5 times a year.
However, it’s essential to consider industry benchmarks and historical performance when assessing inventory turnover ratio. Comparing your ratio to industry averages or peers can provide valuable context and insights into your business’s performance.
Additionally, a “good” inventory turnover ratio should align with your business objectives and strategies. For example, if your goal is to minimize holding costs and reduce excess inventory, a higher turnover ratio may be preferable. Conversely, if your focus is on maintaining a diverse product range or accommodating seasonal demand fluctuations, a slightly lower turnover ratio may be acceptable.
Ultimately, what constitutes a good inventory turnover ratio for your business will depend on your specific circumstances, goals, and industry dynamics. Regularly monitoring and benchmarking your ratio against relevant benchmarks and adjusting strategies as needed will help ensure optimal inventory management and business success.
Understanding the Significance of Inventory Turnover Ratio
Now, let’s explore why the inventory turnover ratio is significant for your business. By understanding its importance, you’ll gain insights into your inventory management practices and overall financial health.
Efficiency of Inventory Management
The inventory turnover ratio serves as a key indicator of how efficiently your business manages its inventory. A high turnover ratio suggests that your inventory is moving quickly, which is typically desirable as it minimizes holding costs and reduces the risk of inventory obsolescence.
Efficient inventory management leads to several benefits:
- Lower Holding Costs: With faster inventory turnover, you’ll have less money tied up in inventory, reducing storage costs and freeing up capital for other investments.
- Improved Cash Flow: Rapid inventory turnover means faster conversion of inventory into cash, improving cash flow and liquidity.
- Reduced Risk of Obsolescence: High turnover reduces the likelihood of holding onto obsolete or expired inventory, minimizing losses associated with write-offs.
Conversely, a low turnover ratio may indicate inefficiencies in inventory management, such as overstocking, inaccurate demand forecasting, or slow-moving inventory. Identifying and addressing these inefficiencies can help optimize inventory turnover and improve overall operational efficiency.
Financial Health Indicator
In addition to assessing inventory management efficiency, the inventory turnover ratio serves as a vital financial health indicator for your business.
- Profitability: A high turnover ratio generally correlates with higher profitability, as it indicates strong sales performance and efficient use of resources.
- Liquidity: Rapid inventory turnover enhances liquidity by converting inventory into cash more quickly, providing the financial flexibility to meet short-term obligations and pursue growth opportunities.
- Investor Confidence: Investors and lenders often use inventory turnover ratio as a measure of a company’s operational efficiency and financial health. A consistently high ratio may instill confidence in stakeholders, potentially attracting investment and favorable lending terms.
Comparison with Industry Averages
Comparing your inventory turnover ratio with industry averages can provide valuable insights into your business’s competitive position and performance relative to peers.
- Benchmarking: Benchmarking your inventory turnover ratio against industry averages allows you to assess whether your performance is in line with industry norms or if there’s room for improvement.
- Identifying Opportunities and Risks: Significant deviations from industry averages may indicate areas where you excel or areas of concern. For example, a higher turnover ratio than industry peers may signify a competitive advantage, while a lower ratio could indicate potential inefficiencies or challenges.
- Strategic Planning: Understanding how your inventory turnover ratio compares to industry averages can inform strategic planning and decision-making. It can help identify opportunities for growth, optimization, or adjustments to inventory management strategies to align with industry best practices.
By understanding the significance of inventory turnover ratio in these contexts, you can leverage it as a powerful tool for optimizing inventory management, assessing financial performance, and driving strategic decision-making within your business.
How to Improve Inventory Turnover Ratio?
Now, let’s explore practical strategies that you can implement to enhance your inventory turnover ratio and optimize your inventory management practices. By employing these strategies, you can increase efficiency, minimize holding costs, and improve overall business performance.
Inventory Management Techniques
Effective inventory management is essential for optimizing your inventory turnover ratio. Here are some techniques to consider:
- Just-in-Time (JIT) Inventory: Adopting a just-in-time inventory approach involves ordering inventory only when it’s needed, reducing excess inventory levels and minimizing holding costs.
- ABC Analysis: Conduct an ABC analysis to categorize inventory items based on their importance and value. This allows you to prioritize inventory management efforts, focusing resources on high-value items that contribute most to your business.
- Safety Stock Optimization: Review and optimize your safety stock levels to ensure you have enough inventory to meet demand without overstocking.
Implementing these inventory management techniques can help streamline operations, reduce inventory carrying costs, and improve overall inventory turnover.
Demand Forecasting
Accurate demand forecasting is crucial for maintaining optimal inventory levels and improving inventory turnover ratio. By predicting customer demand more effectively, you can minimize stockouts, reduce excess inventory, and enhance overall efficiency. Here’s how you can improve demand forecasting:
- Historical Data Analysis: Analyze historical sales data to identify patterns, trends, and seasonality in demand. Use this information to forecast future demand more accurately.
- Market Research: Conduct market research to understand customer preferences, market trends, and competitive dynamics. This insight can help you anticipate changes in demand and adjust inventory levels accordingly.
- Collaboration with Sales and Marketing Teams: Collaborate closely with sales and marketing teams to gather insights into customer behavior, promotional activities, and upcoming product launches. This information can inform demand forecasts and inventory planning.
By leveraging robust demand forecasting techniques, you can align inventory levels more closely with customer demand, minimize stockouts, and improve inventory turnover.
Supplier Relationships and Procurement Strategies
Strong supplier relationships and strategic procurement practices play a crucial role in optimizing inventory turnover ratio. Here’s how you can enhance supplier relationships and procurement strategies:
- Supplier Collaboration: Develop collaborative partnerships with suppliers to improve communication, reliability, and responsiveness. Establishing trust and transparency can lead to better lead times and inventory availability.
- Negotiation and Contract Management: Negotiate favorable terms and contracts with suppliers to secure competitive pricing, flexible payment terms, and reliable delivery schedules.
- Supplier Performance Monitoring: Monitor supplier performance regularly to identify areas for improvement and address any issues promptly. Track key performance indicators (KPIs) such as on-time delivery, quality, and lead times.
By strengthening supplier relationships and implementing effective procurement strategies, you can streamline the supply chain, reduce procurement costs, and enhance inventory turnover.
By implementing these strategies, you can optimize your inventory turnover ratio, improve operational efficiency, and drive sustainable business growth. Continuously evaluate and refine your inventory management practices to adapt to changing market dynamics and maximize business performance.
Examples of Inventory Turnover Ratio in Practice
To gain a deeper understanding of how inventory turnover ratio works in real-world scenarios, let’s explore some examples across different industries. These examples illustrate how businesses can leverage inventory turnover ratio to inform decision-making, optimize inventory management, and drive operational efficiency.
Example 1: Retail Industry
In the retail sector, inventory turnover ratio plays a critical role in managing stock levels and ensuring timely replenishment of inventory. Consider a clothing retailer that experiences seasonal fluctuations in demand. By analyzing its inventory turnover ratio, the retailer can determine which items are selling quickly and which are lingering on the shelves.
- High Turnover: Items like t-shirts and jeans may have a high turnover ratio, indicating strong demand and the need for frequent restocking. The retailer can use this insight to adjust order quantities and ensure adequate inventory levels to meet customer demand during peak seasons.
- Low Turnover: On the other hand, seasonal items like winter coats may have a lower turnover ratio, signaling slower sales during warmer months. The retailer can use this information to implement promotional strategies, such as clearance sales or targeted marketing campaigns, to move inventory and avoid excess stock.
By closely monitoring inventory turnover ratio and adjusting inventory management strategies accordingly, the retailer can optimize inventory levels, minimize holding costs, and maximize sales opportunities.
Example 2: Manufacturing Industry
In the manufacturing industry, inventory turnover ratio is a key metric for assessing production efficiency and supply chain performance. Consider a manufacturer of electronic components that sources raw materials from multiple suppliers and operates on a just-in-time production model.
- Supplier Performance: By analyzing inventory turnover ratio for individual suppliers, the manufacturer can evaluate supplier performance in terms of delivery reliability, product quality, and lead times. Suppliers with consistently low turnover ratios may indicate issues such as delayed shipments or quality defects, prompting the manufacturer to seek alternative suppliers or negotiate better terms.
- Production Efficiency: Monitoring inventory turnover ratio at various stages of the production process allows the manufacturer to identify bottlenecks or inefficiencies. A sudden drop in turnover ratio for work-in-progress inventory may signal production delays or quality issues that need to be addressed promptly to prevent disruptions to downstream operations.
By leveraging inventory turnover ratio as a performance indicator, the manufacturer can optimize its supply chain, improve production efficiency, and maintain a competitive edge in the market.
Example 3: Service Industry
While traditionally associated with tangible goods, inventory turnover ratio is also relevant in service-based industries where inventory may consist of intangible assets or resources. Consider a software-as-a-service (SaaS) company that provides subscription-based software solutions to clients.
- Subscription Renewals: For a SaaS company, the subscription renewal rate serves as a proxy for inventory turnover ratio. High renewal rates indicate strong customer retention and recurring revenue streams, while low renewal rates may signal customer churn and revenue attrition. By analyzing subscription renewal rates, the SaaS company can identify opportunities to enhance customer satisfaction, improve product offerings, and increase customer lifetime value.
- Resource Utilization: In service-based industries, inventory turnover ratio can also reflect resource utilization efficiency. For example, a consulting firm may track billable hours or project utilization rates as a measure of inventory turnover. High utilization rates indicate optimal resource allocation and capacity utilization, while low utilization rates may suggest underutilized resources or inefficiencies in project management.
By applying the concept of inventory turnover ratio to intangible assets or resources, service-based businesses can optimize resource allocation, improve operational efficiency, and drive profitability.
These examples demonstrate the versatility and applicability of inventory turnover ratio across diverse industries and business models. By analyzing inventory turnover ratio in conjunction with other performance metrics, businesses can make informed decisions, streamline operations, and achieve sustainable growth.
Tools and Software for Analyzing Inventory Turnover Ratio
In the digital age, various tools and software solutions are available to help businesses analyze their inventory turnover ratio more effectively. These tools offer features such as inventory tracking, data visualization, and reporting capabilities, enabling you to gain deeper insights into your inventory management practices. Let’s explore some of the key options in more detail.
Inventory Management Software
Inventory management software provides a comprehensive solution for tracking, managing, and analyzing your inventory. These platforms offer a range of features designed to streamline inventory processes and optimize inventory turnover ratio:
- Inventory Tracking: Easily track inventory levels, locations, and movements in real-time, providing visibility into stock levels and reducing the risk of stockouts or overstocking.
- Demand Forecasting: Utilize advanced forecasting algorithms to predict future demand more accurately, helping to optimize inventory levels and improve turnover.
- Reporting and Analytics: Generate customizable reports and dashboards to analyze key inventory metrics, including turnover ratio, stock aging, and SKU performance.
Popular inventory management software options include:
- Fishbowl
- TradeGecko
- NetSuite
- Zoho Inventorya
Data Analytics Tools
Data analytics tools enable businesses to analyze inventory turnover ratio and other key performance indicators (KPIs) using advanced analytics techniques. These tools offer powerful features for data visualization, trend analysis, and predictive modeling:
- Visualization: Create interactive dashboards and visualizations to explore inventory data and identify trends, patterns, and outliers.
- Predictive Analytics: Leverage predictive modeling techniques to forecast future inventory turnover and optimize inventory levels proactively.
- Statistical Analysis: Conduct statistical analysis to identify correlations, causations, and drivers of inventory turnover, enabling data-driven decision-making.
Popular data analytics tools for inventory analysis include:
- Tableau
- Power BI
- Google Data Studio
- IBM Cognos Analytics
Excel Templates and Formulas for Calculation
For businesses with limited resources or simpler inventory management needs, Excel templates and formulas provide a cost-effective solution for analyzing inventory turnover ratio:
- Templates: Access pre-designed Excel templates for inventory analysis, including templates for calculating inventory turnover ratio, ABC analysis, and inventory aging analysis.
- Formulas: Utilize built-in Excel functions and formulas to perform calculations, such as average inventory, cost of goods sold (COGS), and inventory turnover ratio.
Sample Excel formulas for calculating inventory turnover ratio:
COGS (Cost of Goods Sold): =SUM(Costs)

Average Inventory: =(Beginning Inventory + Ending Inventory) / 2

Inventory Turnover Ratio: =COGS / Average Inventory
By leveraging these tools and software solutions, businesses can streamline inventory analysis, gain actionable insights, and optimize inventory turnover ratio to drive operational efficiency and profitability. Evaluate your business needs and resources to determine the most suitable option for your inventory management requirements.
Inventory Turnover Ratio Best Practices
Monitoring and maintaining your inventory turnover ratio is essential for optimizing inventory management and ensuring business success. By implementing best practices, you can proactively manage your inventory turnover ratio and drive continuous improvement.
- Regular Monitoring: Establish a routine schedule for monitoring your inventory turnover ratio, ideally on a monthly or quarterly basis. Regular monitoring allows you to identify trends, patterns, and deviations from expected performance promptly.
- Set Benchmarks: Establish benchmarks or targets for your inventory turnover ratio based on industry standards, historical performance, and business objectives. Setting clear benchmarks provides a reference point for evaluating performance and progress over time.
- Track Key Performance Indicators (KPIs): In addition to inventory turnover ratio, track other relevant KPIs such as days sales of inventory (DSI), stockout rates, and order fulfillment cycle times. Monitoring multiple KPIs provides a more comprehensive view of inventory performance and helps identify areas for improvement.
- Root Cause Analysis: Conduct root cause analysis to understand the underlying factors contributing to changes in your inventory turnover ratio. Identify potential drivers such as fluctuations in demand, supply chain disruptions, or operational inefficiencies.
- Cross-Functional Collaboration: Foster collaboration between different departments involved in inventory management, including purchasing, sales, logistics, and finance. Cross-functional collaboration enables a holistic approach to inventory management and facilitates alignment of goals and strategies.
- Continuous Improvement: Adopt a culture of continuous improvement by regularly reviewing and refining your inventory management processes. Solicit feedback from stakeholders, implement lessons learned from past experiences, and explore opportunities for innovation and optimization.
- Invest in Training and Development: Provide training and development opportunities for employees involved in inventory management to enhance their skills and knowledge. Educated and empowered staff are better equipped to implement best practices and contribute to improving inventory turnover ratio.
- Utilize Technology: Leverage technology solutions such as inventory management software, data analytics tools, and automation to streamline inventory processes and gain actionable insights. Technology can help automate routine tasks, improve data accuracy, and facilitate data-driven decision-making.
- Stay Flexible and Adaptive: Remain flexible and adaptive in your approach to inventory management, particularly in response to changing market conditions, customer preferences, and industry trends. Be prepared to adjust strategies and tactics as needed to optimize inventory turnover ratio and maintain competitiveness.
By incorporating these best practices into your inventory management processes, you can effectively monitor and maintain your inventory turnover ratio, driving efficiency, profitability, and sustainable growth for your business. Regularly review and refine your practices to adapt to evolving business needs and market dynamics.
Conclusion
Mastering the concept of inventory turnover ratio is essential for any business aiming to thrive in today’s competitive landscape. By understanding how to calculate and interpret this metric, you gain valuable insights into your inventory management efficiency and financial health. Utilizing strategies such as optimizing inventory levels, improving demand forecasting, and strengthening supplier relationships can help you enhance your turnover ratio and drive operational excellence.
Remember, inventory turnover ratio is not a static metric but a dynamic one that requires continuous monitoring and adjustment. By incorporating best practices, leveraging technology, and staying agile in response to market changes, you can maintain optimal turnover levels and position your business for sustained growth and success.
Get Started With a Prebuilt Template!
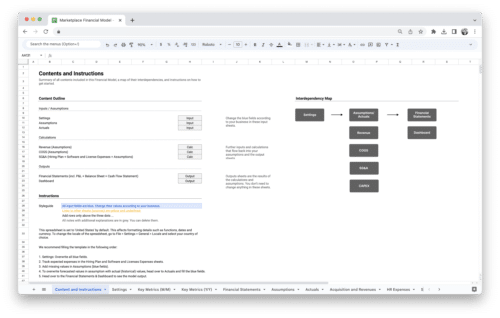
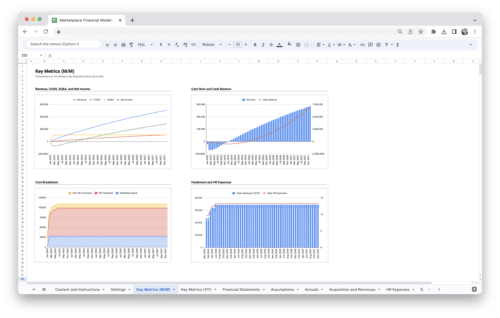
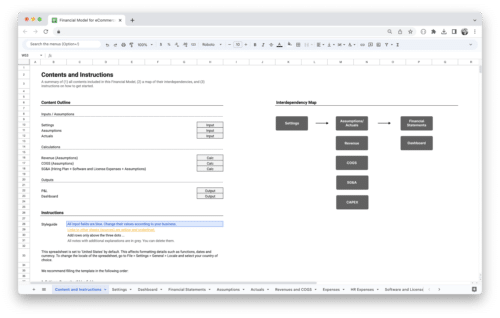
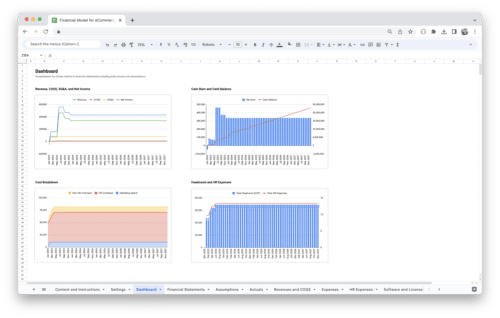
Looking to streamline your business financial modeling process with a prebuilt customizable template? Say goodbye to the hassle of building a financial model from scratch and get started right away with one of our premium templates.
- Save time with no need to create a financial model from scratch.
- Reduce errors with prebuilt formulas and calculations.
- Customize to your needs by adding/deleting sections and adjusting formulas.
- Automatically calculate key metrics for valuable insights.
- Make informed decisions about your strategy and goals with a clear picture of your business performance and financial health.

