Have you ever wondered how businesses gain valuable insights into their financial performance over time? In the dynamic world of finance, understanding the past is often the key to shaping a prosperous future. This guide on horizontal analysis takes you deep into the heart of financial assessment, revealing the secrets behind tracking trends, uncovering patterns, and making informed decisions. Whether you’re an investor seeking to gauge a company’s stability, a financial analyst striving for accuracy, or a business owner aiming to refine strategies, horizontal analysis is your compass.
What is Horizontal Analysis?
Horizontal analysis is a financial analysis technique used to assess changes in a company’s financial statements over multiple periods, typically comparing current and past years. Its primary purpose is to provide insights into how specific financial metrics and performance indicators have evolved over time.
Purpose of Horizontal Analysis
- Track Financial Trends: Horizontal analysis helps organizations and stakeholders track the historical performance of key financial metrics, such as revenue, expenses, assets, liabilities, and equity.
- Identify Patterns: It assists in identifying patterns, trends, and changes in financial data, which can be valuable for decision-making and strategic planning.
- Evaluate Growth: By analyzing growth rates and percentage changes, horizontal analysis allows for an assessment of a company’s financial growth or decline over time.
- Inform Decision-Making: The insights gained from horizontal analysis inform various financial decisions, including investment choices, budgeting, and forecasting.
Importance of Horizontal Analysis in Financial Reporting
Horizontal analysis plays a pivotal role in financial reporting and is highly regarded for several reasons:
- Historical Perspective: It provides historical context by comparing current financial data to previous years, allowing stakeholders to see how a company has evolved.
- Detecting Trends: Horizontal analysis helps identify trends, anomalies, and potential areas of concern in a company’s financial performance. This is crucial for risk assessment and strategic planning.
- Decision Support: Investors, creditors, and management use horizontal analysis to make informed decisions, such as investing in a company, extending credit, or adjusting business strategies.
- Performance Evaluation: It serves as a tool for evaluating a company’s financial performance against its own past performance, industry benchmarks, or competitors.
- Budgeting and Forecasting: By analyzing historical trends, organizations can make more accurate budgetary projections and financial forecasts for the future.
- Regulatory Compliance: In many jurisdictions, comparative financial statements are required for regulatory compliance. Horizontal analysis facilitates compliance with accounting standards and regulations.
- Strategy Development: Companies use insights from horizontal analysis to refine their strategic plans, set financial goals, and align their resources effectively.
- Investor Confidence: Transparent and consistent financial reporting, aided by horizontal analysis, enhances investor confidence and trust in a company’s financial statements.
- Risk Management: Horizontal analysis can help identify financial risks early, allowing organizations to implement risk mitigation strategies.
- Performance Benchmarking: It enables companies to benchmark their financial performance against industry peers, identify areas for improvement, and maintain competitiveness.
Horizontal analysis is a valuable tool in financial reporting and decision-making, providing historical insights and facilitating better-informed choices for investors, creditors, management, and regulatory authorities. Its importance extends to areas such as strategy development, risk management, and performance evaluation.
Key Concepts in Horizontal Analysis
Let’s now explore the key concepts that are fundamental to understanding horizontal analysis, which is essential for evaluating a company’s financial performance over time.
Comparative Financial Statements
Comparative financial statements serve as the cornerstone of horizontal analysis. These statements present financial data from different periods, often two or more years, side by side. This visual comparison enables you to identify patterns, changes, and trends in a company’s financial performance.
Why are comparative financial statements important? They allow you to:
- Spot Trends: By comparing financial data from multiple years, you can quickly spot upward or downward trends in revenues, expenses, and other financial metrics.
- Identify Anomalies: Any anomalies or outliers in the data become apparent when viewing them in a comparative format, prompting further investigation.
- Assess Historical Performance: Comparative statements enable you to assess how a company’s financial performance has evolved over time.
Base Year and Current Year Analysis
In horizontal analysis, understanding the concept of base year and current year is crucial. The base year serves as the reference point for comparisons, while the current year represents the year under scrutiny. By comparing the current year’s financial data to that of the base year, you gain insights into changes and trends.
To calculate the percentage change between the base year and the current year, you can use the following formula:
Percentage Change = ((Current Year - Base Year) / Base Year) * 100
Here’s why base year and current year analysis matters:
- Baseline Comparison: The base year provides a baseline against which you measure subsequent years, helping you assess the degree of change.
- Rate of Change: The percentage change formula quantifies the rate of change, indicating whether the current year’s performance improved or declined compared to the base year.
Percentage Changes and Trends
Percentage changes are a critical component of horizontal analysis. These changes express how much a specific financial item has increased or decreased over time in terms of a percentage. Analyzing percentage changes helps you determine not only the magnitude of the change but also its direction, whether it’s positive or negative.
To calculate the percentage change, use the formula mentioned earlier.
Why focus on percentage changes and trends?
- Magnitude Assessment: Percentage changes reveal the extent of fluctuations in financial metrics, helping you assess their significance.
- Directional Insights: Positive percentage changes indicate growth or improvement, while negative changes suggest a decline. This directional information is crucial for decision-making.
Common-Size Statements
Common-size statements offer a more granular perspective on financial data by expressing each line item as a percentage of total revenue (for income statements) or total assets (for balance sheets). This standardization allows for a detailed analysis of individual components in relation to the whole.
For instance, a common-size income statement would show what percentage of revenue is allocated to various expenses, providing insights into cost structures.
Common-size statements are valuable because:
- Detailed Analysis: They provide a detailed breakdown of how different components contribute to the overall financial structure.
- Cross-Company Comparison: Common-size statements enable easy comparisons between companies of different sizes, as they standardize the data.
Understanding these key concepts is vital as they form the foundation for effective horizontal analysis, enabling you to gain meaningful insights into a company’s financial performance and trends.
How to Perform Horizontal Analysis?
Performing horizontal analysis involves a series of structured steps that allow you to assess a company’s financial performance over multiple periods effectively. These steps provide a systematic approach to extracting valuable insights from financial data.
Gather Financial Statements
Before you can embark on a horizontal analysis journey, you need to gather the relevant financial statements. These typically include income statements, balance sheets, and cash flow statements for the years you wish to analyze. Ensure that the financial statements are accurate, complete, and from a reliable source, as the quality of your analysis relies heavily on the integrity of the data.
When collecting financial statements, consider the following:
- Consistency: Ensure that the accounting methods and standards used are consistent across all years being analyzed.
- Data Sources: Verify that the financial statements come from official company reports or reputable sources to minimize the risk of inaccuracies.
- Currency of Data: Use the most up-to-date financial statements available to make your analysis as relevant as possible.
Calculate Dollar Amount Changes
Once you have gathered the necessary financial statements, the next step is to calculate the dollar amount changes for key financial metrics between the base year and the current year. Dollar amount changes provide a clear picture of the absolute differences in financial figures over time.
To calculate the dollar amount change for a specific financial item (e.g., revenue, expenses), use the following formula:
Dollar Amount Change = Current Year Amount - Base Year Amount
Why calculate dollar amount changes?
- Quantifying Differences: It quantifies how much a financial metric has increased or decreased in absolute terms, providing a clear baseline for comparison.
- Identification of Key Drivers: Dollar amount changes help identify which financial items have the most significant impact on overall performance.
Calculate Percentage Changes
Percentage changes are a crucial part of horizontal analysis as they reveal the relative magnitude of changes between the base year and the current year. These changes are expressed as percentages, making it easier to assess the significance of the differences.
Use the formula mentioned earlier to calculate percentage changes:
Percentage Change = ((Current Year Amount - Base Year Amount) / Base Year Amount) * 100
Why calculate percentage changes?
- Standardized Comparison: Expressing changes as percentages standardizes the data, allowing for meaningful comparisons between different financial items and across companies.
- Directional Insights: Positive percentage changes indicate growth, while negative changes suggest a decline. This directional information is invaluable for decision-making.
Analyze Trends and Patterns
With dollar amount changes and percentage changes calculated, it’s time to analyze the trends and patterns within the data. Look for consistent patterns of growth, stability, or decline in key financial metrics. Additionally, consider examining the factors that may have contributed to these trends, such as changes in market conditions, company strategy, or industry dynamics.
Key aspects of trend analysis:
- Identifying Patterns: Determine whether there are recurring trends over multiple years, which can provide valuable insights into the company’s financial behavior.
- Anomaly Detection: Be vigilant for any outliers or irregularities that may require further investigation.
Interpret the Results
The final step in horizontal analysis is interpreting the results of your analysis. This involves drawing meaningful conclusions from the trends, patterns, and changes you’ve identified. Consider the context in which these changes occurred and their potential impact on the company’s overall financial health.
When interpreting the results:
- Contextual Understanding: Take into account external factors such as economic conditions, industry trends, and company-specific events that may have influenced the results.
- Actionable Insights: Identify actionable insights that can inform decision-making, whether it’s making investment decisions, adjusting business strategies, or assessing financial health.
By following these steps in performing horizontal analysis, you’ll be well-equipped to assess and understand a company’s financial performance over time and make informed decisions based on your findings.
Horizontal Analysis of Income Statements
Now, let’s dive into the specifics of performing horizontal analysis on income statements. Income statements provide valuable insights into a company’s revenue, expenses, and profitability over time. By analyzing these components, you can gain a deeper understanding of the company’s financial performance.
Analyzing Revenue Trends
Revenue is a fundamental metric in any income statement, and its analysis is often the starting point of horizontal analysis. When analyzing revenue trends, you’re primarily interested in identifying patterns of growth, stagnation, or decline in the company’s sales and income streams over multiple years.
Key considerations when analyzing revenue trends:
- Consistency: Look for consistent growth or decline patterns that can provide insights into the company’s market performance.
- Seasonality: Consider any seasonality effects that may lead to periodic fluctuations in revenue.
- Segment Analysis: If applicable, break down revenue by product lines or business segments to pinpoint areas of strength or weakness.
Analyzing Expense Trends
Expense analysis is equally important when conducting horizontal analysis on income statements. It helps you understand how efficiently a company is managing its costs and whether there are any notable changes in expense categories over time.
When analyzing expense trends, focus on:
- Expense Categories: Break down operating expenses, such as salaries, marketing, and overhead, to identify which categories have experienced significant changes.
- Cost Control: Assess the company’s ability to control expenses and maintain or improve profitability.
- Impact on Margins: Consider how expense changes affect the company’s gross profit margin and net profit margin.
Evaluating Profitability Changes
Profitability analysis is a critical aspect of horizontal analysis. It allows you to evaluate how effectively a company is converting its revenue into profits. By examining the changes in profitability over time, you can assess the company’s overall financial health.
Key metrics to assess profitability changes:
- Gross Profit Margin: Analyze changes in the gross profit margin to determine how efficiently the company is producing its goods or services.
- Operating Profit Margin: Examine the operating profit margin to understand how well the company is managing its operating expenses.
- Net Profit Margin: Evaluate the net profit margin to assess the company’s overall profitability after accounting for all expenses.
Example: Horizontal Analysis of an Income Statement
To bring these concepts to life, let’s walk through an example of horizontal analysis on an income statement. Imagine you have access to the income statements of Company XYZ for the years 2022 and 2023. Here’s a simplified example:
Company XYZ Income Statement (in thousands):
|
2022 |
2023 |
Percentage Change |
| Revenue |
$5,000 |
$6,200 |
24% |
| Expenses |
$3,500 |
$4,000 |
14.3% |
| Gross Profit |
$1,500 |
$2,200 |
46.7% |
| Net Profit |
$800 |
$1,200 |
50% |
In this example:
- Revenue Trends: The company experienced a healthy 24% growth in revenue from 2022 to 2023, indicating increased sales.
- Expense Trends: Operating expenses increased by 14.3%, which is lower than the revenue growth rate, suggesting cost control.
- Profitability Changes: Both gross profit and net profit margins improved significantly, demonstrating increased profitability.
This example showcases how horizontal analysis of income statements can provide actionable insights into a company’s financial performance and guide decision-making.
Horizontal Analysis of Balance Sheets
Now, let’s shift our focus to the horizontal analysis of balance sheets. Balance sheets provide a snapshot of a company’s financial position at a specific point in time, allowing you to assess its assets, liabilities, and equity. Analyzing these components over multiple years is instrumental in understanding a company’s financial stability and growth.
Analyzing Asset Trends
When conducting horizontal analysis on balance sheets, the analysis of asset trends is of paramount importance. Assets represent the resources owned by the company and can include cash, accounts receivable, inventory, and property, among others.
Key aspects to consider when analyzing asset trends:
- Asset Composition: Examine the composition of assets and how it has evolved over time. Are there changes in the proportion of current assets to non-current assets?
- Asset Growth: Assess the growth of total assets. Has the company been investing in new assets, and if so, in what categories?
- Asset Quality: Investigate the quality of assets, including the collectability of accounts receivable and the depreciation of tangible assets.
Analyzing Liability Trends
Liabilities represent the company’s obligations and debts. Analyzing liability trends is essential for understanding how the company manages its financial obligations and its long-term financial health.
When analyzing liability trends, pay attention to:
- Debt Levels: Assess the company’s debt levels, including short-term and long-term debt. Have there been significant changes in debt over the years?
- Working Capital: Evaluate working capital, which is the difference between current assets and current liabilities. Positive working capital is generally favorable.
- Liability Structure: Examine the composition of liabilities. Are there changes in the proportion of short-term to long-term liabilities?
Evaluating Equity Changes
Equity represents the owners’ stake in the company and is a key indicator of the company’s net worth. Analyzing equity changes over time can provide insights into how the company has financed its operations and whether it has generated profits or incurred losses.
When evaluating equity changes, consider the following:
- Retained Earnings: Look at changes in retained earnings, which reflect the cumulative profits or losses that have been retained within the company.
- Shareholder Equity: Assess the overall shareholder equity and how it has evolved. Has the company issued new shares or repurchased existing ones?
- Dividends: Consider whether dividends have been paid out to shareholders, as this can impact the growth of equity.
Example: Horizontal Analysis of a Balance Sheet
To illustrate the application of horizontal analysis on balance sheets, let’s examine a hypothetical example of Company ABC’s balance sheets for 2022 and 2023.
Company ABC Balance Sheet (in thousands):
|
2022 |
2023 |
Percentage Change |
| Assets |
$10,000 |
$12,000 |
20% |
| Liabilities |
$6,000 |
$7,500 |
25% |
| Equity |
$4,000 |
$4,500 |
12.5% |
In this example:
- Asset Trends: Company ABC’s total assets increased by 20%, suggesting growth in the company’s resource base.
- Liability Trends: Liabilities increased by 25%, indicating a slightly higher rate of growth compared to assets.
- Equity Changes: Equity grew by 12.5%, reflecting the company’s retained earnings and potential capital injections.
This example showcases how horizontal analysis of balance sheets can help you assess a company’s financial stability, its ability to meet its obligations, and its overall financial health.
With a solid understanding of horizontal analysis applied to income statements and balance sheets, you’ll be well-prepared to make informed financial assessments and decisions.
Horizontal Analysis of Cash Flow Statements
Now, let’s delve into the horizontal analysis of cash flow statements. Cash flow statements provide a comprehensive view of a company’s cash inflows and outflows, highlighting its ability to generate cash from its core operations, investments, and financing activities. Analyzing these components over multiple years is crucial for assessing a company’s cash management and liquidity.
Analyzing Operating Cash Flow Trends
Operating cash flow is a key indicator of a company’s ability to generate cash from its core business operations. Analyzing operating cash flow trends over time can reveal how effectively the company manages its day-to-day cash flow and whether it is self-sustaining.
Key considerations when analyzing operating cash flow trends:
- Consistency: Assess the consistency of operating cash flow. Does the company consistently generate positive cash flow from its core operations, or are there fluctuations?
- Positive vs. Negative Cash Flow: Determine whether the company consistently generates positive or negative operating cash flow. Negative cash flow may indicate ongoing cash burn.
- Changes in Cash Flow Drivers: Examine changes in the components of operating cash flow, such as changes in revenue, expenses, and working capital.
Analyzing Investing and Financing Activities
Cash flow statements also provide insights into a company’s investing and financing activities. Analyzing these sections helps you understand how the company allocates its resources and manages its capital.
When analyzing investing and financing activities:
- Investing Activities: Look for trends in cash flows related to investments in assets, acquisitions, or divestitures. Determine whether the company is making strategic investments or divesting non-core assets.
- Financing Activities: Assess cash flows related to debt issuance, repayments, equity issuances, and dividend payments. Analyze the company’s capital structure and financing decisions.
- Cash Flow Drivers: Examine what drives changes in investing and financing cash flows. For example, a significant debt issuance may indicate a need for capital.
Assessing Liquidity Changes
Liquidity is a critical aspect of a company’s financial health, as it determines its ability to meet short-term obligations and seize opportunities. Analyzing liquidity changes over time helps you gauge the company’s ability to cover its immediate cash needs.
When assessing liquidity changes:
- Current Ratio: Calculate the current ratio (current assets divided by current liabilities) over multiple years to assess the company’s short-term liquidity. A ratio above 1 indicates positive liquidity.
- Quick Ratio: Calculate the quick ratio (current assets minus inventory, divided by current liabilities) to assess the company’s ability to meet its short-term obligations without relying on inventory sales.
- Cash Reserves: Evaluate the level of cash reserves held by the company. Significant changes in cash reserves may indicate shifts in liquidity.
Example: Horizontal Analysis of a Cash Flow Statement
Let’s apply the principles of horizontal analysis to a hypothetical example of Company XYZ’s cash flow statement for 2022 and 2023:
Company XYZ Cash Flow Statement (in thousands):
|
2022 |
2023 |
Percentage Change |
| Operating Cash |
$4,500 |
$5,200 |
15.6% |
| Investing Cash |
-$2,000 |
-$1,800 |
10% |
| Financing Cash |
-$1,500 |
-$1,300 |
13.3% |
| Net Change |
$1,000 |
$2,100 |
110% |
In this example:
- Operating Cash Flow Trends: Operating cash flow increased by 15.6%, indicating improved cash generation from core operations.
- Investing and Financing Activities: Both investing and financing activities showed reductions, potentially indicating conservative capital allocation and debt management.
- Net Change: The net change in cash increased significantly by 110%, suggesting improved overall cash position.
This example demonstrates how horizontal analysis of cash flow statements can provide insights into a company’s cash management, liquidity, and financial stability.
With a comprehensive understanding of horizontal analysis applied to income statements, balance sheets, and cash flow statements, you are equipped to assess a company’s financial performance, stability, and growth prospects.
Advanced Techniques and Tools for Horizontal Analysis
In the world of financial analysis, mastering advanced techniques and tools can take your horizontal analysis skills to the next level. These methods go beyond basic percentage changes and provide deeper insights into a company’s financial performance and trends.
Rolling Averages and Smoothing Techniques
Rolling averages and smoothing techniques are valuable tools for reducing noise and identifying long-term trends in financial data. They involve calculating averages over a moving time window, which can help you spot underlying patterns while minimizing short-term fluctuations.
Example of a Rolling Average Calculation:
- Calculate a 12-month rolling average for revenue by adding the revenue of the current month and the previous 11 months, then dividing by 12.
Benefits of rolling averages and smoothing techniques:
- Noise Reduction: They smooth out irregularities in the data caused by seasonality or one-time events, making it easier to identify true trends.
- Long-Term Insights: Rolling averages highlight long-term patterns that may not be evident when analyzing individual data points.
Regression Analysis for Forecasting
Regression analysis is a powerful statistical technique used in horizontal analysis to predict future values based on historical data. By fitting a regression model to financial data, you can make informed forecasts and projections.
Example of Regression Analysis:
- Use historical revenue data to build a regression model that considers factors like time, marketing spend, and economic indicators. This model can then predict future revenue based on these variables.
Benefits of regression analysis for forecasting:
- Data-Driven Predictions: Regression analysis relies on data to make predictions, providing a more scientific approach to forecasting.
- Variable Identification: It helps identify which factors have the most significant impact on financial metrics.
Industry Benchmarking
Industry benchmarking involves comparing a company’s financial performance to industry peers or standards. It provides context for understanding how a company stacks up against competitors and whether it is outperforming or underperforming in specific areas.
Key aspects of industry benchmarking:
- Peer Comparison: Compare financial metrics, such as profit margins or liquidity ratios, to those of similar companies within the same industry.
- Identifying Strengths and Weaknesses: Benchmarking helps identify areas where a company excels and areas that may require improvement.
- Market Positioning: It provides insights into a company’s market positioning and competitiveness within its industry.
Using Financial Software for Automation
In today’s digital age, financial software has become a valuable asset for automating many aspects of horizontal analysis. Software tools can streamline data collection, calculation, and visualization, saving time and reducing the risk of errors.
Benefits of using financial software for automation:
- Efficiency: Automation reduces the time and effort required to perform horizontal analysis, allowing for faster and more frequent analysis.
- Accuracy: Automation minimizes the risk of human errors in data entry and calculation.
- Advanced Analytics: Many financial software solutions offer advanced analytics features, enabling more sophisticated analysis techniques.
Example: Applying Advanced Techniques to Horizontal Analysis
Let’s illustrate the application of these advanced techniques with an example. Imagine you’re analyzing Company DEF’s financial data for 2022 and 2023, and you want to use rolling averages, regression analysis, and industry benchmarking to gain deeper insights.
In this hypothetical example, you might:
- Calculate rolling averages to identify long-term revenue trends.
- Use regression analysis to forecast revenue for 2024.
- Benchmark Company DEF’s profitability ratios against industry standards to assess its competitive position.
By applying these advanced techniques, you can refine your horizontal analysis and provide more accurate insights and recommendations to stakeholders.
Mastering these advanced techniques and tools can significantly enhance your ability to extract meaningful insights from financial data and make informed decisions based on your horizontal analysis findings.
Practical Applications of Horizontal Analysis
Now that you’ve gained a comprehensive understanding of horizontal analysis and its advanced techniques, it’s time to explore its real-world applications. Horizontal analysis is a versatile tool with a wide range of practical uses in various aspects of finance and business.
Investment Decision-Making
Horizontal analysis plays a pivotal role in investment decision-making. Whether you’re an individual investor, a portfolio manager, or part of an investment team, horizontal analysis provides valuable insights into a company’s financial health and growth prospects.
How horizontal analysis informs investment decisions:
- Assessing Historical Performance: Analyzing a company’s financial statements over several years helps investors evaluate its historical growth trends, profitability, and stability.
- Identifying Red Flags: Detecting abrupt changes or inconsistencies in financial metrics can signal potential risks or opportunities.
- Comparing Competing Investments: Investors use horizontal analysis to compare multiple investment opportunities, choosing those with the most favorable financial performance trends.
Credit Analysis and Risk Assessment
Financial institutions and creditors rely on horizontal analysis to assess the creditworthiness of individuals and businesses. By analyzing historical financial data, lenders can gauge the ability of borrowers to repay loans and manage debt obligations.
How horizontal analysis aids credit analysis and risk assessment:
- Evaluating Debt Capacity: Lenders use horizontal analysis to determine whether borrowers have the financial capacity to service their debts.
- Monitoring Borrower Stability: It helps lenders monitor the stability of borrowers’ financial situations to identify potential default risks.
- Setting Loan Terms: Lenders can tailor loan terms, interest rates, and collateral requirements based on the borrower’s financial history and trends.
Internal Performance Evaluation
Horizontal analysis isn’t limited to external stakeholders; it is also a valuable tool for companies to evaluate their own financial performance. By comparing financial data over time, organizations can make informed decisions and strategic adjustments.
How horizontal analysis aids internal performance evaluation:
- Setting Financial Goals: Companies use historical data to set realistic financial goals and growth targets.
- Budgeting and Forecasting: Past performance trends serve as a foundation for budgeting and financial forecasting, enabling better resource allocation.
- Identifying Cost Management Opportunities: Analyzing expense trends helps organizations identify cost-saving opportunities and improve efficiency.
Regulatory Compliance and Reporting
Regulatory authorities often require companies to perform horizontal analysis as part of their financial reporting obligations. This analysis ensures transparency and compliance with accounting standards, allowing stakeholders to make informed decisions.
Examples of regulatory compliance and reporting requirements:
- SEC Reporting (U.S.): Publicly traded companies in the United States are required to include horizontal analysis in their annual and quarterly reports, helping investors and regulatory bodies assess performance trends.
- IFRS (International): International Financial Reporting Standards require companies to provide comparative financial statements for better transparency and comparability.
- Loan Covenants: Lenders may include covenant requirements in loan agreements that mandate the use of horizontal analysis to monitor financial performance.
Example: Real-World Applications of Horizontal Analysis
To illustrate the practical applications of horizontal analysis, let’s examine a real-world example involving a manufacturing company, ManufacturingCo, Inc. We will explore how ManufacturingCo, Inc. uses horizontal analysis for internal performance evaluation and regulatory compliance.
In this example, ManufacturingCo, Inc.:
- Utilizes horizontal analysis to assess revenue and expense trends over the past five years to set realistic financial goals and optimize budgeting.
- Prepares annual reports for regulatory authorities, including the SEC, which require comparative financial statements for transparency and compliance.
By applying horizontal analysis in these practical scenarios, ManufacturingCo, Inc. enhances its financial decision-making processes and ensures adherence to regulatory standards.
As you can see, horizontal analysis is a versatile tool with diverse applications across finance, investment, risk assessment, internal performance evaluation, and regulatory compliance. Understanding how to use horizontal analysis effectively can provide valuable insights and drive informed decision-making in various professional roles and contexts.
Horizontal Analysis Challenges
While horizontal analysis is a powerful tool for assessing financial performance, it’s important to be aware of common pitfalls and challenges that can arise during the process. These challenges can impact the accuracy and reliability of your analysis. Here’s a list of common pitfalls and challenges to watch out for:
- Inconsistent Accounting Methods: Companies may change accounting methods or standards over time, making it difficult to compare financial data accurately.
- Seasonality Effects: Seasonal variations in revenue or expenses can distort trends. Be mindful of these fluctuations when interpreting data.
- One-Time Events: Extraordinary events, such as mergers, acquisitions, or divestitures, can skew financial statements. It’s essential to identify and adjust for such events.
- Data Quality: Relying on inaccurate or incomplete financial data can lead to misleading conclusions. Ensure the data you use is reliable and from reputable sources.
- Base Year Selection: The choice of the base year can significantly impact the analysis. Selecting an inappropriate base year may obscure trends or exaggerate changes.
- Percentage Misinterpretation: Focusing solely on percentage changes without considering the absolute dollar amounts can lead to misunderstandings of the actual impact of changes.
- Failure to Consider Inflation: Ignoring inflation can distort the analysis, especially when comparing financial data over long periods. Adjust for inflation when necessary.
- Lack of Context: Analyzing data in isolation without considering external factors, industry trends, or market conditions can result in incomplete insights.
- Assuming Causality: Identifying a correlation between financial metrics does not necessarily imply causation. Be cautious about drawing unwarranted conclusions.
- Overlooking Non-Financial Metrics: While financial data is crucial, non-financial metrics like customer satisfaction, employee turnover, or market share can provide valuable context for analysis.
- Complexity and Time-Consuming: Performing horizontal analysis manually, especially for large datasets, can be time-consuming and error-prone. Consider using financial software or tools for automation.
- Overemphasis on Historical Data: Relying too heavily on historical data may hinder forward-looking strategic planning. Balance historical analysis with future projections.
- Ignoring Industry Norms: Failing to benchmark against industry standards can result in an incomplete understanding of a company’s performance relative to its peers.
- Neglecting Qualitative Factors: Horizontal analysis typically focuses on quantitative data. Don’t forget to consider qualitative factors like changes in leadership, market sentiment, or competitive landscape.
- Limited Forecasting Ability: Horizontal analysis is primarily retrospective. It may not provide robust forecasting capabilities without incorporating additional techniques like regression analysis.
Being aware of these pitfalls and challenges in horizontal analysis will help you navigate them effectively, ensuring that your analysis provides accurate and actionable insights into financial performance and trends.
Conclusion
Horizontal analysis is an indispensable tool in the world of finance. It empowers you to understand financial trends, make informed decisions, and assess the health of a business. Whether you’re an investor, a financial professional, or a business owner, mastering horizontal analysis can be a game-changer.
Remember, with the insights gained from this guide, you can navigate the complexities of financial analysis, avoid common pitfalls, and confidently steer your financial journey toward success. So, go ahead, apply what you’ve learned, and embrace the transformative potential of horizontal analysis in your financial endeavors.
Get Started With a Prebuilt Template!
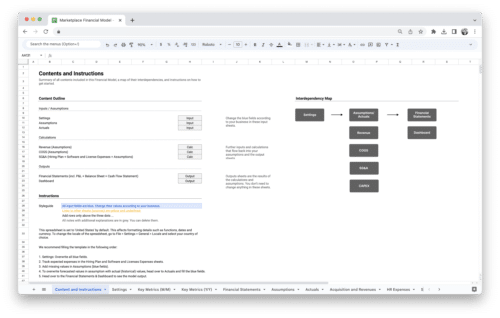
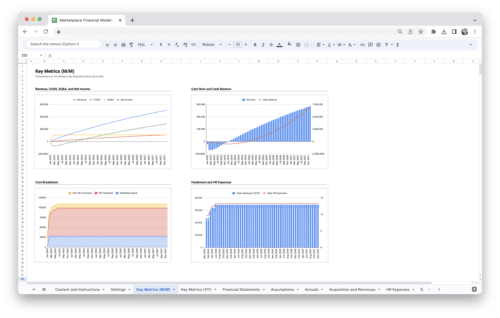
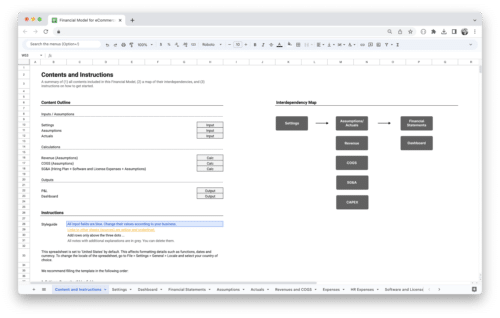
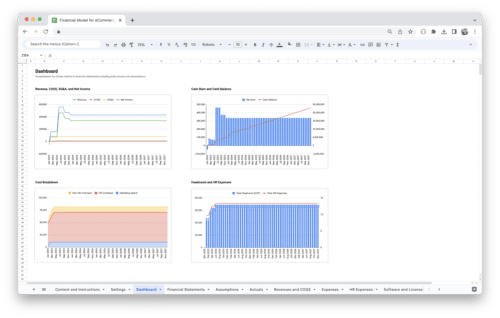
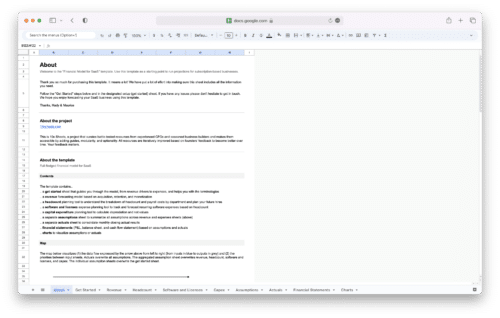
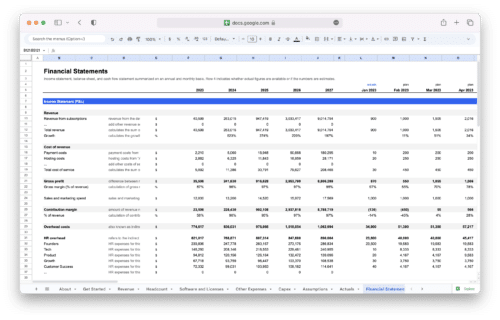
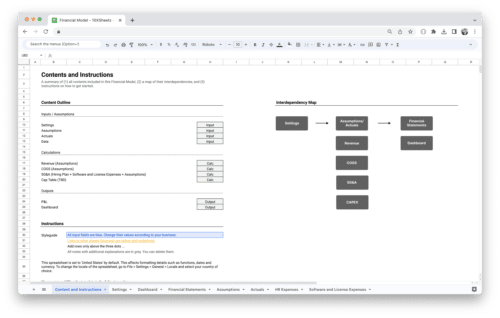
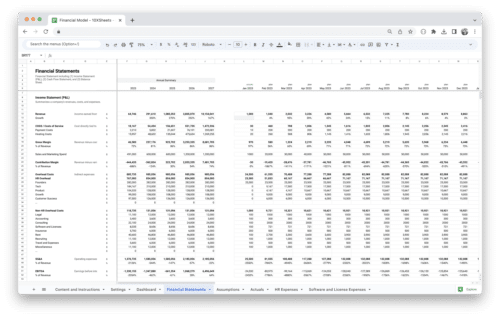
Looking to streamline your business financial modeling process with a prebuilt customizable template? Say goodbye to the hassle of building a financial model from scratch and get started right away with one of our premium templates.
- Save time with no need to create a financial model from scratch.
- Reduce errors with prebuilt formulas and calculations.
- Customize to your needs by adding/deleting sections and adjusting formulas.
- Automatically calculate key metrics for valuable insights.
- Make informed decisions about your strategy and goals with a clear picture of your business performance and financial health.


