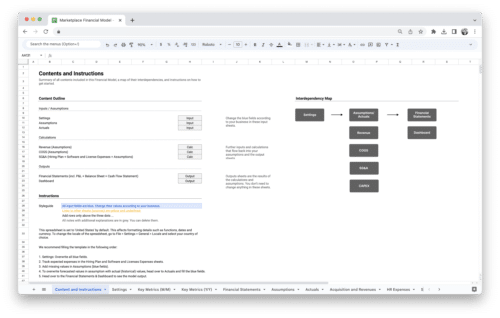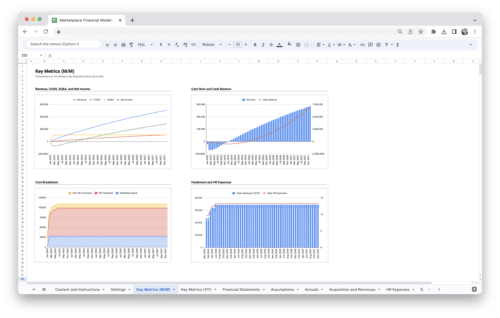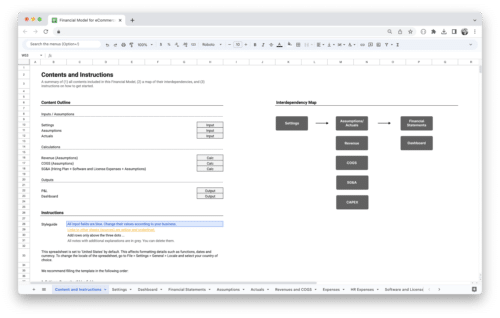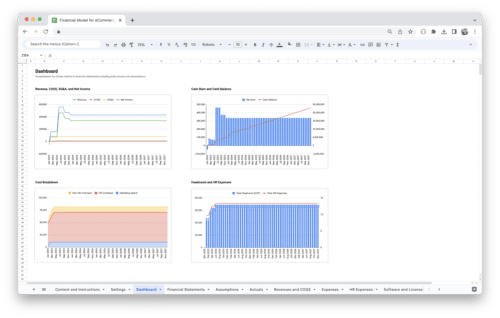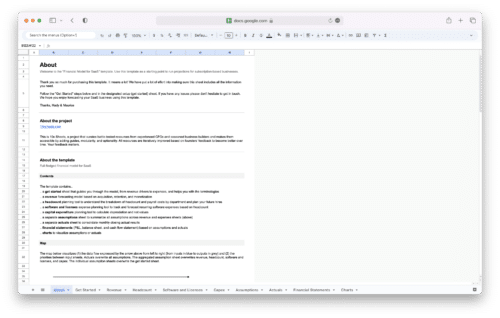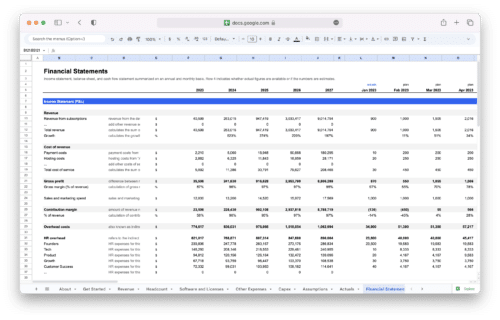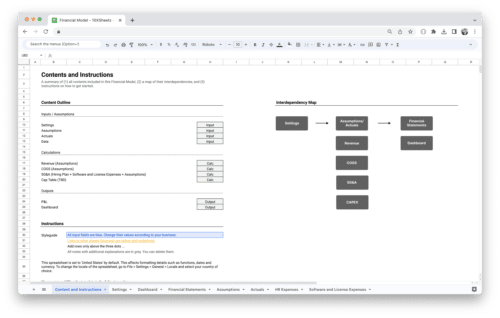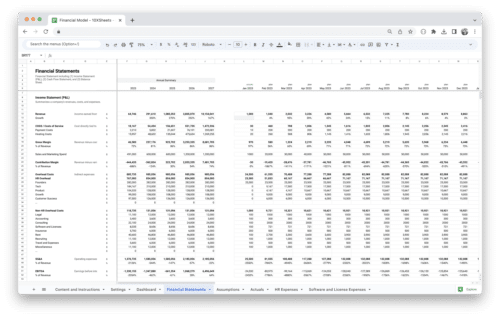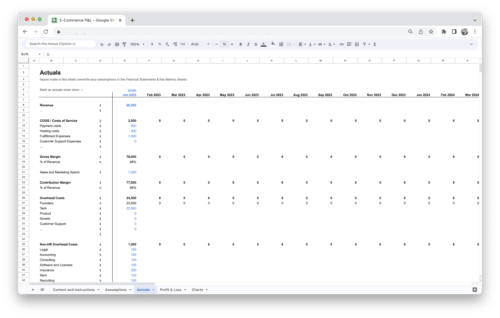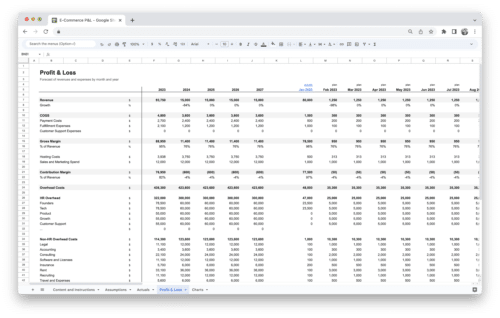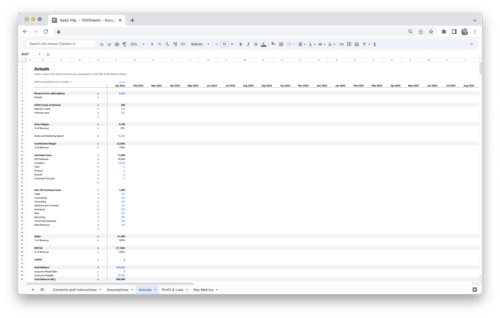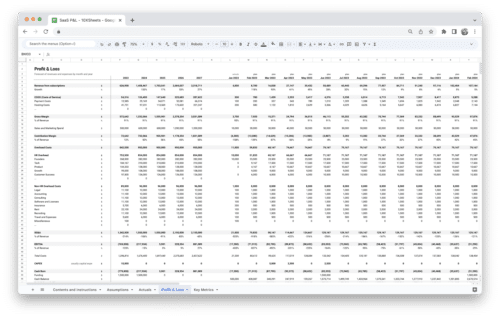
Get Started With a Prebuilt Model
Start with a free template and upgrade when needed.
Are you ready to unlock the financial potential of your organization? Dive into the guide on Financial Planning and Analysis (FP&A) to discover the key strategies, tools, and best practices that will empower you to navigate the complex world of finance with confidence.
Whether you’re a seasoned finance professional or just beginning your journey in the world of FP&A, this guide is your essential companion to understanding, mastering, and harnessing the power of financial planning and analysis.
What is FP&A?
Financial Planning and Analysis (FP&A) is a strategic financial function within organizations that focuses on planning, budgeting, forecasting, and analysis of financial data to drive informed decision-making. FP&A professionals play a crucial role in helping businesses understand their financial health, plan for the future, and achieve their financial objectives.
Key Aspects of FP&A
- Planning: FP&A involves creating financial plans that outline an organization’s goals and the strategies needed to achieve them. These plans serve as roadmaps for financial success.
- Budgeting: FP&A professionals develop budgets that allocate financial resources to different departments and initiatives. Budgets provide a framework for controlling expenses and managing revenue.
- Forecasting: Forecasting is the process of predicting future financial performance based on historical data, market trends, and assumptions. Accurate forecasting helps organizations prepare for potential challenges and opportunities.
- Analysis: FP&A teams analyze financial data to identify trends, outliers, and insights. This analysis informs decision-makers about the financial implications of different courses of action.
Importance of FP&A in Business
Financial Planning and Analysis (FP&A) is indispensable for businesses of all sizes and across industries. Here are key reasons highlighting the importance of FP&A:
- Strategic Decision-Making: FP&A provides critical financial insights that enable organizations to make informed and strategic decisions. By understanding their financial position, businesses can allocate resources effectively and pursue growth opportunities.
- Resource Allocation: FP&A helps businesses allocate their financial resources efficiently. This ensures that budgets align with strategic priorities and that every dollar spent contributes to the organization’s success.
- Risk Management: FP&A involves scenario planning and sensitivity analysis, which are crucial for identifying and mitigating financial risks. Businesses can proactively prepare for economic downturns, market fluctuations, and unexpected challenges.
- Performance Monitoring: FP&A establishes key performance indicators (KPIs) and metrics to measure financial performance. Regular monitoring of these indicators allows organizations to track progress toward their goals and make adjustments as needed.
- Profitability Analysis: FP&A helps businesses analyze profitability at various levels, such as product lines, customer segments, and geographic regions. This insight guides pricing strategies and resource allocation to maximize profitability.
- Investor and Stakeholder Confidence: Effective FP&A practices instill confidence in investors, lenders, and other stakeholders. Transparent and well-structured financial plans and reports demonstrate an organization’s commitment to sound financial management.
- Strategic Planning: FP&A is integral to long-term strategic planning. It allows businesses to align their financial goals with broader strategic objectives and adapt to changing market dynamics.
- Budget Accountability: Through budgeting and variance analysis, FP&A promotes accountability within the organization. Departments and teams are held responsible for adhering to budgetary guidelines.
- Operational Efficiency: By analyzing financial data, FP&A identifies areas where operational efficiencies can be achieved. This can lead to cost reductions and improved overall efficiency.
FP&A is a cornerstone of effective financial management and strategic planning. It empowers businesses to make data-driven decisions, allocate resources wisely, manage risks, and achieve their financial goals in an ever-evolving business landscape.
Key Components of FP&A
Financial Planning and Analysis (FP&A) encompasses several essential components that collectively contribute to the financial health and success of an organization. Let’s delve deeper into each of these components:
Financial Planning
Financial planning is the foundation of FP&A and involves a structured approach to setting financial goals, creating budgets, and formulating strategies to achieve these goals. Here’s a closer look at its key aspects:
- Goal Setting: You start by defining clear financial objectives for your organization. These could include revenue targets, cost reduction goals, profit margins, or capital allocation strategies.
- Budget Creation: Once your goals are established, you create a budget that outlines the allocation of financial resources to various departments, projects, or initiatives. Budgeting ensures that you have a roadmap for managing expenses and revenue.
- Resource Allocation: Financial planning involves making decisions on how to allocate resources effectively. This includes determining the appropriate levels of investment in marketing, research and development, and other areas of the business.
- Scenario Analysis: To enhance decision-making, financial planning often incorporates scenario analysis. This involves modeling different scenarios to understand how various factors, such as changes in market conditions or unexpected events, might impact your financial goals.
Budgeting
Budgeting is a critical aspect of FP&A that goes beyond simply setting spending limits. It involves a structured approach to allocating resources and monitoring financial performance. Here’s a deeper dive into budgeting:
- Detailed Budgets: Budgets are typically broken down into detailed categories, such as operational expenses, capital expenditures, and revenue projections. This level of granularity allows for better control and accountability.
- Variance Analysis: During the budgeting process, it’s essential to establish performance benchmarks and regularly compare actual results to budgeted figures. Variances between the two can highlight areas that require attention or adjustments.
- Flexibility: Effective budgeting is flexible and adaptable. You should be prepared to revise your budget as circumstances change. This flexibility enables your organization to respond to unexpected events or opportunities.
- Zero-Based Budgeting: Some organizations adopt zero-based budgeting, where each budgeting cycle starts from scratch, requiring departments to justify all expenses. This approach encourages cost-consciousness and efficiency.
Forecasting
Forecasting is the process of predicting future financial performance based on historical data, current trends, and various assumptions. Accurate forecasting is vital for informed decision-making. Here’s a closer look at forecasting within FP&A:
- Time Horizons: Forecasts can cover various time horizons, from short-term (monthly or quarterly) to long-term (annually or beyond). Short-term forecasts may focus on cash flow management, while long-term forecasts support strategic planning.
- Data Analysis: Forecasting relies heavily on data analysis techniques, such as regression analysis, time series analysis, and econometric modeling. These methods help identify patterns and relationships in historical data.
- Scenario Planning: In addition to the baseline forecast, FP&A professionals often create multiple scenarios to account for different possible outcomes. This approach prepares organizations for various economic, market, or industry conditions.
- Rolling Forecasts: Some organizations adopt rolling forecasts, where forecasts are regularly updated to reflect changing circumstances. This agile approach ensures that plans remain relevant and adaptable.
Analysis and Reporting
Analysis and reporting are the culmination of the FP&A process, where financial data is transformed into actionable insights and presented to stakeholders. Here’s a deeper exploration of this critical aspect:
- Data Visualization: Effective analysis and reporting often involve data visualization tools and techniques. Graphs, charts, and dashboards make complex financial data more understandable and accessible to a wider audience.
- Key Performance Indicators (KPIs): FP&A professionals identify and track KPIs that align with the organization’s financial goals. Common KPIs include revenue growth, profitability ratios, and return on investment (ROI).
- Trend Analysis: Beyond individual KPIs, trend analysis is crucial. Examining historical trends can uncover valuable insights into your organization’s financial performance, helping you make informed decisions.
- Narrative Reporting: Alongside quantitative data, narrative reporting provides context and explanations for financial results. It helps stakeholders understand the “why” behind the numbers and supports strategic discussions.
The key components of FP&A—financial planning, budgeting, forecasting, and analysis and reporting—are integral to an organization’s ability to manage its finances effectively, make informed decisions, and achieve its financial objectives. Understanding these components and their interplay is fundamental to success in the world of finance.
FP&A Process
The Financial Planning and Analysis (FP&A) process is a structured approach that enables organizations to manage their finances, make informed decisions, and achieve their financial goals. Let’s explore each stage of this critical process in greater detail:
Data Collection
Data collection is the initial phase of the FP&A process, where you gather relevant financial and non-financial data from various sources. Here’s a deeper look at this essential step:
- Data Sources: FP&A professionals collect data from multiple sources, including accounting systems, financial statements, market research, and operational reports. Ensuring the accuracy and completeness of data is paramount.
- Historical Data: Historical financial data is crucial for establishing benchmarks and identifying trends. It provides a foundation for forecasting and analysis.
- Non-Financial Data: Beyond financial data, non-financial data, such as customer feedback, industry trends, and macroeconomic indicators, can provide valuable context for decision-making.
- Data Quality Control: Implementing data quality control measures, such as data validation and cleansing, helps ensure the reliability of the data used in subsequent stages of FP&A.
Data Analysis
Once you’ve collected the necessary data, the next step in the FP&A process is data analysis. This phase involves using various analytical techniques to extract insights and draw meaningful conclusions:
- Statistical Methods: FP&A professionals often employ statistical methods like regression analysis to identify relationships between variables and make predictions.
- Financial Ratios: Calculating financial ratios, such as profitability margins, liquidity ratios, and efficiency ratios, allows for a comprehensive assessment of a company’s financial health.
- Scenario Analysis: Scenario analysis involves modeling different potential scenarios, such as optimistic, pessimistic, and base-case scenarios. This helps assess the impact of various factors on financial outcomes.
- Data Visualization: Data visualization tools, such as charts, graphs, and dashboards, are used to present complex financial data in a clear and accessible manner, making it easier for stakeholders to understand and interpret.
Budget Creation
The creation of a budget is a fundamental part of FP&A. A budget serves as a financial roadmap, outlining the allocation of resources and guiding financial decisions:
- Goal Alignment: The budget should align with the organization’s strategic goals and objectives. It defines how resources will be distributed to achieve these goals.
- Detailed Planning: Budgets are typically detailed, breaking down expenditures by department, project, or initiative. This level of granularity enables better cost control and accountability.
- Variance Analysis: Throughout the budgeting period, FP&A professionals regularly compare actual results to the budget. Variances between the two provide insights into areas that may require adjustments.
- Rolling Budgets: Some organizations opt for rolling budgets, which involve updating the budget periodically to reflect changing circumstances. This flexibility allows for more agile decision-making.
Forecasting Techniques
Forecasting is a critical aspect of FP&A that involves predicting future financial performance based on historical data and various assumptions. Several techniques are employed to create accurate forecasts:
- Time Series Analysis: Time series analysis examines historical data to identify trends and patterns. It helps forecast future values based on past behavior.
- Regression Analysis: Regression models establish relationships between dependent and independent variables, making it possible to predict outcomes based on specific inputs.
- Scenario Planning: FP&A professionals develop multiple scenarios that consider different potential outcomes. These scenarios help organizations prepare for various economic, market, or industry conditions.
- Monte Carlo Simulation: This technique involves running thousands of simulations with different inputs to create a range of possible outcomes, providing a more comprehensive view of future possibilities.
Reporting and Presentation
The final stage of the FP&A process involves reporting and presenting your findings and financial plans to key stakeholders. Effective communication is vital to ensure that everyone understands and supports the financial strategies:
- Key Performance Indicators (KPIs): Reports often highlight key performance indicators (KPIs) that are directly linked to the organization’s financial objectives. Common KPIs include revenue growth, profitability ratios, and cash flow metrics.
- Narrative Reporting: In addition to quantitative data, narrative reporting provides context and explanations for financial results. It helps stakeholders understand the “why” behind the numbers.
- Audience-Centric Approach: Tailor your reports and presentations to the needs of your audience. Executives may require high-level summaries, while department heads may need more detailed information.
- Data Visualization: Visual aids, such as charts and graphs, enhance the effectiveness of presentations by making complex financial data more digestible and engaging.
In summary, the FP&A process is a multi-faceted approach that involves data collection, analysis, budget creation, forecasting techniques, and effective reporting and presentation. Mastering each of these stages is essential for organizations seeking to optimize their financial performance and make informed strategic decisions
FP&A Financial Models
Financial models are the backbone of Financial Planning and Analysis (FP&A). They serve as powerful tools to aid decision-making, simulate scenarios, and project future financial outcomes. We’ll explore the various aspects of financial models in FP&A.
Types of Financial Models
Financial models come in various forms, each designed for specific purposes. Understanding these types is crucial for selecting the right model to address a particular financial question or challenge:
- Budget Models: These models are used for annual financial planning and typically cover revenue, expenses, and capital expenditures. Budget models serve as a detailed financial roadmap.
- Forecasting Models: Forecasting models project future financial performance based on historical data and current trends. They are instrumental in estimating revenue, expenses, and cash flow.
- Valuation Models: Valuation models assess the worth of assets, investments, or companies. Common valuation models include discounted cash flow (DCF), comparable company analysis (CCA), and precedent transactions analysis (PTA).
- Scenario Models: Scenario models simulate different future scenarios, allowing organizations to assess the impact of various factors, such as changes in market conditions, pricing strategies, or cost structures.
- Risk Models: Risk models quantify and analyze financial risks, such as market risk, credit risk, or operational risk. They help organizations manage and mitigate potential threats.
- Sensitivity Analysis Models: Sensitivity analysis models evaluate how changes in key variables affect the overall financial outcome. This is especially useful for identifying areas of financial vulnerability.
How to Build a Financial Model?
Building effective financial models requires a combination of financial expertise, technical proficiency, and attention to detail. Here are key considerations for creating robust financial models:
- Assumptions and Inputs: Start by clearly defining your assumptions and gathering accurate inputs. Assumptions should be realistic and based on historical data or industry standards.
- Structured Approach: Structure your model logically, with well-organized tabs or sections for revenue, expenses, cash flow, and other relevant components. Clarity and organization are essential for model usability.
- Formula Consistency: Ensure that formulas are consistent and error-free throughout the model. Errors can propagate and lead to misleading results.
- Sensitivity Testing: Conduct sensitivity testing to assess how changes in key variables impact your model’s output. This helps identify areas of risk and uncertainty.
- Documentation: Thoroughly document your model, including assumptions, formulas, and data sources. Proper documentation makes it easier for others to understand and use the model.
- Version Control: Implement version control procedures to track changes and updates to the model. This helps maintain a clear audit trail and ensures model integrity.
Sensitivity Analysis
Sensitivity analysis is a critical component of financial modeling in FP&A. It allows organizations to assess the impact of various scenarios and variables on financial outcomes. Here’s a deeper look at sensitivity analysis:
- Purpose: Sensitivity analysis helps identify the degree to which changes in specific variables affect the results of a financial model. It quantifies the model’s sensitivity to variations in inputs.
- Variables of Interest: Focus on variables that are most critical to your financial model. These could include factors like sales volume, pricing, cost of goods sold, interest rates, or exchange rates.
- Scenario Testing: Conduct scenario testing by varying one or more variables within a predefined range. For example, you might assess how different interest rate scenarios impact your organization’s cash flow.
- Results Interpretation: Analyze the results of sensitivity analysis to determine the potential risks and opportunities facing your organization. Identify which variables have the most significant influence on financial outcomes.
- Decision Support: Sensitivity analysis provides decision-makers with valuable insights into the range of possible financial outcomes. It supports more informed decision-making and risk management.
Financial models are indispensable tools in FP&A, offering a structured approach to financial planning, forecasting, valuation, risk assessment, and scenario analysis. Building effective financial models and conducting sensitivity analysis are key skills that empower organizations to make strategic decisions with confidence.
FP&A Tools and Software
Financial Planning and Analysis (FP&A) professionals rely on a variety of tools and software solutions to streamline processes, enhance analysis, and improve decision-making. We’ll delve into the key tools and software commonly used in FP&A.
Excel and Google Sheets for FP&A
Microsoft Excel and Google Sheets are ubiquitous spreadsheet applications that play a significant role in FP&A. They offer a range of features that make them indispensable for financial professionals:
- Data Management: Excel and Google Sheets excel at managing and organizing financial data. You can structure data in tables, create named ranges, and establish data validation rules for accuracy.
- Formulas and Functions: Both platforms offer a vast library of financial and mathematical functions. These functions simplify complex calculations, such as net present value (NPV), internal rate of return (IRR), and financial ratio analysis.
- Scenario Analysis: Excel and Google Sheets provide tools for scenario analysis. You can create multiple scenarios by altering input values, allowing you to assess the impact of different business scenarios on financial outcomes.
- Graphs and Charts: These applications offer charting tools to visualize financial data. Charts and graphs are essential for conveying complex information in a clear and understandable manner.
- Modeling: Excel, in particular, is often used for financial modeling. You can build comprehensive financial models that project future performance, assess investment opportunities, and perform sensitivity analysis.
- Data Integration: Excel and Google Sheets allow you to import data from external sources, such as accounting software or databases, for real-time updates and analysis.
While Excel and Google Sheets are versatile and widely accessible, they have limitations when handling very large datasets or complex financial models. For more advanced FP&A needs, dedicated software may be necessary.
Dedicated FP&A Software
Dedicated FP&A software solutions are specifically designed to address the unique challenges and requirements of financial planning and analysis. These platforms offer several advantages:
- Automated Data Integration: FP&A software often includes built-in connectors to import data seamlessly from various sources, eliminating manual data entry and reducing errors.
- Advanced Forecasting: Dedicated software typically provides advanced forecasting capabilities, including predictive analytics and machine learning algorithms for more accurate and dynamic predictions.
- Collaboration and Workflow: FP&A software facilitates collaboration among team members by allowing multiple users to work on financial models simultaneously. It also streamlines approval workflows and version control.
- Scenario Planning: Many FP&A software solutions offer sophisticated scenario planning features, making it easier to model different business scenarios and assess their impact on financial outcomes.
- Reporting and Dashboards: These platforms come equipped with robust reporting and dashboard capabilities, enabling the creation of interactive, real-time reports that provide a comprehensive view of financial performance.
- Data Security: Dedicated FP&A software often includes enhanced data security features, ensuring the confidentiality and integrity of sensitive financial information.
Popular dedicated FP&A software options include Adaptive Insights, Anaplan, and IBM Planning Analytics, among others. The choice of software depends on the specific needs and scale of your organization.
Data Visualization Tools
Data visualization tools play a vital role in FP&A by transforming complex financial data into visual formats that are easy to understand and interpret. Here’s a closer look at their importance and functionality:
- Visual Storytelling: Data visualization tools enable FP&A professionals to tell a compelling story through visual representations. Charts, graphs, and dashboards make it easier to communicate key insights to stakeholders.
- Interactive Dashboards: These tools allow you to create interactive dashboards that provide real-time access to financial data. Users can explore data, drill down into details, and customize views to suit their needs.
- Customization: You can customize the look and feel of visualizations to match your organization’s branding and reporting standards. This ensures consistency in reporting.
- Multi-Source Integration: Data visualization tools can connect to various data sources, including databases, spreadsheets, and cloud-based platforms, allowing for centralized and up-to-date reporting.
- Real-Time Updates: Some tools offer real-time data updates, ensuring that financial dashboards and reports always reflect the most current information.
- Performance Monitoring: Visualization tools help track key performance indicators (KPIs) and financial metrics, allowing for proactive decision-making and immediate response to emerging trends.
Prominent data visualization tools include Tableau, Microsoft Power BI, and QlikView. These tools empower FP&A professionals to transform raw financial data into actionable insights that drive informed decision-making across the organization.
Examples of FP&A in Action
To gain a deeper understanding of how Financial Planning and Analysis (FP&A) works in practice, let’s explore some real-world examples that showcase its significance across different industries and scenarios:
1. Retail Sector
In the retail industry, FP&A plays a critical role in managing inventory, optimizing pricing strategies, and forecasting demand. Retailers often use historical sales data and market trends to create accurate sales forecasts. For instance, a clothing retailer might analyze past sales patterns to determine the optimal inventory levels for each season. This ensures that they have the right products available when customers are most likely to buy, ultimately boosting profitability.
2. Technology Startups
For technology startups, FP&A is instrumental in securing funding and achieving growth targets. These companies often prepare detailed financial models to demonstrate their business potential to investors. Startups may use sensitivity analysis to show how changes in factors like user acquisition costs or revenue growth rates can impact their financial performance. This not only attracts investors but also guides strategic decisions as the company scales.
3. Manufacturing Industry
In manufacturing, FP&A helps organizations manage production costs, optimize supply chains, and ensure profitability. Manufacturers use variance analysis to compare actual production costs against budgeted amounts. By identifying variances, they can take corrective actions, such as renegotiating supplier contracts or adjusting production processes, to improve cost-efficiency and maintain profitability.
4. Healthcare Organizations
Healthcare institutions rely on FP&A to manage complex budgets, control expenses, and improve patient care. Hospitals, for example, use FP&A to allocate resources effectively among departments, ensuring that each department has the necessary funding for equipment, staffing, and patient care. FP&A also helps healthcare organizations forecast patient volumes, enabling them to plan for staffing needs and allocate resources accordingly.
5. Financial Services
In the financial services sector, including banking and investment firms, FP&A is vital for risk management and compliance. These institutions use advanced financial modeling to assess the impact of different market scenarios on their portfolios. For instance, an investment bank might conduct stress tests to determine how a severe economic downturn would affect its assets and liabilities. This proactive approach helps them manage risk and meet regulatory requirements.
These examples illustrate how FP&A adapts to the unique needs of different industries and organizations. Whether it’s optimizing inventory in retail, securing funding for startups, controlling costs in manufacturing, managing budgets in healthcare, or mitigating risk in financial services, FP&A is a versatile and indispensable tool for informed decision-making and financial success.
FP&A Best Practices
Effective Financial Planning and Analysis (FP&A) relies on a set of best practices that help organizations optimize their financial processes, make informed decisions, and achieve their financial goals. Here are some key FP&A best practices:
- Alignment with Business Strategy: Ensure that your financial plans align with your organization’s overall business strategy. This alignment helps prioritize initiatives that contribute to strategic goals.
- Regular Forecasting and Budgeting: Conduct regular forecasting and budgeting cycles to adapt to changing market conditions and ensure financial stability.
- Data Accuracy and Integrity: Maintain the accuracy and integrity of financial data by implementing data quality controls, validation checks, and regular audits.
- Scenario Planning: Incorporate scenario planning into your FP&A process to assess the potential impact of various economic, market, or internal changes on your financial outcomes.
- Cross-Functional Collaboration: Foster collaboration between finance teams and other departments, such as sales, marketing, and operations. This ensures that financial plans reflect the broader organizational perspective.
- Key Performance Indicators (KPIs): Define and track relevant KPIs to measure progress toward financial objectives and identify areas that require attention.
- Continuous Learning: Stay updated on industry trends, technological advancements, and regulatory changes to adapt your FP&A practices accordingly.
- Narrative Reporting: Accompany quantitative data with narrative reporting that provides context and explanations for financial results, making it easier for stakeholders to understand the implications.
- Flexibility: Maintain flexibility in your financial plans and models to adapt to unforeseen events or opportunities.
FP&A Challenges
While FP&A is a critical function, it comes with its share of challenges. Recognizing these challenges is essential for effective financial planning and analysis:
- Data Quality Issues: Inaccurate or incomplete data can lead to flawed forecasts and decisions. Implement rigorous data quality controls to address this challenge.
- Market Volatility: Economic and market fluctuations can disrupt financial plans. Organizations must develop contingency plans to mitigate the impact of market volatility.
- Changing Business Models: As businesses evolve, FP&A processes must adapt to align with changing business models and strategies. This requires agility and constant adjustment.
- Regulatory Compliance: Staying compliant with evolving financial regulations and reporting standards is an ongoing challenge. Organizations must remain vigilant and responsive to regulatory changes.
- Resource Constraints: Limited resources, both in terms of staff and technology, can pose challenges for FP&A teams. Efficient resource allocation and technology adoption are key strategies to overcome this challenge.
- Complex Data: Handling large volumes of data and complex financial models can be daunting. Organizations may need to invest in advanced analytics tools and training to manage this complexity effectively.
- Communication: Effective communication of financial insights to non-finance stakeholders can be a challenge. FP&A professionals must translate complex financial data into clear and actionable insights.
Addressing these challenges requires a combination of strategic planning, technology adoption, continuous learning, and a proactive approach to risk management. By doing so, organizations can navigate the complexities of FP&A more effectively and make data-driven decisions that drive success.
Conclusion
Financial Planning and Analysis (FP&A) is the compass that guides businesses toward their financial goals. With a solid foundation in FP&A, you can make informed decisions, allocate resources wisely, and navigate the ever-changing financial landscape with confidence.
Remember that FP&A is not just about numbers; it’s about enabling your organization to thrive. By aligning financial plans with strategic objectives, monitoring performance, and embracing best practices, you can steer your business toward financial success. Embrace the power of FP&A, and watch your organization flourish in the world of finance.
Get Started With a Prebuilt Template!
Looking to streamline your business financial modeling process with a prebuilt customizable template? Say goodbye to the hassle of building a financial model from scratch and get started right away with one of our premium templates.
- Save time with no need to create a financial model from scratch.
- Reduce errors with prebuilt formulas and calculations.
- Customize to your needs by adding/deleting sections and adjusting formulas.
- Automatically calculate key metrics for valuable insights.
- Make informed decisions about your strategy and goals with a clear picture of your business performance and financial health.
-
Sale!
Marketplace Financial Model Template
184,03 €Original price was: 184,03 €.125,21 €Current price is: 125,21 €.Value added tax is not collected, as small businesses according to §19 (1) UStG.
Add to Cart Details -
Sale!
E-Commerce Financial Model Template
184,03 €Original price was: 184,03 €.125,21 €Current price is: 125,21 €.Value added tax is not collected, as small businesses according to §19 (1) UStG.
Add to Cart Details -
Sale!
SaaS Financial Model Template
184,03 €Original price was: 184,03 €.125,21 €Current price is: 125,21 €.Value added tax is not collected, as small businesses according to §19 (1) UStG.
Add to Cart Details -
Sale!
Standard Financial Model Template
184,03 €Original price was: 184,03 €.125,21 €Current price is: 125,21 €.Value added tax is not collected, as small businesses according to §19 (1) UStG.
Add to Cart Details -
Sale!
E-Commerce Profit and Loss Statement
100,00 €Original price was: 100,00 €.66,39 €Current price is: 66,39 €.Value added tax is not collected, as small businesses according to §19 (1) UStG.
Add to Cart Details -
Sale!
SaaS Profit and Loss Statement
100,00 €Original price was: 100,00 €.66,39 €Current price is: 66,39 €.Value added tax is not collected, as small businesses according to §19 (1) UStG.
Add to Cart Details

