- What is a Financial Model?
- The Components of Financial Models
- Types of Financial Models
- How to Build a Financial Model?
- Financial Model Template
- Financial Modeling Software and Tools
- Examples of Financial Models
- How to Use a Financial Model?
- Advanced Financial Modeling Techniques
- Financial Modeling Best Practices
- Common Pitfalls and How to Avoid Them
- Conclusion
Have you ever wondered how businesses make big decisions about investments, acquisitions, or future growth? The answer often lies in financial modeling. A financial model is a powerful tool that helps companies project their financial future, estimate the potential impact of different decisions, and plan for a range of possible outcomes.
Whether you’re trying to forecast revenue, assess risk, or determine the value of a company, financial models turn complex data into actionable insights. With the right model, you can see exactly how changes in costs, sales, or market conditions affect a company’s bottom line. This guide will walk you through everything you need to know about financial models—from the basics to advanced techniques—so you can start using them to make smarter, data-driven decisions.
What is a Financial Model?
A financial model is a quantitative representation of a company’s financial performance, typically constructed using spreadsheets or specialized software. It incorporates historical data, assumptions, and forecasts to project future financial outcomes such as revenue, expenses, cash flow, and profitability. Essentially, it acts as a blueprint for understanding how a business or project is likely to perform under various scenarios.
The model usually consists of interconnected financial statements, including the income statement, balance sheet, and cash flow statement, which are all designed to work together and reflect the company’s financial reality. Financial models are built with the help of several key drivers such as revenue growth, cost of goods sold, capital expenditures, and financing decisions. By varying the assumptions within the model, analysts can simulate different business scenarios and assess potential outcomes, which is invaluable for making strategic decisions.
Financial models are used by a wide range of professionals including corporate finance teams, investment analysts, accountants, and business owners. Whether for valuation, budgeting, forecasting, or risk analysis, financial models provide the foundation for making informed decisions about a company’s future direction.
Importance and Purpose of Financial Models
Financial models serve multiple purposes, each contributing to better decision-making and long-term planning for businesses. By providing a structured approach to understanding a company’s financial dynamics, they enable stakeholders to analyze and predict performance under various conditions.
- Aid in strategic decision-making, helping executives evaluate different courses of action based on financial data.
- Provide a detailed framework for assessing potential investments or acquisitions, including ROI, risk, and scalability.
- Enable businesses to forecast future performance, aiding in budgeting and resource allocation.
- Help identify financial risks and opportunities by modeling different scenarios and outcomes.
- Serve as a tool for raising capital or securing loans, as potential investors or lenders often rely on models to assess risk and potential returns.
- Offer a structured approach to analyzing historical performance, which can inform future projections and operational strategies.
- Enhance communication with stakeholders by presenting data in an easily digestible and transparent format.
Financial models provide an essential decision-making tool for managing a company’s finances, mitigating risk, and driving growth. Whether you’re planning for the next fiscal year or evaluating a merger or acquisition, a financial model ensures you’re making data-driven choices backed by solid financial projections.
Types of Financial Models
There are several types of financial models, each designed to serve specific purposes and assist in different business scenarios. Depending on the objective of the analysis, the model will be structured to evaluate particular metrics or scenarios that are relevant to the decision at hand. Below are some of the most common types of financial models used across industries.
- Discounted Cash Flow (DCF) Model: Used to value a company or project by determining the present value of its future cash flows, adjusted for the time value of money. It’s one of the most common methods for valuing businesses, especially those with predictable cash flow.
- Comparable Company Analysis (CCA): A relative valuation model that compares the financial metrics of a target company with similar publicly traded companies. This model is often used in mergers and acquisitions (M&A) to assess whether a company is over or under-valued.
- Precedent Transaction Analysis (PTA): Similar to CCA, this model looks at past transactions involving similar companies to determine a valuation based on the multiples paid in those deals.
- Leveraged Buyout (LBO) Model: Used by private equity firms to assess the feasibility of an acquisition that uses a significant amount of debt to finance the deal. It calculates the returns on equity based on projected cash flows and debt repayments.
- Budgeting and Forecasting Models: These models are used to predict a company’s future financial performance based on historical data, market trends, and assumptions. They are helpful for planning operational and financial strategies and for creating annual budgets.
- Mergers and Acquisitions (M&A) Model: Specifically designed to assess the financial impact of a potential merger or acquisition. It includes detailed analysis of the combined company’s earnings, cash flow, and balance sheet after the deal.
Each type of financial model is tailored to address different business needs, providing relevant insights and data for a wide range of decision-making processes.
Key Components of a Financial Model
Every financial model has core components that come together to create an accurate and comprehensive financial picture of a business. These components help make the model actionable and effective for strategic decision-making, providing both current snapshots of financial health and future forecasts.
- Assumptions: The starting point for any financial model. Assumptions include expected growth rates, cost structures, market trends, and other variables that drive future performance. They are based on historical data, industry benchmarks, and expert predictions.
- Revenue Projections: Revenue is typically the primary driver of any financial model. These projections estimate how much money the company will generate from sales of its products or services over time, factoring in customer demand, market conditions, and pricing strategies.
- Operating Expenses: Operating expenses include both fixed and variable costs necessary to run the business. These might include salaries, rent, utilities, and raw materials. Accurate projections of operating expenses are crucial for understanding profitability and cash flow.
- Capital Expenditures (CapEx): These are the costs related to acquiring or upgrading physical assets, such as equipment, machinery, and buildings. Projections for CapEx help determine how much investment is needed to maintain or grow the business.
- Working Capital: Working capital represents the money needed to fund day-to-day operations. It includes accounts receivable, accounts payable, and inventory. Managing working capital effectively ensures that the business can meet short-term obligations and continue operations without interruption.
- Financial Statements: The three primary financial statements in any model are the income statement, balance sheet, and cash flow statement. These statements work together to provide a comprehensive view of a company’s financial health, profitability, liquidity, and capital structure.
- Valuation Metrics: These are the metrics used to determine the company’s financial value, such as discounted cash flow (DCF), enterprise value (EV), or price-to-earnings (P/E) ratio. These metrics are often used to evaluate investment opportunities or determine the financial viability of a business or project.
By bringing together these core components, financial models offer a structured and detailed view of a company’s financial future, allowing stakeholders to make well-informed decisions based on data and forecasts. Each component interacts with others to create a dynamic and comprehensive financial picture.
The Components of Financial Models
When creating a financial model, understanding the core components is essential. These elements form the foundation of any model, and each one plays a significant role in determining the financial outlook of a business. Whether you are building a model for forecasting, valuation, or decision-making, the accuracy and detail of these components will directly influence the reliability of the results.
Revenue Projections
Revenue projections are perhaps the most critical aspect of any financial model. They estimate future income based on past performance, market conditions, and various assumptions about growth. Accurately projecting revenue is crucial because it drives other parts of the financial model, such as profitability and cash flow.
To develop revenue projections, start by analyzing historical data. This data gives you a baseline to project future growth. For instance, if a business has consistently grown revenue by 10% annually, you might assume a similar growth rate for future periods unless there are changes in market conditions, strategy, or other factors.
Market trends also play a significant role in shaping revenue projections. Industry analysis, consumer behavior patterns, and economic factors can influence sales volumes and pricing strategies. Additionally, segmentation—splitting your revenue streams into categories like product lines or customer types—can provide more granular insights and more accurate projections.
When building revenue projections, it’s essential to consider:
- Product or Service Pricing: Will your pricing remain constant, or are you planning adjustments?
- Market Conditions: How will changes in the economy, competitors, or customer preferences impact sales?
- Volume Growth: What is the expected increase in the number of units sold or new customers acquired?
Projecting revenue accurately requires both historical insights and forward-looking assumptions. It’s also wise to create different scenarios (best case, worst case, and most likely case) to account for uncertainty.
Cost Structure and Operating Expenses
The cost structure of a business outlines how expenses are allocated and helps you understand where money is being spent. In a financial model, these costs are typically divided into fixed and variable expenses. Understanding this distinction is crucial because it impacts profitability and cash flow.
- Fixed Costs: These are expenses that do not fluctuate with production or sales levels. Examples include rent, salaries, and insurance premiums. Even if the business does not generate revenue in a given period, these costs must still be paid.
- Variable Costs: Unlike fixed costs, variable costs change in proportion to sales or production levels. For example, raw materials, commission-based salaries, and shipping costs are all variable costs. The more units you sell, the higher these costs will be.
A financial model should include a detailed breakdown of operating expenses, and it’s essential to analyze how different cost categories affect the bottom line. For instance, rising raw material costs could reduce profit margins, while increasing labor efficiency could drive down unit costs.
Understanding operating expenses also helps you identify opportunities for cost savings. For example, if marketing costs are higher than expected, it may signal the need for better-targeted campaigns or negotiating better advertising rates.
Capital Structure and Financing
Capital structure refers to the way a business finances its operations, typically using a mix of debt, equity, and internal cash flow. This structure has significant implications for the financial health of the business, affecting everything from profitability to risk management.
A solid financial model will include an analysis of the company’s capital structure, breaking down the amount of debt versus equity. Debt financing involves borrowing funds that must be paid back with interest, whereas equity financing involves issuing shares in the company to raise funds.
Debt can be advantageous because interest payments are tax-deductible and can help fund growth without giving up ownership. However, too much debt increases financial risk, as it obligates the company to make regular interest payments regardless of its financial performance.
On the other hand, equity financing dilutes ownership but reduces the financial burden of fixed payments. Understanding the balance between debt and equity is critical for any business because it directly impacts:
- Financial Risk: More debt increases risk, especially in periods of economic downturn.
- Return on Investment (ROI): A well-leveraged capital structure can lead to higher returns on equity, but it also magnifies losses.
- Cost of Capital: The combination of debt and equity affects the weighted average cost of capital (WACC), which is crucial for discounted cash flow (DCF) analysis and overall valuation.
Cash Flow Statement
The cash flow statement tracks the movement of cash in and out of the business. While the income statement shows profitability, the cash flow statement provides insight into a company’s liquidity and ability to meet its obligations. Cash flow is divided into three categories:
- Operating Activities: This section tracks cash flows directly related to the company’s core operations. It includes cash from customers, payments to suppliers, wages, and other day-to-day business expenses.
- Investing Activities: This section reflects cash flows from investments in assets, such as property, equipment, or securities. For example, when a company buys a new factory or sells a piece of land, these transactions are recorded here.
- Financing Activities: This part covers cash flows related to funding the business, including loans, equity issuance, or dividend payments. If a company raises debt or equity to fund its operations, it will show up in this section.
The cash flow statement is vital because a company can be profitable on paper but still face liquidity problems if it doesn’t have enough cash to meet its obligations. A strong positive cash flow indicates the business is generating enough cash to invest in growth and cover expenses, while negative cash flow may signal financial troubles.
When building your financial model, ensure that the cash flow statement is properly linked to both the income statement and balance sheet. For example, depreciation is a non-cash charge that appears on the income statement but needs to be added back to cash flows. Similarly, changes in working capital will impact both the balance sheet and cash flow statement.
Balance Sheet Overview
The balance sheet provides a snapshot of a company’s financial position at a given moment. It lists assets, liabilities, and shareholders’ equity, and the equation is:
Assets = Liabilities + Equity
- Assets: What the company owns, divided into current assets (cash, inventory, accounts receivable) and non-current assets (property, equipment, intangible assets).
- Liabilities: What the company owes, categorized as current liabilities (accounts payable, short-term debt) and non-current liabilities (long-term debt, pension obligations).
- Equity: The ownership value of shareholders after subtracting liabilities from assets. This includes retained earnings, paid-in capital, and stockholder equity.
The balance sheet is essential because it provides insights into the financial stability of a company. If liabilities exceed assets, the company may face insolvency issues. It also helps evaluate financial ratios such as:
- Liquidity Ratios: These measure the company’s ability to cover short-term liabilities (e.g., current ratio, quick ratio).
- Solvency Ratios: These show the ability to cover long-term obligations (e.g., debt-to-equity ratio).
- Profitability Ratios: These indicate how well the company generates profit relative to its revenue, assets, or equity.
When building your financial model, ensure the balance sheet remains balanced. This means that total assets should equal the sum of liabilities and equity. Any discrepancies could indicate errors in the model. The balance sheet also plays a vital role in linking to the cash flow statement and understanding how changes in assets or liabilities affect cash flow.
Understanding these core components allows you to build more accurate and insightful financial models. By accurately projecting revenue, analyzing costs, managing capital structure, and ensuring liquidity through proper cash flow management, you can create models that provide actionable insights for business strategy and decision-making.
Types of Financial Models
When it comes to financial modeling, there isn’t a one-size-fits-all approach. Different types of financial models serve different purposes, and each has its own strengths and applications. Whether you’re looking to value a company, project future performance, or assess the impact of a merger or acquisition, the type of model you choose will shape your analysis and help inform key decisions. Below, we’ll explore the most common types of financial models and how they are used in practice.
Discounted Cash Flow (DCF) Model
The Discounted Cash Flow (DCF) model is one of the most widely used valuation methods in finance. It is based on the premise that the value of a company or asset is the present value of its future cash flows, adjusted for the time value of money. In other words, the model predicts how much a company’s future cash flows are worth today, using a discount rate that reflects the risk and time value of money.
The DCF model is particularly useful for valuing companies with predictable cash flows, such as those in mature industries. It’s also an essential tool for private equity investors, financial analysts, and corporate finance teams when assessing investment opportunities or making acquisition decisions.
To build a DCF model, you begin by projecting a company’s future cash flows, usually over five to ten years. These projections are based on assumptions about revenue growth, operating costs, capital expenditures, and working capital. Once you have the projected cash flows, you apply a discount rate, often the company’s weighted average cost of capital (WACC), to determine their present value. Finally, you sum the present value of all future cash flows, including a terminal value, which represents the company’s value beyond the forecast period.
The formula for DCF is:
DCF = Σ [Cash Flow / (1 + r)^t] + Terminal Value / (1 + r)^t
Where:
- Cash Flow represents the expected future cash flow in each period
- r is the discount rate (typically WACC)
- t is the period in which the cash flow occurs
This model is highly detailed and requires in-depth knowledge of the company’s financials, industry conditions, and future projections. However, it is considered one of the most accurate ways to determine the intrinsic value of a business.
Comparable Company Analysis (CCA) Model
Comparable Company Analysis (CCA) is a relative valuation method used to estimate the value of a company by comparing it to other similar companies within the same industry. The fundamental idea behind CCA is that similar companies should be valued similarly, based on key financial metrics such as revenue, earnings before interest, taxes, depreciation, and amortization (EBITDA), and price-to-earnings (P/E) ratios.
The process begins by selecting a peer group of comparable companies, which should ideally be within the same sector and of a similar size and business model. Once you have identified the peers, you can calculate various valuation multiples such as EV/EBITDA, P/E ratio, and Price-to-Sales ratio. By applying these multiples to the target company’s financials, you can arrive at a valuation estimate.
For example, if the median EV/EBITDA multiple for comparable companies is 8x, and the target company has an EBITDA of $10 million, the company’s enterprise value (EV) would be $80 million. The advantage of the CCA model is that it is quick and provides a market-based estimate of value.
However, the downside is that it’s highly dependent on the selection of comparable companies. If the wrong peers are chosen, or if there are significant differences between the companies, the valuation can be skewed. It also doesn’t account for future growth prospects or company-specific risks, which could limit its accuracy.
Precedent Transaction Analysis (PTA) Model
Precedent Transaction Analysis (PTA) is another form of relative valuation that estimates a company’s value based on the prices paid for similar companies in past transactions. Unlike CCA, which compares a company to other publicly traded companies, PTA looks at past M&A transactions to determine what buyers have historically been willing to pay for companies with similar characteristics.
The process begins by identifying relevant precedent transactions that are similar in terms of industry, size, and transaction type (such as a merger or acquisition). You then analyze the multiples paid in those transactions, such as EV/EBITDA, EV/Revenue, and P/E ratios, and apply them to the financial metrics of the target company.
One advantage of PTA over CCA is that it reflects real-world transaction data, which can often be more relevant when valuing a company for a potential acquisition. However, the downside is that there may not always be enough comparable transactions to draw meaningful conclusions. Additionally, past transactions might not fully reflect current market conditions or the future growth prospects of the target company.
Leveraged Buyout (LBO) Model
A Leveraged Buyout (LBO) model is used to evaluate the financial feasibility of acquiring a company using a significant amount of debt. In an LBO, the buyer typically contributes a small amount of equity while financing the majority of the purchase price with debt. The goal is to use the company’s future cash flows to repay the debt and generate returns on the equity investment.
In an LBO model, you start by projecting the company’s future cash flows, taking into account interest payments, debt repayment schedules, and potential changes in working capital. The key to a successful LBO is ensuring that the company generates enough cash flow to cover its debt obligations while still providing an acceptable return on equity for the buyer.
The model also involves calculating the expected exit value, usually through an eventual sale or IPO, and determining the internal rate of return (IRR) for the investor. The IRR reflects the annualized return on the equity investment and helps assess whether the LBO will meet the investor’s return objectives.
LBO models are complex and require a deep understanding of debt structures, interest rates, and repayment schedules. They are most commonly used by private equity firms, but they can also be applied in other situations where debt financing is a significant part of the transaction.
Budgeting and Forecasting Models
Budgeting and forecasting models are essential for businesses that need to plan for the future. These models help organizations predict future financial performance, allowing them to allocate resources effectively and set realistic financial goals. While they share some similarities, budgeting and forecasting have distinct purposes.
A budget typically outlines the company’s expected revenue and expenses for a specific period (usually a year). It serves as a financial roadmap, helping businesses control spending and ensure they meet their financial targets. Budgeting models are often top-down, with management setting targets for various departments.
A forecast, on the other hand, is a more dynamic tool that predicts future financial performance based on current and historical data. Forecasting models are typically bottom-up, meaning they are built by department heads or financial analysts who input their expectations for key financial variables. Unlike budgets, forecasts are regularly updated to reflect changes in business conditions or market dynamics.
Both models are crucial for managing cash flow, assessing financial performance, and making decisions related to growth and investment. For example, if a company is forecasting higher sales than originally anticipated, it may need to allocate more funds to marketing or production to support that growth.
Mergers and Acquisitions (M&A) Model
The Mergers and Acquisitions (M&A) model is used to evaluate the financial impact of combining two companies. M&A models typically look at how a merger or acquisition will affect key metrics such as earnings per share (EPS), cash flow, and the overall financial structure of the combined company.
The model takes into account the purchase price, financing structure, and potential synergies between the two companies. Synergies refer to the expected benefits of the merger, such as cost savings or revenue growth, which can make the transaction more attractive for both the buyer and the seller. The M&A model also includes the impact of debt financing, stock issuance, and any adjustments to working capital.
One of the key calculations in an M&A model is whether the transaction will be accretive or dilutive to the acquiring company’s EPS. If the deal is accretive, it means that the acquisition will increase the acquiring company’s earnings per share, which is typically viewed as a positive outcome. Conversely, a dilutive transaction will decrease EPS, which could raise concerns among shareholders.
M&A models are often complex and require detailed knowledge of both companies’ financials, industry conditions, and the strategic goals of the merger or acquisition. They are primarily used by investment bankers, corporate finance teams, and private equity firms to assess the financial implications of potential deals.
How to Build a Financial Model?
Building a financial model is an intricate process that requires attention to detail, sound judgment, and a structured approach. Whether you’re creating a model for valuation, forecasting, or budgeting, following a systematic process will help ensure accuracy and reliability. Below, we’ll break down the essential steps involved in constructing a financial model, from defining the model’s objective to performing sensitivity analysis.
1. Define the Objective and Scope of the Model
The first and most crucial step in building a financial model is to clearly define its objective and scope. This step is essential because it sets the foundation for the entire model, guiding decisions about the assumptions, data needed, and level of detail. Understanding the purpose of the model ensures that the model is designed to answer the right questions.
Consider the following objectives for your model:
- Valuation: Are you using the model to determine the value of a company or asset (e.g., using a DCF or Comparable Company Analysis model)?
- Forecasting: Is the purpose to predict future financial performance, such as revenue and cash flow projections, for budgeting or operational planning?
- Scenario Analysis: Will the model be used to test the impact of different scenarios on business outcomes, such as changes in market conditions or operational costs?
The scope of the model refers to the boundaries you set for it. This could involve:
- The time frame (e.g., 5-year projections, 10-year horizon)
- The level of detail (e.g., high-level assumptions or detailed line-item projections)
- The type of business or industry focus
By clearly defining both the objective and scope, you ensure that the model will be built with a clear purpose, avoiding unnecessary complexity or missing key elements that are vital to the analysis.
2. Collect and Organize Financial Data
After setting the objective and scope, the next step is gathering and organizing the financial data that will populate the model. The quality of the data you collect directly impacts the reliability of the financial model. Accurate historical data and industry benchmarks are critical in forming the basis for future projections.
The types of data you’ll need include:
- Historical Financials: Past income statements, balance sheets, and cash flow statements are essential for understanding the company’s performance and establishing baseline assumptions.
- Industry Data and Benchmarks: Data on industry growth rates, cost structures, and comparable companies can help refine assumptions and provide context for the model.
- Company-Specific Data: This could include sales volumes, customer acquisition costs, capital expenditures, and any other internal metrics relevant to the model’s objective.
Once you’ve collected the necessary data, organizing it is equally important. Use a consistent and clear structure that aligns with the model’s layout. For example, historical data should be placed in the first tab or section, with assumptions and projections following. This organization will make it easier to update the model later and ensure that all data flows logically between sections.
3. Develop Assumptions and Forecasts
The core of any financial model lies in its assumptions and forecasts. These elements are vital because they drive the model’s output and help determine the financial trajectory of the business. Assumptions are typically based on historical performance, industry data, and market trends.
When developing assumptions, be realistic and transparent. Common assumptions include:
- Revenue Growth: You may base this on historical growth rates, industry trends, or management’s sales projections.
- Cost Structure: Assumptions about fixed and variable costs, including wages, raw materials, and marketing expenses, should be grounded in both historical data and expected changes.
- Capital Expenditures (CapEx): Forecasts for CapEx are essential for projecting how much a company will spend on long-term investments like equipment, facilities, and technology.
- Working Capital: Assumptions about changes in working capital, such as inventory levels, receivables, and payables, are crucial for understanding cash flow dynamics.
Once your assumptions are defined, you can begin forecasting future performance. Typically, forecasts are done for multiple years, with a more detailed projection in the short term (e.g., 1-3 years) and a high-level projection in the long term (e.g., 5-10 years). These forecasts should include:
- Revenue projections: Based on assumptions about sales growth, pricing, and market conditions.
- Operating expenses: How costs will evolve in line with revenue growth or cost-saving measures.
- Capital structure: How debt, equity, or retained earnings will fund the business in the future.
Forecasting is not just about projecting numbers—it’s about telling a story about how the business will evolve. A model that lacks realistic assumptions or fails to reflect market realities will lead to flawed conclusions.
4. Construct Financial Statements
With assumptions and forecasts in place, the next step is constructing the financial statements: the income statement, balance sheet, and cash flow statement. These statements form the backbone of any financial model and should be constructed in a logical sequence to ensure consistency.
- Income Statement (Profit & Loss Statement): The income statement outlines the company’s revenues, costs, and profits over a specific period. It’s crucial for calculating operating margins, net income, and profitability ratios.
- Balance Sheet: This statement provides a snapshot of the company’s assets, liabilities, and equity at a given point in time. The balance sheet needs to be linked to the income statement and cash flow statement, so changes in assets or liabilities are accurately reflected across all statements.
- Cash Flow Statement: The cash flow statement details the inflows and outflows of cash in operating, investing, and financing activities. A robust financial model ensures that all three statements are integrated—net income from the income statement flows into the cash flow statement, and changes in working capital and capital expenditures are reflected in both the balance sheet and cash flow statement.
The key to constructing these financial statements is to ensure consistency and proper linkages. For example, net income from the income statement feeds into retained earnings in the balance sheet and also serves as the starting point for the cash flow statement. Any changes in working capital (such as an increase in inventory or accounts payable) should be reflected on both the balance sheet and the cash flow statement.
5. Conduct Sensitivity Analysis and Scenario Planning
Once your financial statements are built and linked, it’s time to test the model’s resilience to different assumptions. Sensitivity analysis and scenario planning help assess how changes in key variables—like revenue growth, cost structure, or interest rates—affect the model’s outputs.
- Sensitivity Analysis: This involves changing one or more input variables and observing how those changes affect the outcomes. For example, you could test how different growth rates for sales impact net income or how changes in cost of goods sold (COGS) affect cash flow. Sensitivity analysis allows you to identify which variables have the most significant impact on the model, helping you prioritize areas of focus.
- Scenario Planning: Scenario planning takes sensitivity analysis a step further by modeling multiple scenarios based on different assumptions. For instance, you might model a “best-case,” “worst-case,” and “most likely” scenario, each reflecting different levels of market conditions, customer demand, or cost fluctuations. Scenario planning allows you to prepare for uncertainty and make more informed decisions in a dynamic business environment.
These analyses help you understand the risks associated with various assumptions and prepare for potential changes in the business environment. Sensitivity analysis and scenario planning are essential for building robust, flexible financial models that can withstand uncertainty and guide decision-making in both stable and volatile markets.
Building a financial model is a structured, multi-step process that requires careful planning and execution. By defining the model’s objective, collecting and organizing accurate data, developing reasonable assumptions, constructing financial statements, and testing different scenarios, you ensure that the model provides valuable insights and supports informed decision-making. A well-built model can be a powerful tool for guiding business strategy, attracting investment, and planning for the future.
Financial Model Template
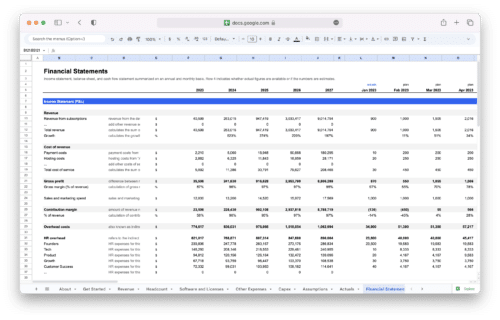
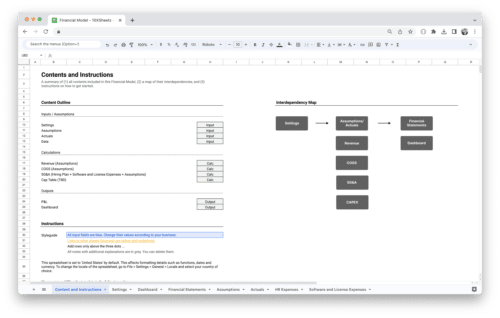
Creating a financial model from scratch can be time-consuming, but using a structured template can simplify the process. Below is a basic financial model template that includes essential components such as revenue projections, expenses, capital expenditures, and financing assumptions. This template can be customized to fit various business scenarios, whether you’re modeling a startup, a growth business, or a large corporation.
Overview of the Template
The financial model template consists of several key sheets or sections that work together to create a comprehensive financial projection. These include:
- Assumptions – This section outlines the key assumptions that drive the model, such as growth rates, cost percentages, tax rates, and financing details.
- Income Statement – This statement tracks revenue, costs, and profits over a set period (usually monthly or annually).
- Balance Sheet – This provides a snapshot of the company’s assets, liabilities, and equity at a specific point in time.
- Cash Flow Statement – This statement details the inflows and outflows of cash from operations, investing, and financing activities.
- Valuation and Outputs – This includes key financial metrics and valuations, such as discounted cash flow (DCF), internal rate of return (IRR), and net present value (NPV).
Financial Model Template Structure
1. Assumptions
The assumptions section is where you’ll input key data that drives the financial model. For example:
- Revenue Growth Rate: Assume 10% annual growth for the next five years.
- Cost of Goods Sold (COGS): Assume 40% of revenue each year.
- Operating Expenses: Projected as 20% of revenue.
- Capital Expenditures: Planned investment of $500,000 in Year 1, growing by 5% annually.
- Tax Rate: Assume a corporate tax rate of 25%.
- Discount Rate: Use a 10% discount rate for the DCF model.
2. Income Statement
The income statement is where you’ll project the company’s revenues, costs, and profits. Here’s a simplified format:
| Description | Year 1 | Year 2 | Year 3 | Year 4 | Year 5 |
|---|---|---|---|---|---|
| Revenue | $1,000,000 | $1,100,000 | $1,210,000 | $1,331,000 | $1,464,100 |
| Cost of Goods Sold | $400,000 | $440,000 | $484,000 | $532,400 | $585,640 |
| Gross Profit | $600,000 | $660,000 | $726,000 | $798,600 | $878,460 |
| Operating Expenses | $200,000 | $220,000 | $242,000 | $266,200 | $292,820 |
| Operating Income | $400,000 | $440,000 | $484,000 | $532,400 | $585,640 |
| Interest Expense | $50,000 | $50,000 | $50,000 | $50,000 | $50,000 |
| Pre-Tax Income | $350,000 | $390,000 | $434,000 | $482,400 | $535,640 |
| Taxes (25%) | $87,500 | $97,500 | $108,500 | $120,600 | $133,910 |
| Net Income | $262,500 | $292,500 | $325,500 | $361,800 | $401,730 |
In this example, we see revenue projections growing each year by 10%, with costs and expenses calculated as a percentage of revenue.
3. Balance Sheet
The balance sheet provides a snapshot of the company’s financial position. A simplified format might look like this:
| Description | Year 1 | Year 2 | Year 3 | Year 4 | Year 5 |
|---|---|---|---|---|---|
| Assets | |||||
| Current Assets | $500,000 | $550,000 | $605,000 | $665,500 | $732,050 |
| Non-Current Assets | $1,000,000 | $1,050,000 | $1,102,500 | $1,157,625 | $1,215,506 |
| Total Assets | $1,500,000 | $1,600,000 | $1,707,500 | $1,823,125 | $1,947,556 |
| Liabilities | |||||
| Current Liabilities | $200,000 | $220,000 | $242,000 | $266,200 | $292,820 |
| Long-Term Debt | $500,000 | $475,000 | $450,000 | $425,000 | $400,000 |
| Total Liabilities | $700,000 | $695,000 | $692,000 | $691,200 | $692,820 |
| Equity | |||||
| Common Stock | $300,000 | $300,000 | $300,000 | $300,000 | $300,000 |
| Retained Earnings | $500,000 | $605,000 | $715,500 | $831,900 | $954,736 |
| Total Equity | $800,000 | $905,000 | $1,015,500 | $1,131,900 | $1,254,736 |
The balance sheet is balanced, with total assets equal to the sum of liabilities and equity. The assets grow steadily due to higher retained earnings, while liabilities decrease as the company pays down debt.
4. Cash Flow Statement
The cash flow statement tracks cash inflows and outflows, showing how a company manages its liquidity. Here’s a simplified format:
| Description | Year 1 | Year 2 | Year 3 | Year 4 | Year 5 |
|---|---|---|---|---|---|
| Operating Cash Flow | $350,000 | $390,000 | $434,000 | $482,400 | $535,640 |
| Investing Cash Flow | ($200,000) | ($250,000) | ($275,000) | ($300,000) | ($330,000) |
| Financing Cash Flow | $100,000 | $50,000 | $50,000 | $50,000 | $50,000 |
| Net Cash Flow | $250,000 | $190,000 | $209,000 | $232,400 | $255,640 |
| Opening Cash Balance | $100,000 | $350,000 | $540,000 | $749,000 | $981,400 |
| Closing Cash Balance | $350,000 | $540,000 | $749,000 | $981,400 | $1,237,040 |
The cash flow statement shows how the company’s operating activities generate cash, how investing activities (e.g., CapEx) use cash, and how financing activities (e.g., debt or equity financing) impact cash. This ensures the company has enough liquidity for day-to-day operations and long-term growth.
5. Valuation and Outputs
In this section, key metrics such as the Net Present Value (NPV), Internal Rate of Return (IRR), and other valuation multiples are calculated to assess the company’s financial worth.
Example Calculation (DCF Valuation):
Using the discounted cash flow projections, the company’s value can be estimated by summing the present value of future cash flows and adding the terminal value:
NPV = Σ (CashFlow / (1 + r)^t) + TerminalValue
This allows investors or company leaders to evaluate whether the projected returns justify the investment and whether the company’s future growth is worth the current valuation.
Customizing the Template
This financial model template can be customized depending on your specific needs. For example, you may want to adjust the revenue growth rate, add more detailed cost categories, or introduce new financial metrics depending on the industry or business type. The structure of the model remains the same, but the assumptions and projections can be tailored to reflect your company’s unique circumstances. Using this template as a starting point can make the process of creating a comprehensive financial model much quicker and more efficient.
Financial Modeling Software and Tools
Building a financial model requires both a deep understanding of the financial data and the right tools to structure and analyze that data effectively. While some financial models can be created using basic tools like spreadsheets, there are a variety of software options available that can enhance accuracy, streamline the process, and enable more advanced features. Choosing the right software or tools depends on the complexity of the model, the level of collaboration required, and the need for specialized functionality. Below, we’ll explore the most common financial modeling tools, from traditional Excel to advanced modeling software.
Excel and Advanced Excel Features for Modeling
Excel is the most commonly used tool for financial modeling, and for good reason. Its flexibility, versatility, and wide range of functions make it ideal for creating custom financial models, from simple budgeting models to complex valuation analyses. Most financial professionals, including investment bankers, analysts, and CFOs, rely heavily on Excel for their day-to-day modeling needs.
The power of Excel in financial modeling lies in its ability to handle large data sets, perform advanced calculations, and visualize data through charts and graphs. Some advanced Excel features and techniques that can enhance your financial modeling process include:
- Formulas and Functions: Excel’s extensive library of built-in functions allows you to perform calculations like summation, averages, and conditional logic. Key functions for financial modeling include SUMIFS, VLOOKUP, INDEX-MATCH, and financial-specific functions like NPV (Net Present Value) and IRR (Internal Rate of Return).
- Pivot Tables: Pivot tables are crucial for summarizing and analyzing large data sets. They allow you to quickly aggregate data by category and pivot it in various ways to reveal insights that may not be immediately obvious.
- Data Validation: This feature helps ensure that the data entered into the model is consistent and error-free. By restricting the type of input in a cell (such as limiting it to dates or numbers), you can reduce the risk of data-entry errors that could affect the integrity of your model.
- Conditional Formatting: This feature makes it easy to highlight key data points or outliers by changing the color or style of cells based on predefined conditions. It’s particularly useful for visually identifying trends or discrepancies in your financials.
- Macroeconomics and Scenario Analysis: Excel also allows you to run more sophisticated models using Visual Basic for Applications (VBA) to automate tasks, perform Monte Carlo simulations, or model complex scenarios more efficiently. With the ability to create custom scripts, users can automate repetitive tasks, create dashboards, or design specialized functions tailored to specific financial analyses.
Although Excel remains a staple for financial modeling, it does have its limitations, particularly when it comes to collaboration, scalability, and ease of use for complex, multi-dimensional models. That’s where more specialized financial modeling software comes in.
Financial Modeling Software Options
While Excel is a fantastic tool for many financial modeling needs, more advanced software options can provide enhanced features and better scalability, especially for larger, more complex models. Some specialized software options are designed to improve collaboration, automate processes, and simplify the modeling of financial scenarios. Here are some of the top financial modeling software options:
- Quantrix: Quantrix is a highly flexible, matrix-based financial modeling tool that offers users the ability to model complex, multi-dimensional data. Unlike traditional spreadsheet-based models, Quantrix allows you to easily create multiple interrelated models, build dynamic scenarios, and run forecasts. This software is particularly valuable for companies that need to model large data sets with numerous assumptions and variables. Its powerful simulation capabilities and robust integration with Excel make it an ideal tool for financial planning, budgeting, and forecasting.
- Adaptive Insights: Adaptive Insights is a cloud-based financial planning and analysis (FP&A) software that enables businesses to create detailed financial models with real-time collaboration. It’s widely used for budgeting, forecasting, and reporting, and is designed to handle complex financial scenarios with ease. Adaptive Insights allows users to model different financial structures, automate reporting processes, and perform “what-if” analyses across different business units. Its cloud infrastructure ensures that teams can collaborate on models from anywhere, making it a great option for organizations with multiple locations or departments.
- Planful (formerly Host Analytics): Planful is another cloud-based financial modeling tool that provides end-to-end financial planning and analysis. It’s known for its robust integration with other enterprise systems, allowing seamless data import from ERPs, CRMs, and other financial systems. This software is great for building sophisticated financial models, managing budgets, forecasting, and generating reports. Its user-friendly interface and scalability make it suitable for businesses of all sizes, from startups to large enterprises.
- Vena Solutions: Vena Solutions offers a platform that combines financial modeling with data management and analytics. It integrates with Excel, allowing users to continue working in a familiar environment while leveraging Vena’s powerful modeling and reporting capabilities. Vena provides a centralized hub for all financial data, automates workflows, and enables real-time collaboration across teams. It is ideal for companies looking to streamline financial processes, improve forecasting accuracy, and enhance their budgeting capabilities.
- Oracle Hyperion: Oracle Hyperion is an enterprise-level financial modeling and analysis software suite designed for large organizations. It offers an integrated platform for financial planning, budgeting, forecasting, and reporting. Hyperion is particularly useful for businesses that require high-level, multi-entity financial modeling and complex consolidations. Its deep integration with Oracle’s ERP and financial systems ensures that businesses can centralize their financial data and generate comprehensive reports.
While these tools are more expensive and often require training to fully utilize, they offer powerful features that can save time, improve accuracy, and facilitate collaboration in larger or more complex financial modeling projects.
Using Templates and Automation for Efficiency
As financial modeling can be time-consuming and prone to error, using templates and automation tools is a great way to improve efficiency and reduce mistakes. Templates offer pre-built frameworks for common financial models, saving you time by giving you a solid starting point. Automation, on the other hand, can streamline repetitive tasks, ensuring that models are consistently updated and accurate.
- Templates: Many financial modeling software platforms, such as Excel and Quantrix, come with a wide range of pre-built templates for different purposes, such as budgeting, financial forecasting, and valuation. Templates provide structured, professional models that ensure consistency and reduce the likelihood of errors. By using templates, you can speed up the process of building a model, especially if you’re working with a well-established framework that fits your needs.
- Automation Tools: Automation tools in Excel, such as macros, or through specialized software like Adaptive Insights or Vena Solutions, can significantly reduce the manual work required in financial modeling. With automation, you can:
- Automate repetitive tasks like updating assumptions or generating reports.
- Create real-time dashboards that automatically update as new data is input.
- Schedule and perform scenario analyses without needing to manually adjust inputs each time.
- Link various models across departments or business units to automatically reflect changes in financial assumptions.
The use of templates and automation enhances model accuracy by reducing human error and ensures that your models stay up to date without requiring constant manual intervention. Additionally, automating the model-building process can free up time for analysts to focus on more strategic, high-level analysis.
Examples of Financial Models
Understanding how financial models are applied in real-world scenarios can make their structure and purpose clearer. Below are several examples of how financial models are used across different industries and situations. Each example illustrates how financial modeling can help businesses make informed decisions, plan for the future, and evaluate various financial strategies.
Valuing a Startup with a Discounted Cash Flow (DCF) Model
One common use of financial models is for valuing companies, especially startups or growing businesses. In this example, imagine a tech startup seeking investment. Investors would want to know how much the company is worth based on its future cash flows. This is where a Discounted Cash Flow (DCF) model comes into play.
Let’s say the startup has forecasted revenues for the next five years and estimates its free cash flow to be $2 million annually. The company applies a discount rate of 10%, which reflects the risk and cost of capital. The DCF model calculates the present value of these future cash flows, allowing investors to see the value of the company today.
Example Calculation:
The startup projects $2 million in free cash flow for each of the next five years. Using the DCF formula:
DCF = Σ (CashFlow / (1 + r)^t)
Where:
- Cash Flow = $2 million
- r = 10% (0.10)
- t = Year (1 to 5)
The present value of each year’s cash flow is calculated and summed up, giving the investors an idea of the company’s valuation today. The DCF model will also include a terminal value, which estimates the company’s value beyond the forecast period, often based on a growth rate assumption.
Forecasting Cash Flow for a Retail Business
Retail businesses often use financial models to forecast cash flow, manage inventory, and plan for future capital expenditures. In this example, imagine a clothing retailer looking to forecast its cash flow for the upcoming year to ensure it has enough liquidity to handle peak seasons, such as the holiday shopping period.
The retailer has sales data from previous years, as well as cost estimates for raw materials, wages, and marketing. By analyzing historical cash flow patterns and factoring in expected seasonal growth, the company can create a cash flow projection to predict whether it will have enough cash to cover operating expenses, inventory purchases, and other needs during the year.
Example Process:
The retailer’s forecast includes:
- Expected sales growth of 15% during the holiday season.
- Operating costs including rent, payroll, and marketing expenses.
- Capital expenditures for store renovations.
- Changes in working capital due to inventory purchases.
With this information, the company can model monthly or quarterly cash flow, identifying periods when cash flow might be tight and planning for any financing needs, such as short-term loans or credit lines. This helps ensure that the business can meet its obligations without running into liquidity issues.
Mergers and Acquisitions (M&A) Model for a Tech Acquisition
In the case of a merger or acquisition, financial models are often used to assess whether the deal is beneficial for both parties. Let’s say a larger tech company is considering acquiring a smaller competitor. The acquiring company will use an M&A model to analyze the financial impact of the acquisition, including the potential for revenue growth, cost savings, and integration costs.
The M&A model will look at the target company’s financials, including projected revenues and costs, and evaluate how the acquisition will affect the acquiring company’s earnings per share (EPS), return on investment (ROI), and other key metrics. It will also assess the impact of financing the acquisition through debt or equity.
Example Calculation:
If the target company’s revenue is $50 million and its projected growth rate is 8%, the acquiring company will model how this growth will impact the combined entity’s overall revenue and profitability. The model will also take into account the synergies expected from the acquisition, such as cost savings from shared resources or cross-selling opportunities. If the deal is financed with debt, the model will calculate the impact of interest payments on cash flow and profitability.
In this case, the M&A model helps the acquiring company assess whether the acquisition will be accretive (increasing earnings) or dilutive (decreasing earnings) to its shareholders, and whether the projected synergies will justify the purchase price.
Leveraged Buyout (LBO) Model for Private Equity
Private equity firms often use financial models to evaluate leveraged buyouts (LBOs), where a company is acquired using a significant amount of debt. In this example, a private equity firm is looking to acquire a mid-sized manufacturing company. The firm plans to use a combination of equity and debt to finance the purchase, with the goal of increasing profitability and selling the company in a few years for a significant return.
The LBO model will project the company’s future cash flows and assess how much debt the business can handle while still generating enough cash to cover interest payments and principal repayments. The model will also calculate the expected return on equity (ROE) and internal rate of return (IRR) for the private equity firm.
Example Process:
The private equity firm expects to purchase the company for $100 million, using $70 million in debt and $30 million in equity. The company is expected to generate $10 million in EBITDA annually, and the firm expects to exit the investment in 5 years, selling the company for a 7x multiple of EBITDA. The LBO model will project the company’s cash flow over the next five years, factoring in interest payments, debt repayments, and expected growth in EBITDA. By the end of the five years, the firm will estimate the sale price based on the multiple and calculate the return on investment.
Budgeting Model for a Nonprofit Organization
Nonprofit organizations also rely on financial models to create annual budgets and forecast expenses. Let’s consider a nonprofit dedicated to education, which needs to forecast its revenue from donations, grants, and fundraising events, while also estimating its operating expenses such as salaries, program costs, and administrative expenses.
A budgeting model for this nonprofit will help ensure that it stays within its financial limits while maximizing its impact. The model will project both income and expenses, track cash flow, and identify any potential funding gaps that need to be addressed.
Example Process:
The nonprofit projects its revenue from three main sources: $2 million in donations, $500,000 in grants, and $300,000 from fundraising events. It also estimates operating expenses of $2.3 million for programs, $300,000 for salaries, and $100,000 for administrative costs. By creating a budget model, the nonprofit can see if its expenses exceed its revenue, and if so, it can adjust its funding strategies or find cost-cutting measures to balance the budget.
These examples show how financial models are applied in different contexts to make data-driven decisions. From valuing companies and managing cash flow to assessing the impact of mergers or acquisitions, financial models are versatile tools that help businesses and organizations predict future outcomes, minimize risks, and make strategic choices based on solid financial data.
How to Use a Financial Model?
Interpreting and using financial models effectively is crucial for making informed business decisions. A financial model is more than just a collection of numbers; it provides insights into the financial health and future potential of a business. By understanding how to read and interpret the outputs, you can derive actionable insights that will guide strategic decisions. Whether you are an executive, investor, or analyst, knowing how to properly use the model’s results is essential for driving value.
Financial models often generate several outputs, such as projected income statements, cash flow statements, and balance sheets. These outputs can be used to:
- Assess the company’s profitability and growth potential.
- Identify potential risks and opportunities.
- Evaluate different investment opportunities or financing options.
- Make budgeting and resource allocation decisions.
- Measure the potential impact of different strategies (e.g., pricing changes, cost reductions, market expansion).
- Calculate important financial metrics like Return on Investment (ROI), Internal Rate of Return (IRR), and Net Present Value (NPV).
- Determine the financial viability of a project or investment based on various scenarios.
In addition to interpreting the numerical results, it’s important to understand the assumptions behind the model. The model is only as reliable as the assumptions it is based on, so it’s essential to evaluate whether those assumptions are realistic. Once you’ve assessed the model’s outputs, you can use them to inform decisions, optimize business strategy, or communicate findings with stakeholders.
Advanced Financial Modeling Techniques
As financial modeling becomes increasingly complex, advanced techniques are being integrated into models to improve accuracy, reduce uncertainty, and make more informed predictions. These techniques, such as Monte Carlo simulations, machine learning forecasting, and dynamic modeling, allow analysts and decision-makers to better understand risks, explore various scenarios, and adapt models in real-time. By adopting these advanced methods, businesses can take their financial modeling capabilities to the next level, turning static models into dynamic, predictive tools for decision-making.
Monte Carlo Simulations
Monte Carlo simulations are a powerful tool for modeling uncertainty and risk in financial models. Rather than relying on a single set of assumptions, Monte Carlo simulations use random sampling to generate a range of possible outcomes based on variable inputs. This technique is particularly valuable in scenarios where uncertainty plays a major role, such as forecasting cash flows, evaluating investment opportunities, or assessing the risk of a financial portfolio.
In a typical Monte Carlo simulation, multiple inputs or assumptions are identified—these might include things like sales growth, cost of goods sold, or interest rates—and for each input, a probability distribution is assigned. This could involve using normal distributions, triangular distributions, or other statistical methods to represent how uncertain each variable is. Then, the simulation runs thousands or even millions of iterations, each with a different set of randomly generated values based on these distributions, and the model’s output is calculated each time.
What this process provides is a probability distribution of potential outcomes rather than a single forecast. For example, instead of just predicting that a company’s revenue will grow by 5% next year, a Monte Carlo simulation might show that there’s a 40% chance of 3% growth, a 30% chance of 5% growth, and a 30% chance of 7% growth. This insight is incredibly useful for decision-makers, as it highlights the range of possible outcomes and allows them to make more informed decisions with a clearer understanding of the associated risks.
Monte Carlo simulations are particularly valuable in complex models where multiple uncertain factors are at play. They are commonly used in risk management, investment portfolio optimization, and project valuation, providing a clearer picture of financial risk and helping businesses better prepare for various potential scenarios.
Forecasting with Machine Learning
Machine learning is transforming financial modeling by introducing predictive capabilities that go beyond traditional statistical techniques. While traditional forecasting methods rely on historical data and assumptions about future trends, machine learning models can learn from data patterns and make more accurate predictions about future outcomes.
The power of machine learning in financial forecasting lies in its ability to handle vast amounts of data and identify complex, non-linear relationships between variables that might not be immediately obvious. For example, machine learning algorithms can analyze past sales data, economic indicators, consumer behavior, and market trends to forecast future revenues with higher accuracy than linear regression models.
There are several types of machine learning techniques that can be used for financial forecasting, including supervised learning, unsupervised learning, and reinforcement learning. Supervised learning, in particular, is popular for forecasting because it uses labeled historical data to train the model, allowing it to predict future outcomes based on that training.
For instance, a company might use a supervised learning model to predict future demand for a product based on historical sales data, seasonal trends, and economic factors. Over time, the model will adjust its predictions as new data is input, becoming more accurate and responsive to changes in the market.
The advantage of using machine learning for forecasting is its ability to continuously improve. Traditional forecasting models may require manual updates or reworking of assumptions, while machine learning algorithms can automatically adapt to new information and fine-tune their predictions over time. This makes machine learning an incredibly powerful tool for businesses that need to make dynamic, real-time decisions based on large volumes of data.
Building Dynamic Financial Models
Building dynamic financial models involves creating models that are flexible, adaptable, and capable of reflecting real-time changes in the business environment. Unlike static models, which are typically built on a set of fixed assumptions and projections, dynamic models are designed to adjust to new inputs and evolving circumstances, allowing businesses to make decisions based on the most current information available.
Dynamic financial models are typically built using sophisticated modeling software or platforms that allow for real-time data integration, scenario testing, and automatic updates. These models enable businesses to simulate a wide variety of scenarios, such as changes in interest rates, fluctuations in currency values, or shifts in customer demand. By linking financial statements, assumptions, and forecasts to external data sources, dynamic models can automatically update in response to changes in key variables, providing decision-makers with up-to-the-minute insights.
One key aspect of building a dynamic financial model is ensuring that it is integrated with other systems and data sources, such as accounting software, CRM systems, or market data feeds. This integration ensures that the model reflects the most up-to-date financial information, and it allows for seamless updates and real-time analysis without the need for manual intervention.
Dynamic models are particularly valuable in environments characterized by uncertainty and rapid change, such as during periods of economic volatility or when a business is going through significant growth or restructuring. They provide businesses with the flexibility to adjust their strategies and assumptions in response to new data, ensuring that decisions are always based on the best available information.
The ability to run multiple scenarios, track real-time performance, and adjust variables dynamically makes these models an essential tool for financial analysts, CFOs, and executives looking to optimize business performance and navigate complex financial landscapes.
In summary, advanced financial modeling techniques such as Monte Carlo simulations, machine learning forecasting, and dynamic modeling offer significant advantages over traditional methods. These techniques provide deeper insights into risk, improve the accuracy of predictions, and offer greater flexibility in adapting to changes. By incorporating these methods into your financial models, you can better manage uncertainty, optimize decision-making, and position your business for long-term success.
Financial Modeling Best Practices
Creating accurate and reliable financial models requires more than just technical knowledge—it requires discipline, structure, and a thoughtful approach. Following best practices ensures that your models are both effective and robust, providing valuable insights for decision-makers. By adhering to these best practices, you minimize the risk of errors, improve the clarity of your model, and ensure that your findings are actionable and trustworthy.
- Keep the model simple and organized, focusing on key drivers and making it easy to navigate.
- Use clear, consistent naming conventions for cells and ranges to improve readability and avoid confusion.
- Link financial statements together (e.g., income statement, balance sheet, and cash flow) to ensure consistency and reduce manual updates.
- Document assumptions and sources of data, so others can understand the reasoning behind key decisions.
- Incorporate scenario analysis and sensitivity testing to understand the potential impact of changes in key variables.
- Use version control to track changes over time and ensure you can revert to previous versions if needed.
- Regularly update the model with actual financial data to track performance against forecasts and adjust assumptions as necessary.
- Ensure the model is flexible, allowing for easy modifications as new data becomes available or business conditions change.
By following these best practices, you can create financial models that are not only accurate but also adaptable and useful in dynamic business environments.
Common Pitfalls and How to Avoid Them
Financial modeling is a complex task that requires both technical expertise and a solid understanding of business dynamics. Even small mistakes can lead to significant errors in the model’s output, which can have a direct impact on decision-making. Avoiding common pitfalls is essential for ensuring that your financial models provide reliable insights and help achieve the desired business outcomes.
- Relying too heavily on inaccurate or outdated data can distort the results and lead to flawed conclusions. Always ensure that the data used in the model is current and accurate.
- Overcomplicating the model by including too many variables or unnecessary details can make it harder to understand and more prone to errors. Focus on the most important drivers and avoid unnecessary complexity.
- Failing to account for changes in business conditions or industry trends can lead to unrealistic assumptions. Regularly review assumptions and update them based on the latest market information.
- Neglecting to test for different scenarios and sensitivities can leave you unprepared for unexpected changes. Incorporating scenario analysis helps assess the potential impact of various outcomes and informs more strategic decision-making.
- Not documenting assumptions, sources, or methods can create confusion for other users and make the model difficult to maintain. Always include clear documentation for transparency and ease of use.
- Ignoring model transparency and failing to make the structure clear can result in errors that are hard to detect. Ensure that your model is structured logically, with clearly labeled inputs and outputs.
- Using overly optimistic assumptions without considering risk or downside scenarios can lead to overly confident decisions. Ensure your model reflects a balanced view of potential outcomes, including worst-case scenarios.
By being mindful of these pitfalls and addressing them during the modeling process, you can build more reliable and effective financial models that deliver valuable insights and drive sound decision-making.
Conclusion
In the world of business, understanding how to create and use financial models is essential for making informed decisions. These models provide a clear picture of a company’s financial health and future prospects, helping businesses plan for growth, assess risk, and manage uncertainty. Whether you’re working on revenue projections, evaluating investment opportunities, or simply trying to understand how different strategies will affect the bottom line, financial models allow you to approach decision-making with confidence. By using accurate data, solid assumptions, and the right tools, financial models can be a game-changer in driving your business forward.
As you’ve seen, there are various types of financial models tailored to different needs, whether it’s forecasting, budgeting, valuation, or more complex scenarios like mergers and acquisitions. Knowing the core components—like revenue projections, operating expenses, and cash flow—is key to building a solid model that truly reflects a business’s financial landscape. By following best practices, avoiding common pitfalls, and leveraging advanced techniques like machine learning or Monte Carlo simulations, you can create models that not only predict the future but also adapt to changes along the way. With these skills, you can turn financial data into a powerful tool for strategic planning, giving you the insights needed to make smarter, more profitable decisions.
Get Started With a Prebuilt Template!
Looking to streamline your business financial modeling process with a prebuilt customizable template? Say goodbye to the hassle of building a financial model from scratch and get started right away with one of our premium templates.
- Save time with no need to create a financial model from scratch.
- Reduce errors with prebuilt formulas and calculations.
- Customize to your needs by adding/deleting sections and adjusting formulas.
- Automatically calculate key metrics for valuable insights.
- Make informed decisions about your strategy and goals with a clear picture of your business performance and financial health.

