Have you ever wondered how businesses assess their financial health and make important decisions about investments, operations, and growth? Financial analysis provides the answers. From understanding profitability to evaluating risks and opportunities, financial analysis is a crucial tool that helps individuals and organizations make informed decisions based on data-driven insights. Whether you’re a business owner, investor, or financial professional, mastering the art of financial analysis is essential for navigating the complex landscape of finance and maximizing returns.
In this guide, we’ll delve into the fundamentals of financial analysis, exploring key concepts, techniques, and best practices to help you interpret financial data effectively, make sound decisions, and achieve your financial goals. From dissecting financial statements to analyzing ratios, trends, and patterns, this guide will equip you with the knowledge and skills needed to unlock the secrets hidden within the numbers and empower you to make smarter financial decisions in any situation.
What is Financial Analysis?
Financial analysis is the process of evaluating financial data, trends, and performance indicators to assess the financial health, stability, and profitability of an organization. It involves examining various financial statements, ratios, and metrics to derive insights and make informed decisions.
Financial analysis serves multiple purposes, including:
- Assessing Financial Health: Financial analysis helps stakeholders gauge the financial health and stability of a company by examining its liquidity, solvency, and profitability.
- Supporting Decision Making: Financial analysis provides valuable insights that aid in decision-making processes related to investments, financing, strategic planning, and risk management.
- Identifying Trends and Patterns: By analyzing historical financial data, trends, and patterns, financial analysis helps identify emerging opportunities, risks, and challenges.
- Monitoring Performance: Financial analysis enables organizations to monitor their financial performance, track progress towards goals, and identify areas for improvement.
- Communicating Financial Information: Financial analysis facilitates the communication of financial information to internal and external stakeholders, including investors, creditors, regulators, and management.
Importance of Financial Analysis in Decision-Making
Financial analysis plays a crucial role in decision-making processes across various areas of business and finance. Some key reasons why financial analysis is important in decision-making include:
- Risk Assessment: Financial analysis helps assess the financial risks associated with investment decisions, lending activities, and strategic initiatives. It provides insights into factors such as liquidity, solvency, and profitability, which impact the risk-return profile of decisions.
- Resource Allocation: Financial analysis aids in the allocation of resources, including capital, manpower, and assets, to maximize returns and achieve strategic objectives. It helps prioritize investment opportunities, budget allocations, and operational expenses based on their financial viability and impact.
- Performance Evaluation: Financial analysis enables organizations to evaluate their financial performance relative to goals, benchmarks, and industry peers. It helps identify areas of strength and weakness, measure efficiency and profitability, and assess the effectiveness of strategies and initiatives.
- Strategic Planning: Financial analysis informs strategic planning processes by providing insights into market trends, competitive dynamics, and financial implications. It helps organizations identify growth opportunities, assess potential risks, and develop actionable strategies to achieve long-term objectives.
- Investor Relations: Financial analysis plays a crucial role in investor relations by providing transparency and accountability to shareholders and investors. It helps build trust and confidence among investors by demonstrating sound financial management practices, performance metrics, and growth prospects.
Components of Financial Analysis
Financial analysis encompasses various components, including:
- Financial Statements: The primary sources of financial data, including the balance sheet, income statement, cash flow statement, and statement of retained earnings.
- Financial Ratios: Quantitative metrics calculated from financial data to assess different aspects of a company’s financial performance, liquidity, profitability, solvency, and efficiency.
- Trend Analysis: Examination of historical financial data to identify trends, patterns, and changes over time, providing insights into the company’s financial trajectory and performance drivers.
- Ratio Analysis: Comparative analysis of financial ratios, such as liquidity ratios, profitability ratios, and leverage ratios, to benchmark performance, identify trends, and evaluate financial health.
- Cash Flow Analysis: Evaluation of cash flow patterns, including operating, investing, and financing activities, to assess the company’s ability to generate cash, manage liquidity, and fund operations.
- Forecasting and Projections: Projection of future financial performance based on historical data, assumptions, and forecasts, enabling organizations to anticipate trends, set targets, and make informed decisions.
- Qualitative Factors: Consideration of qualitative factors, such as industry trends, market dynamics, regulatory environment, competitive landscape, and management capabilities, to provide context and complement quantitative analysis.
By integrating these components, financial analysis provides a comprehensive understanding of a company’s financial position, performance, and prospects, empowering decision-makers to make informed choices and drive organizational success.
Understanding Financial Statements
Financial statements are essential documents that provide a snapshot of a company’s financial health and performance. Understanding these statements is crucial for conducting comprehensive financial analysis. Let’s delve into the key components of financial statements:
Balance Sheet
The balance sheet, also known as the statement of financial position, presents a company’s financial position at a specific point in time. It provides a summary of its assets, liabilities, and shareholders’ equity. Here’s a deeper look into each component:
- Assets: Assets represent what the company owns and include items such as cash, accounts receivable, inventory, property, plant, and equipment. They are categorized as current assets (those expected to be converted into cash within one year) and non-current assets (those with a longer life span).
- Liabilities: Liabilities represent what the company owes to creditors and other parties. They include items such as accounts payable, loans, bonds payable, and accrued expenses. Like assets, liabilities are categorized as current liabilities (due within one year) and non-current liabilities (due beyond one year).
- Shareholders’ Equity: Shareholders’ equity, also known as owners’ equity or net worth, represents the residual interest in the company’s assets after deducting its liabilities. It includes common stock, additional paid-in capital, retained earnings, and accumulated other comprehensive income.
Understanding the balance sheet allows you to assess the company’s liquidity, solvency, and overall financial health.
Income Statement
The income statement, also referred to as the profit and loss statement, provides a summary of a company’s revenues, expenses, and net income or loss over a specific period, typically a quarter or a fiscal year. Let’s break down its components:
- Revenues: Revenues represent the income generated from the company’s primary business activities, such as sales of goods or services. They are sometimes referred to as sales or turnover.
- Expenses: Expenses are the costs incurred in the process of generating revenues. They include items such as cost of goods sold, operating expenses, interest expenses, and taxes.
- Net Income: Net income, also known as the bottom line or profit, is the residual amount after deducting expenses from revenues. A positive net income indicates profitability, while a negative net income signifies a loss.
Analyzing the income statement helps you understand the company’s revenue-generating capabilities, cost management strategies, and overall profitability.
Cash Flow Statement
The cash flow statement provides insight into how cash is generated and utilized by a company during a specific period. It is divided into three main sections:
- Operating Activities: This section reports cash inflows and outflows from the company’s primary business activities, such as sales and expenses. It reflects the company’s ability to generate cash from its core operations.
- Investing Activities: This section includes cash flows related to the buying and selling of long-term assets, such as property, plant, and equipment, as well as investments in securities. It indicates how the company is investing its resources for future growth.
- Financing Activities: This section includes cash flows related to borrowing and repaying debt, issuing and repurchasing stock, and paying dividends. It shows how the company is financing its operations and returning value to shareholders.
The cash flow statement helps assess the company’s liquidity, operating efficiency, and ability to meet its financial obligations.
Statement of Retained Earnings
The statement of retained earnings shows changes in a company’s retained earnings over a specific period, typically a fiscal year. It reconciles the beginning and ending balances of retained earnings and reflects net income or loss, dividends paid, and other adjustments. Understanding this statement is crucial for tracking the company’s reinvestment of profits into the business and distribution of dividends to shareholders.
In summary, understanding financial statements provides valuable insights into a company’s financial position, performance, and cash flow dynamics. Analyzing these statements helps you make informed decisions about investments, lending, and business operations.
Key Financial Ratios
Financial ratios are indispensable tools used to assess a company’s financial health and performance. By scrutinizing these ratios, you gain invaluable insights into various facets of a company’s operations, profitability, liquidity, solvency, and market prospects.
Liquidity Ratios
Liquidity ratios are fundamental indicators of a company’s ability to meet its short-term obligations with its short-term assets. These ratios provide a glimpse into the company’s liquidity position and its capacity to address immediate financial needs without disrupting its operations.
- Current Ratio: The current ratio evaluates the company’s ability to pay off its short-term liabilities with its short-term assets. It’s calculated as:
Current Ratio = Current Assets / Current Liabilities
A current ratio above 1 signifies that the company possesses more current assets than liabilities, indicating a favorable liquidity position. However, excessively high current ratios may suggest inefficient asset management or an inability to deploy resources effectively. - Quick Ratio (Acid-Test Ratio): This ratio provides a more stringent assessment of liquidity by excluding inventory from current assets. It measures the company’s capability to meet short-term obligations without relying on the sale of inventory, which may take time or result in lower prices. The quick ratio is calculated as:
Quick Ratio = (Current Assets – Inventory) / Current Liabilities
A quick ratio of 1 or higher indicates that the company can fulfill its short-term obligations without relying on the sale of inventory, which is particularly crucial in industries with rapidly changing demand or inventory obsolescence risks. - Cash Ratio: The cash ratio is the most conservative liquidity measure as it only considers cash and cash equivalents as assets. It provides insight into the company’s immediate liquidity position without accounting for other current assets. The cash ratio is calculated as:
Cash Ratio = (Cash and Cash Equivalents) / Current Liabilities
A higher cash ratio indicates a stronger ability to cover short-term liabilities with cash on hand, which may be reassuring for creditors and investors concerned about liquidity risks.
Profitability Ratios
Profitability ratios gauge a company’s ability to generate profits relative to its revenue, assets, and equity. These ratios offer insights into the company’s efficiency in utilizing its resources and generating returns for its shareholders.
- Gross Profit Margin: The gross profit margin measures the percentage of revenue retained after deducting the cost of goods sold (COGS). It indicates the company’s ability to manage production costs and set prices effectively. The gross profit margin is calculated as:
Gross Profit Margin = (Gross Profit / Revenue) * 100
A higher gross profit margin suggests that the company effectively controls production costs or commands higher prices for its products, indicating operational efficiency and competitive strength. - Operating Profit Margin: The operating profit margin evaluates the company’s operational efficiency by measuring the percentage of revenue retained after deducting operating expenses. It reflects the company’s ability to manage day-to-day operations effectively. The operating profit margin is calculated as:
Operating Profit Margin = (Operating Income / Revenue) * 100
An increasing operating profit margin over time may signify improving operational efficiency, while a declining margin may indicate escalating operating expenses or pricing pressures. - Net Profit Margin: The net profit margin represents the percentage of revenue that remains as net income after deducting all expenses, including taxes and interest. It reflects the company’s overall profitability and operational efficiency. The net profit margin is calculated as:
Net Profit Margin = (Net Income / Revenue) * 100
A higher net profit margin indicates better profitability and cost management, whereas a declining margin may signal deteriorating profitability due to increased expenses or declining revenues. - Return on Assets (ROA): Return on assets measures the company’s ability to generate profits relative to its total assets. It indicates how efficiently the company utilizes its assets to generate earnings. The return on assets is calculated as:
ROA = (Net Income / Average Total Assets) * 100
A higher ROA suggests that the company generates more profit per unit of assets, indicating efficient asset utilization and profitability. - Return on Equity (ROE): Return on equity measures the company’s profitability relative to its shareholders’ equity. It reflects the company’s ability to generate returns for its shareholders from the equity invested. The return on equity is calculated as:
ROE = (Net Income / Average Shareholders’ Equity) * 100
A higher ROE indicates that the company efficiently utilizes shareholder equity to generate profits, providing a measure of shareholder value creation.
Efficiency Ratios
Efficiency ratios assess a company’s effectiveness in managing its assets, liabilities, and resources to generate sales and profits. These ratios help evaluate the company’s operational efficiency and asset management practices.
- Asset Turnover Ratio: The asset turnover ratio measures the company’s efficiency in utilizing its assets to generate revenue. It indicates how effectively the company converts its assets into sales. The asset turnover ratio is calculated as:
Asset Turnover Ratio = Revenue / Average Total Assets
A higher asset turnover ratio suggests that the company generates more sales per dollar of assets, indicating efficient asset utilization and revenue generation. - Inventory Turnover Ratio: The inventory turnover ratio evaluates how quickly the company sells its inventory during a specific period. It indicates the efficiency of inventory management and the company’s ability to convert inventory into sales. The inventory turnover ratio is calculated as:
Inventory Turnover Ratio = Cost of Goods Sold / Average Inventory
A higher inventory turnover ratio suggests efficient inventory management, as the company sells its inventory quickly, minimizing holding costs and obsolescence risks. - Accounts Receivable Turnover Ratio: The accounts receivable turnover ratio measures how efficiently the company collects payments from its customers. It evaluates the effectiveness of the company’s credit policies and collection efforts. The accounts receivable turnover ratio is calculated as:
Accounts Receivable Turnover Ratio = Net Credit Sales / Average Accounts Receivable
A higher accounts receivable turnover ratio indicates that the company efficiently converts credit sales into cash, minimizing the risk of bad debts and improving cash flow.
Solvency Ratios
Solvency ratios assess a company’s ability to meet its long-term financial obligations and sustain its operations over the long term. These ratios help evaluate the company’s financial stability and its capacity to withstand financial distress.
- Debt-to-Equity Ratio: The debt-to-equity ratio compares the company’s total debt to its shareholders’ equity. It indicates the extent to which the company relies on debt financing relative to equity financing. The debt-to-equity ratio is calculated as:
Debt-to-Equity Ratio = Total Debt / Shareholders’ Equity
A lower debt-to-equity ratio suggests lower financial risk, as the company relies less on debt financing and has a stronger equity base. - Interest Coverage Ratio: The interest coverage ratio measures the company’s ability to meet its interest obligations on outstanding debt. It evaluates the company’s earnings relative to its interest expenses. The interest coverage ratio is calculated as:
Interest Coverage Ratio = Earnings Before Interest and Taxes (EBIT) / Interest Expense
A higher interest coverage ratio indicates that the company generates sufficient operating income to cover its interest expenses comfortably, reducing the risk of default.
Market Prospect Ratios
Market prospect ratios assess investors’ perception of a company’s future growth and profitability potential. These ratios help evaluate the company’s attractiveness as an investment opportunity.
- Price-to-Earnings (P/E) Ratio: The price-to-earnings ratio compares the company’s current share price to its earnings per share (EPS). It reflects investors’ willingness to pay for each dollar of earnings generated by the company. The price-to-earnings ratio is calculated as:
P/E Ratio = Market Price per Share / Earnings per Share
A higher P/E ratio may indicate that investors expect higher future earnings growth, while a lower P/E ratio may suggest undervaluation. - Earnings per Share (EPS): Earnings per share measures the company’s profitability on a per-share basis. It indicates the portion of the company’s earnings allocated to each outstanding share of common stock. Earnings per share are calculated as:
EPS = Net Income / Average Number of Outstanding Shares
A higher EPS indicates higher profitability and earnings potential for shareholders, which may attract investors seeking higher returns.
By analyzing these key financial ratios in conjunction with other relevant financial metrics, you can gain a comprehensive understanding of a company’s financial performance, strengths, weaknesses, and growth prospects. These insights are invaluable for making informed investment decisions, evaluating business strategies, and assessing financial risks.
Financial Analysis Techniques
Financial analysis techniques are essential tools used to interpret and evaluate financial data to derive meaningful insights about a company’s financial performance and position. Let’s explore each of these techniques in detail:
Vertical Analysis
Vertical analysis, also known as common-size analysis, involves expressing each line item on a financial statement as a percentage of a base figure. Typically, total assets are used as the base for the balance sheet, while total revenues are used for the income statement. This technique helps assess the relative proportion of each component within the financial statement and identify trends over time.
Vertical analysis allows you to compare different companies or assess changes within the same company over time, regardless of size. By standardizing the financial statements, vertical analysis facilitates meaningful comparisons and highlights areas of strength or weakness.
Horizontal Analysis
Horizontal analysis, also referred to as trend analysis, involves comparing financial data over multiple periods to identify trends and changes over time. It focuses on evaluating the absolute and percentage changes in financial statement line items, such as revenues, expenses, and net income, across consecutive periods.
Horizontal analysis enables you to assess the direction and magnitude of changes in key financial metrics over time, providing insights into the company’s performance trends and identifying potential areas for further investigation. By comparing historical data, you can detect patterns, identify anomalies, and make informed projections about future performance.
Ratio Analysis
Ratio analysis involves calculating and interpreting financial ratios to assess various aspects of a company’s financial performance and position. These ratios provide quantitative insights into liquidity, profitability, solvency, efficiency, and market prospects. Ratio analysis allows for benchmarking against industry peers, historical performance, and best practices.
Key categories of financial ratios include liquidity ratios, profitability ratios, solvency ratios, efficiency ratios, and market prospect ratios. Each category offers unique insights into different aspects of a company’s financial health and performance. Ratio analysis helps identify trends, evaluate financial strengths and weaknesses, and make informed decisions about investment, lending, and operational strategies.
Trend Analysis
Trend analysis involves identifying patterns and trends in financial data over time. It focuses on analyzing historical data to detect recurring patterns, cyclical fluctuations, and long-term trends in key financial metrics. Trend analysis helps forecast future performance, identify emerging opportunities or risks, and make proactive adjustments to business strategies.
Trend analysis can be applied to various financial metrics, including revenues, expenses, profits, and cash flows. By identifying underlying trends and patterns, you can anticipate changes in market conditions, consumer behavior, and industry dynamics, enabling more accurate forecasting and strategic decision-making.
DuPont Analysis
DuPont analysis, also known as the DuPont identity, breaks down the return on equity (ROE) into its component parts to identify the drivers of profitability. It decomposes ROE into three key ratios: net profit margin, asset turnover, and financial leverage. DuPont analysis helps assess the sources of a company’s profitability and identify areas for improvement.
- Net Profit Margin: Measures the percentage of revenue that remains as net income after deducting all expenses. It reflects the company’s operational efficiency and cost management practices.
- Asset Turnover: Measures how efficiently the company utilizes its assets to generate sales. It evaluates the company’s asset management and revenue generation capabilities.
- Financial Leverage: Measures the extent to which the company relies on debt financing to magnify returns on equity. It reflects the company’s capital structure and risk management practices.
By analyzing these components, DuPont analysis provides a holistic view of a company’s profitability drivers and helps identify strategies to enhance ROE. It enables management to focus on improving operational efficiency, asset utilization, and financial leverage to maximize shareholder value.
How to Interpret Financial Data?
Interpreting financial data is a critical aspect of financial analysis, enabling you to extract valuable insights from financial statements and other financial reports. Let’s explore the key aspects of interpreting financial data:
Identifying Trends and Patterns
Identifying trends and patterns in financial data involves analyzing historical data to detect recurring trends, cyclical fluctuations, and seasonality patterns. This analysis helps uncover underlying factors influencing the company’s financial performance and direction of change.
- Time-Series Analysis: Examining financial data over multiple periods allows you to identify trends and patterns. You can use graphical tools such as line charts or candlestick charts to visualize changes in key financial metrics over time.
- Seasonal Adjustments: Some industries experience seasonal fluctuations in revenue or expenses due to factors such as weather patterns, holidays, or economic cycles. By adjusting for seasonality, you can isolate underlying trends and make more accurate forecasts.
- Cyclical Analysis: Economic cycles can impact a company’s financial performance. Analyzing financial data in the context of broader economic trends helps identify cyclical patterns and anticipate changes in business conditions.
Comparing with Industry Standards
Comparing a company’s financial performance with industry benchmarks and standards provides valuable context and insights into its competitiveness and relative performance within its industry.
- Industry Ratios: Industry-specific financial ratios and benchmarks enable you to compare the company’s performance with industry peers. You can use industry reports, financial databases, or analyst research to access relevant industry data.
- Peer Analysis: Comparing key financial metrics with those of direct competitors helps identify areas of strength and weakness. You can benchmark performance indicators such as profitability, liquidity, and efficiency against industry leaders or comparable companies.
- Industry Trends: Understanding industry trends and dynamics helps interpret financial data in the context of broader market conditions. Industry reports, trade publications, and market research provide insights into industry growth prospects, competitive landscape, and regulatory developments.
Assessing Financial Health
Assessing a company’s financial health involves evaluating key financial indicators and ratios to determine its ability to meet its financial obligations and sustain its operations.
- Liquidity Analysis: Liquidity ratios assess the company’s ability to meet short-term obligations with its short-term assets. A healthy liquidity position ensures that the company can cover its immediate financial needs without resorting to external financing.
- Solvency Analysis: Solvency ratios evaluate the company’s ability to meet long-term financial obligations and sustain its operations over the long term. A strong solvency position indicates financial stability and resilience against adverse economic conditions.
- Profitability Analysis: Profitability ratios measure the company’s ability to generate profits relative to its revenue, assets, and equity. A profitable company demonstrates efficient operations and effective resource utilization.
Predicting Future Performance
Predicting future performance involves using historical data and financial analysis techniques to forecast future trends and outcomes. While financial forecasting involves inherent uncertainties, it provides valuable insights for decision-making and strategic planning.
- Forecasting Methods: Various methods, such as trend analysis, regression analysis, and time-series forecasting, can be used to predict future financial performance. These methods rely on historical data and statistical techniques to extrapolate future trends.
- Scenario Analysis: Scenario analysis involves evaluating multiple possible scenarios or outcomes based on different assumptions and variables. By considering various scenarios, you can assess the potential impact of different factors on future performance and develop contingency plans.
- Risk Assessment: Financial forecasting also involves assessing risks and uncertainties that may impact future performance. Sensitivity analysis helps quantify the impact of key variables on financial outcomes and identify potential sources of risk.
By interpreting financial data effectively, you can gain valuable insights into a company’s financial health, performance trends, and future prospects. This enables you to make informed decisions about investment, lending, and strategic planning, ultimately driving business success.
Financial Analysis Applications
Financial analysis serves as a powerful tool with diverse applications across various domains. Let’s explore the practical applications of financial analysis in detail:
Investment Decisions
Financial analysis plays a pivotal role in investment decisions, helping investors assess the financial health, performance, and growth prospects of potential investment opportunities.
- Fundamental Analysis: Investors use financial analysis to evaluate the intrinsic value of stocks or other securities based on factors such as earnings growth, profitability, and cash flow generation. Fundamental analysis helps identify undervalued or overvalued assets and make informed investment decisions.
- Valuation Techniques: Financial analysis techniques such as discounted cash flow (DCF) analysis, price-to-earnings (P/E) ratio analysis, and comparable company analysis (CCA) are used to estimate the fair value of assets and securities. These valuation techniques provide insights into the attractiveness of investment opportunities and potential returns.
- Risk Assessment: Financial analysis helps investors assess the risks associated with potential investments, including market risk, credit risk, and liquidity risk. By analyzing financial statements, ratios, and market trends, investors can gauge the risk-return trade-off and make risk-adjusted investment decisions.
Credit Decisions
Financial analysis is essential for assessing the creditworthiness of borrowers and making informed lending decisions.
- Credit Risk Assessment: Lenders use financial analysis to evaluate the creditworthiness of borrowers and assess the likelihood of default. By analyzing financial statements, cash flow projections, and credit history, lenders can determine the borrower’s ability to repay the loan and mitigate credit risk.
- Debt Capacity Analysis: Financial analysis helps lenders determine the optimal debt capacity of borrowers by assessing their ability to service debt obligations. Debt capacity analysis considers factors such as debt-to-equity ratios, interest coverage ratios, and cash flow adequacy to ensure borrowers can meet their debt obligations without financial distress.
- Collateral Valuation: Financial analysis assists lenders in evaluating the value of collateral pledged by borrowers to secure loans. By assessing the liquidity, marketability, and risk of collateral assets, lenders can determine the appropriate loan-to-value ratio and mitigate collateral risk.
Strategic Planning
Financial analysis informs strategic planning and decision-making by providing insights into a company’s financial position, performance, and competitive landscape.
- Budgeting and Forecasting: Financial analysis helps companies develop budgets and forecasts based on historical data and future projections. By analyzing financial trends, market dynamics, and business drivers, companies can set realistic financial goals and allocate resources effectively.
- Capital Budgeting: Financial analysis aids in evaluating investment projects and capital expenditures to determine their feasibility and potential return on investment. Capital budgeting techniques such as net present value (NPV), internal rate of return (IRR), and payback period analysis help prioritize investment opportunities and optimize capital allocation.
- Mergers and Acquisitions (M&A): Financial analysis plays a crucial role in evaluating potential M&A opportunities by assessing the financial performance, synergies, and valuation of target companies. Financial due diligence, valuation analysis, and post-merger integration planning rely on comprehensive financial analysis to mitigate risks and maximize value creation.
Performance Evaluation
Financial analysis enables companies to assess their financial performance, identify areas of strength and weakness, and measure progress towards strategic objectives.
- Key Performance Indicators (KPIs): Financial analysis helps companies develop and monitor key performance indicators to track progress and evaluate performance against benchmarks. KPIs such as return on investment (ROI), return on equity (ROE), and operating margin provide insights into profitability, efficiency, and overall financial health.
- Variance Analysis: Financial analysis facilitates variance analysis by comparing actual financial results to budgeted or forecasted figures. Variance analysis helps identify deviations from expected performance, analyze underlying causes, and take corrective actions to achieve financial targets.
- Benchmarking: Financial analysis enables companies to benchmark their financial performance against industry peers, competitors, or best practices. Benchmarking helps identify areas for improvement, set performance targets, and enhance competitiveness in the market.
Risk Management
Financial analysis plays a crucial role in identifying, assessing, and managing financial risks to safeguard the company’s assets and achieve strategic objectives.
- Risk Identification: Financial analysis helps identify various financial risks, including market risk, credit risk, liquidity risk, and operational risk. By analyzing financial statements, market trends, and internal controls, companies can identify potential risks and vulnerabilities.
- Risk Assessment: Financial analysis aids in assessing the severity and impact of financial risks on the company’s operations and financial performance. Risk assessment techniques such as scenario analysis, sensitivity analysis, and stress testing help quantify risks and prioritize risk mitigation strategies.
- Risk Mitigation: Financial analysis informs risk mitigation strategies by identifying control measures, hedging strategies, and contingency plans to mitigate financial risks. By implementing effective risk management practices, companies can minimize exposure to adverse events and enhance resilience in volatile environments.
By leveraging financial analysis across these diverse applications, companies, investors, and lenders can make informed decisions, mitigate risks, and achieve their financial objectives effectively.
Financial Analysis Tools and Software
When it comes to financial analysis, having the right tools and software can significantly enhance efficiency, accuracy, and productivity. Let’s explore some of the most commonly used tools and software for financial analysis:
Spreadsheet Tools and Templates
Spreadsheet tools such as Microsoft Excel and Google Sheets are widely used for financial analysis due to their flexibility, ease of use, and powerful features. These tools allow users to perform various financial calculations, create custom models, and visualize data effectively.
- Microsoft Excel: Excel is a versatile spreadsheet software used by professionals for financial modeling, budgeting, forecasting, and data analysis. It offers a wide range of functions, formulas, and features for performing complex financial calculations and creating dynamic reports.
- Google Sheets: Google Sheets is a cloud-based spreadsheet tool that provides collaborative features and real-time sharing capabilities. It offers similar functionality to Excel, allowing users to perform financial analysis tasks, collaborate with team members, and access data from anywhere with an internet connection.
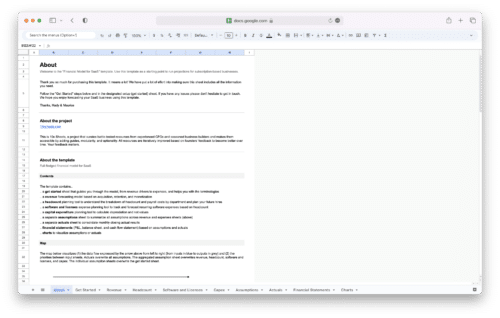
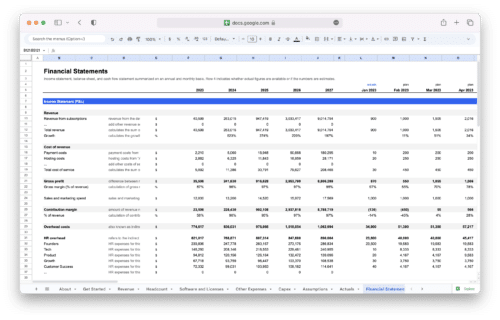
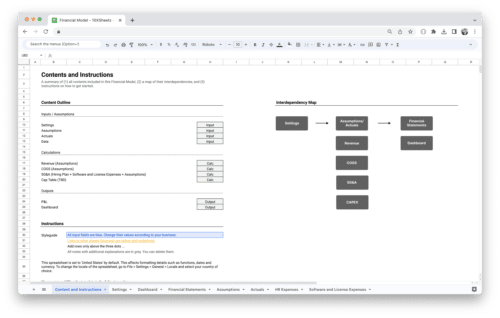
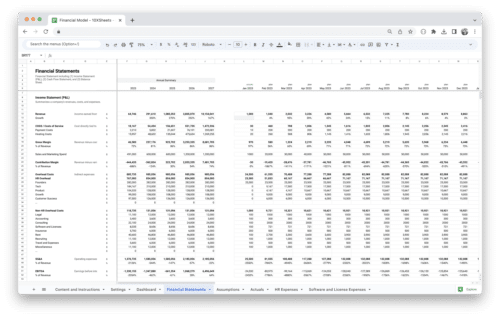
- Financial Analysis Templates: Both Excel and Google Sheets allow for the use of a variety of pre-built spreadsheet templates for financial analysis, including income statements, balance sheets, cash flow statements, and financial ratios. These templates provide a starting point for conducting financial analysis and can be customized to suit specific needs.
Financial Analysis Software
Financial analysis software offers advanced features and functionality tailored specifically for financial professionals, analysts, and investors. These software solutions automate complex calculations, provide in-depth analysis tools, and offer sophisticated reporting capabilities.
- Intuit QuickBooks: QuickBooks is accounting software designed for small and medium-sized businesses to manage financial transactions, track expenses, and generate financial reports. It offers features for budgeting, forecasting, and cash flow analysis, making it a valuable tool for financial analysis.
- Oracle Hyperion Financial Management (HFM): HFM is an enterprise performance management software that provides advanced financial consolidation, reporting, and analysis capabilities. It enables organizations to streamline financial processes, improve accuracy, and gain insights into financial performance.
- SAP BusinessObjects Planning and Consolidation (BPC): BPC is a financial planning and consolidation software that helps organizations streamline budgeting, planning, forecasting, and financial reporting processes. It integrates with SAP ERP systems and provides real-time visibility into financial data for informed decision-making.
Data Visualization Tools
Data visualization tools enable users to create visual representations of financial data, such as charts, graphs, and dashboards, to enhance understanding and insight.
- Tableau: Tableau is a leading data visualization software that allows users to create interactive dashboards, reports, and visualizations from various data sources, including financial data. It enables users to explore trends, identify patterns, and communicate insights effectively.
- Microsoft Power BI: Power BI is a business analytics tool that provides self-service data visualization and analysis capabilities. It allows users to connect to multiple data sources, create interactive dashboards, and share insights with stakeholders.
- Google Looker Studio: Looker Studio, or Data Studio, is a free data visualization tool offered by Google that enables users to create custom dashboards and reports using data from various sources, including Google Sheets, Google Analytics, and Google Ads. It provides intuitive drag-and-drop functionality and seamless integration with other Google services.
By leveraging these tools and software solutions, financial professionals, analysts, and decision-makers can streamline financial analysis processes, gain deeper insights into financial data, and make more informed decisions. Whether you’re a small business owner, a financial analyst, or an investor, having access to the right tools can make a significant difference in your ability to analyze and interpret financial information effectively.
Financial Analysis Challenges
Financial analysis comes with its set of challenges that analysts and professionals need to overcome to derive accurate insights and make informed decisions. Some common challenges include:
- Data Accuracy: Ensuring the accuracy and reliability of financial data is essential for meaningful analysis. Inaccurate or incomplete data can lead to erroneous conclusions and decisions.
- Data Complexity: Financial data can be complex, especially for large organizations with diverse operations and multiple subsidiaries. Consolidating and reconciling data from different sources can be challenging and time-consuming.
- Time Constraints: Financial analysts often face tight deadlines for preparing reports, conducting analysis, and delivering insights to stakeholders. Time constraints can compromise the thoroughness and quality of analysis.
- Assumptions and Estimates: Financial analysis often relies on assumptions and estimates, particularly for forecasting and valuation purposes. However, these assumptions may be subjective and can introduce uncertainty into the analysis.
- Regulatory Compliance: Compliance with regulatory requirements and accounting standards adds complexity to financial analysis. Ensuring adherence to relevant regulations and guidelines is crucial for accuracy and credibility.
- Interpretation Bias: The interpretation of financial data can be subjective and influenced by personal biases or preconceptions. Objectivity is essential to avoid misinterpretation and ensure unbiased analysis.
- External Factors: External factors such as economic conditions, market volatility, and geopolitical events can impact financial analysis. Analysts need to consider these external factors when interpreting financial data and making projections.
- Technology Limitations: Outdated or inadequate technology infrastructure can hinder financial analysis processes. Lack of automation, integration, and scalability can impede efficiency and productivity.
Financial Analysis Best Practices
To overcome the challenges associated with financial analysis and ensure accuracy, reliability, and relevance, practitioners should adhere to best practices. Some key best practices include:
- Data Quality Assurance: Establishing robust data quality assurance processes to ensure the accuracy, completeness, and consistency of financial data.
- Advanced Analytics: Leveraging advanced analytics techniques such as machine learning, predictive modeling, and data visualization to derive deeper insights from financial data.
- Continuous Learning: Keeping abreast of industry trends, regulatory changes, and technological advancements through continuous learning and professional development.
- Cross-Functional Collaboration: Collaborating with colleagues from different departments, such as finance, accounting, operations, and IT, to gain diverse perspectives and insights.
- Risk Management: Integrating risk management practices into financial analysis to identify, assess, and mitigate financial risks effectively.
- Scenario Planning: Conducting scenario analysis and stress testing to evaluate the impact of various scenarios on financial performance and resilience.
- Transparency and Communication: Maintaining transparency and open communication with stakeholders to ensure clarity, trust, and alignment of objectives.
- Automation and Integration: Embracing automation and integrating financial analysis tools and systems to streamline processes, enhance efficiency, and reduce manual errors.
- Documentation and Audit Trails: Documenting assumptions, methodologies, and analysis processes to provide transparency and facilitate audit trails.
By adopting these best practices, financial analysts and professionals can enhance the effectiveness, reliability, and credibility of their financial analysis efforts, ultimately supporting better decision-making and driving organizational success.
Conclusion
Financial analysis is not just about crunching numbers; it’s about gaining insights that drive smart decision-making. By understanding the financial health of a business, you can identify opportunities for growth, mitigate risks, and optimize resources effectively. Whether you’re a business owner, investor, or financial professional, the skills learned from this guide will empower you to navigate the complexities of finance with confidence and clarity.
Remember, financial analysis is a journey of continuous learning and improvement. As you apply the techniques and best practices outlined in this guide, don’t hesitate to seek additional resources, collaborate with experts, and adapt to changing circumstances. By staying informed, staying curious, and staying analytical, you can unlock the full potential of financial analysis to achieve your goals and secure a brighter financial future.
Get Started With a Prebuilt Template!
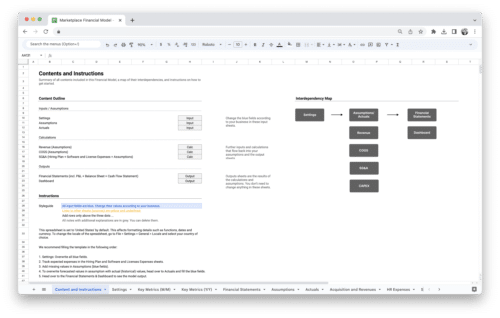
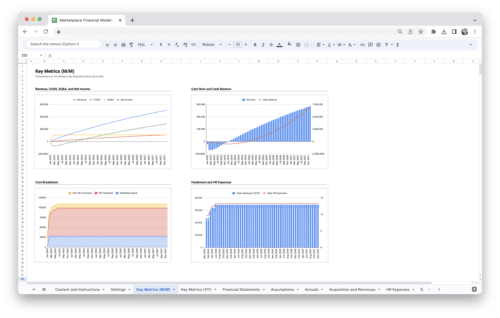
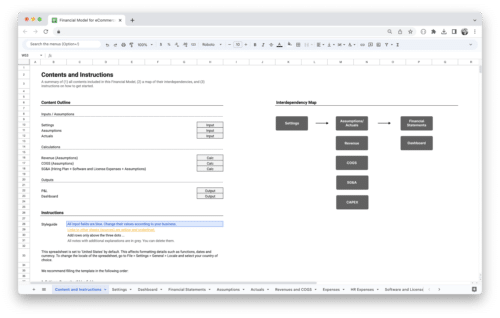
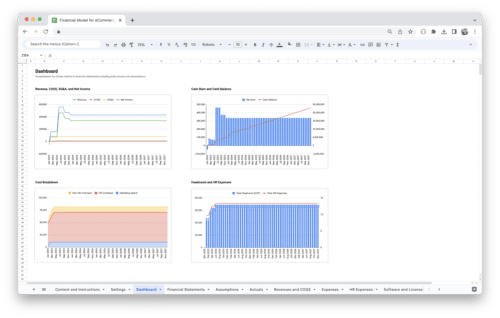
Looking to streamline your business financial modeling process with a prebuilt customizable template? Say goodbye to the hassle of building a financial model from scratch and get started right away with one of our premium templates.
- Save time with no need to create a financial model from scratch.
- Reduce errors with prebuilt formulas and calculations.
- Customize to your needs by adding/deleting sections and adjusting formulas.
- Automatically calculate key metrics for valuable insights.
- Make informed decisions about your strategy and goals with a clear picture of your business performance and financial health.

