Are you curious about how businesses optimize their operations and financial health to achieve success? Efficiency ratios hold the key to understanding the inner workings of companies across various industries.
In this guide, we’ll delve into the world of efficiency ratios, exploring their definitions, calculations, significance in financial analysis, practical examples, and strategies for improvement. Whether you’re an investor seeking insights into company performance or a business manager aiming to enhance operational efficiency, this guide will equip you with the knowledge and tools to navigate the realm of efficiency ratios with confidence.
What Are Efficiency Ratios?
Efficiency ratios are financial metrics used to assess a company’s ability to utilize its resources effectively in generating profits and cash flow. These ratios provide insights into various aspects of a company’s operations, such as inventory management, accounts receivable and payable, and asset utilization. By evaluating efficiency ratios, stakeholders can gauge the operational efficiency and financial health of a business.
Importance in Financial Analysis
Efficiency ratios are vital for conducting thorough financial analysis and evaluating a company’s operational performance. Here’s why they are important:
- Operational Efficiency: Efficiency ratios offer insights into how efficiently a company manages its resources and conducts its day-to-day operations. By analyzing these ratios, stakeholders can identify areas where the company excels and areas where improvements are needed to enhance operational efficiency.
- Financial Health: Efficiency ratios provide indicators of a company’s financial health and stability. For example, high inventory turnover and accounts receivable turnover ratios may suggest strong liquidity and effective management of working capital, while low ratios could indicate potential liquidity challenges or inefficiencies in operations.
- Profitability: Efficient utilization of resources, as reflected in high efficiency ratios, often correlates with improved profitability. Companies that effectively manage their inventory, receivables, payables, and assets are better positioned to generate higher revenues and profits.
- Risk Assessment: Efficiency ratios help assess the risks associated with a company’s operations and financial performance. For example, high levels of inventory turnover may indicate lower inventory carrying costs but could also suggest increased risk of stockouts. By analyzing efficiency ratios, stakeholders can identify and mitigate operational and financial risks.
- Comparative Analysis: Efficiency ratios allow for comparisons with industry benchmarks and competitors’ performance. Benchmarking against industry peers helps stakeholders evaluate a company’s relative performance and identify areas for improvement. Additionally, comparative analysis provides insights into industry trends and best practices.
- Decision-Making: Efficiency ratios inform strategic decision-making processes by providing data-driven insights into a company’s operations and financial performance. Whether assessing investment opportunities, evaluating expansion strategies, or making operational improvements, efficiency ratios play a crucial role in guiding decision-makers.
In summary, efficiency ratios are essential tools in financial analysis, providing valuable insights into a company’s operational efficiency, financial health, profitability, and risk profile. By understanding and analyzing these ratios, stakeholders can make informed decisions and drive sustainable growth and success.
Types of Efficiency Ratios
Efficiency ratios come in various forms, each focusing on different aspects of a company’s operations and financial performance. Let’s delve into the main types of efficiency ratios and explore how they offer unique insights into a company’s efficiency and effectiveness.
Inventory Turnover Ratios
Inventory turnover ratios are fundamental metrics that assess how efficiently a company manages its inventory. This ratio indicates how quickly a company sells and replenishes its inventory within a given period, reflecting its ability to convert inventory into sales. A high inventory turnover ratio suggests that a company effectively manages its inventory levels, minimizes excess stock, and avoids inventory obsolescence. On the other hand, a low ratio may indicate inventory management issues, such as overstocking or slow-moving inventory.
Formula:
Inventory Turnover Ratio = Cost of Goods Sold / Average Inventory
For example, suppose a retail company has a cost of goods sold (COGS) of $1,000,000 and an average inventory value of $200,000. The inventory turnover ratio would be calculated as follows:
Inventory Turnover Ratio = $1,000,000 / $200,000
Inventory Turnover Ratio = 5
This means that the company’s inventory turns over five times within the given period, indicating efficient inventory management.
Accounts Receivable Turnover Ratios
Accounts receivable turnover ratios assess how efficiently a company collects payments from its customers. This ratio measures the number of times a company collects its average accounts receivable balance within a specific period, indicating the effectiveness of its credit and collection policies. A high accounts receivable turnover ratio suggests that a company efficiently manages its credit sales and promptly collects payments from customers. Conversely, a low ratio may indicate issues with credit management or difficulties in collecting receivables.
Formula:
Accounts Receivable Turnover Ratio = Net Credit Sales / Average Accounts Receivable
For instance, if a company has net credit sales of $500,000 and an average accounts receivable balance of $100,000, the accounts receivable turnover ratio would be calculated as follows:
Accounts Receivable Turnover Ratio = $500,000 / $100,000
Accounts Receivable Turnover Ratio = 5
This means that the company collects its average accounts receivable balance five times within the specified period.
Accounts Payable Turnover Ratios
Accounts payable turnover ratios evaluate how efficiently a company manages its payments to suppliers. This ratio measures the frequency with which a company settles its accounts payable within a given period, indicating its ability to effectively manage vendor relationships and cash flow. A high accounts payable turnover ratio suggests that a company efficiently utilizes trade credit terms and maintains favorable payment terms with suppliers. Conversely, a low ratio may indicate liquidity issues or challenges in managing payables.
Formula:
Accounts Payable Turnover Ratio = Total Purchases / Average Accounts Payable
For example, if a company has total purchases of $800,000 and an average accounts payable balance of $160,000, the accounts payable turnover ratio would be calculated as follows:
Accounts Payable Turnover Ratio = $800,000 / $160,000
Accounts Payable Turnover Ratio = 5
This indicates that the company settles its accounts payable balance five times within the specified period.
Asset Turnover Ratios
Asset turnover ratios assess how efficiently a company utilizes its assets to generate revenue. This ratio measures the company’s ability to generate sales relative to its total assets, reflecting its efficiency in asset utilization. A high asset turnover ratio indicates that a company effectively utilizes its assets to generate revenue, while a low ratio may suggest underutilization of assets or inefficient operations.
Formula:
Asset Turnover Ratio = Net Sales / Average Total Assets
For instance, if a company has net sales of $1,000,000 and average total assets of $500,000, the asset turnover ratio would be calculated as follows:
Asset Turnover Ratio = $1,000,000 / $500,000
Asset Turnover Ratio = 2
This means that the company generates $2 in sales for every $1 of assets invested, indicating efficient asset utilization.
Fixed Asset Turnover Ratios
Fixed asset turnover ratios measure how efficiently a company utilizes its fixed assets, such as property, plant, and equipment, to generate revenue. This ratio assesses the effectiveness of a company’s capital investments in fixed assets. A high fixed asset turnover ratio indicates efficient utilization of fixed assets to generate sales, while a low ratio may suggest underutilization or inefficiencies in managing fixed assets.
Formula:
Fixed Asset Turnover Ratio = Net Sales / Average Fixed Assets
For example, if a company has net sales of $800,000 and average fixed assets of $400,000, the fixed asset turnover ratio would be calculated as follows:
Fixed Asset Turnover Ratio = $800,000 / $400,000
Fixed Asset Turnover Ratio = 2
This indicates that the company generates $2 in sales for every $1 invested in fixed assets, reflecting efficient utilization.
How to Calculate Efficiency Ratios?
Efficiency ratios are essential tools for evaluating a company’s operational performance and financial health. Understanding how to calculate these ratios accurately is crucial for making informed decisions.
Formulas and Components
Each efficiency ratio has its unique formula and components derived from a company’s financial statements, such as the income statement and balance sheet. Let’s delve into the formulas and components of some common efficiency ratios:
- Inventory Turnover Ratio: Inventory Turnover Ratio = Cost of Goods Sold / Average Inventory
Components: Cost of Goods Sold (COGS), Average Inventory - Accounts Receivable Turnover Ratio: Accounts Receivable Turnover Ratio = Net Credit Sales / Average Accounts Receivable
Components: Net Credit Sales, Average Accounts Receivable - Accounts Payable Turnover Ratio: Accounts Payable Turnover Ratio = Total Purchases / Average Accounts Payable
Components: Total Purchases, Average Accounts Payable - Asset Turnover Ratio: Asset Turnover Ratio = Net Sales / Average Total Assets
Components: Net Sales, Average Total Assets - Fixed Asset Turnover Ratio: Fixed Asset Turnover Ratio = Net Sales / Average Fixed Assets
Components: Net Sales, Average Fixed Assets
Interpretation of Results
Interpreting the results of efficiency ratios is essential for gaining insights into a company’s operational efficiency and financial performance. Here’s how to interpret the results of efficiency ratios:
- High Ratios: A high ratio indicates that a company is effectively utilizing its resources to generate revenue. For example, a high inventory turnover ratio suggests efficient inventory management, while a high asset turnover ratio indicates efficient asset utilization.
- Low Ratios: Conversely, a low ratio may signify inefficiencies or challenges within the company’s operations. For instance, a low accounts receivable turnover ratio may indicate difficulties in collecting payments from customers, while a low asset turnover ratio may suggest underutilization of assets.
Industry Benchmarks
Comparing a company’s efficiency ratios to industry benchmarks provides valuable context and insights into its performance relative to competitors. Industry benchmarks are typically derived from aggregated data of companies within the same industry or sector. By comparing a company’s efficiency ratios to industry averages or best practices, you can identify areas of strength and opportunities for improvement.
Industry benchmarks may vary depending on factors such as the company’s size, geographic location, and industry dynamics. It’s essential to consider these factors when benchmarking efficiency ratios to ensure meaningful comparisons.
For example, if the average inventory turnover ratio for similar companies in the retail industry is 8, but a company’s ratio is only 5, it may indicate that the company’s inventory management practices are less efficient compared to industry peers. Identifying such disparities can help companies identify areas for improvement and implement strategies to enhance operational efficiency.
Importance of Efficiency Ratios in Business
Efficiency ratios play a pivotal role in evaluating a company’s operational effectiveness, financial health, and overall performance. Let’s explore the significance of efficiency ratios and how they benefit businesses:
- Operational Efficiency: Efficiency ratios provide valuable insights into how well a company utilizes its resources, such as inventory, receivables, payables, and assets, to generate revenue. By measuring key aspects of operations, efficiency ratios help identify inefficiencies, streamline processes, and optimize resource allocation.
- Cash Flow Management: Efficient management of working capital, including inventory, receivables, and payables, is crucial for maintaining healthy cash flow. Efficiency ratios, such as inventory turnover and accounts receivable turnover, help assess the effectiveness of cash flow management strategies. By monitoring these ratios, businesses can identify cash flow bottlenecks, improve collection processes, and optimize cash conversion cycles.
- Working Capital Optimization: Effective management of working capital is essential for sustaining day-to-day operations and supporting business growth. Efficiency ratios related to inventory, receivables, and payables provide insights into the liquidity and efficiency of working capital management. By optimizing working capital levels and turnover rates, businesses can enhance liquidity, reduce financing costs, and improve overall financial performance.
- Identifying Strengths and Weaknesses: Efficiency ratios allow businesses to identify areas of strength and weakness within their operations. By comparing ratios to industry benchmarks and historical performance, companies can pinpoint areas for improvement and implement targeted strategies to enhance efficiency and profitability.
- Investor and Lender Confidence: Efficiency ratios serve as important indicators of a company’s operational and financial health, influencing investor and lender confidence. Strong efficiency ratios demonstrate effective management practices and operational excellence, which can attract investment and favorable financing terms. Conversely, poor efficiency ratios may raise concerns among investors and lenders about the company’s ability to generate returns and manage risk effectively.
- Strategic Decision-Making: Efficiency ratios provide valuable data for strategic decision-making. By analyzing trends and patterns in efficiency ratios over time, businesses can make informed decisions regarding resource allocation, pricing strategies, inventory management, and capital investments. This data-driven approach helps businesses adapt to changing market conditions, optimize performance, and achieve long-term growth objectives.
How to Analyze Efficiency Ratios?
Efficiency ratios provide valuable insights into a company’s operational performance and financial health. Analyzing these ratios involves examining trends, patterns, and deviations to gain a deeper understanding of the company’s efficiency and effectiveness. Let’s explore how to analyze efficiency ratios in detail.
Trends and Patterns
Analyzing trends and patterns in efficiency ratios involves examining how these ratios evolve over time. By tracking changes in efficiency ratios across multiple periods, you can identify whether the company’s operational performance is improving, deteriorating, or remaining stable.
- Long-Term Trends: Assessing efficiency ratios over several years allows you to identify long-term trends and patterns. Consistent improvements in efficiency ratios indicate effective management practices and operational enhancements. Conversely, declining efficiency ratios may signal underlying issues that require attention.
- Seasonal Variations: Some industries experience seasonal fluctuations in business activity, which can impact efficiency ratios. Analyzing efficiency ratios on a seasonal basis helps identify recurring patterns and adjust operational strategies accordingly. For example, retailers may experience higher inventory turnover ratios during peak shopping seasons.
- Comparative Analysis: Comparing a company’s efficiency ratios to industry benchmarks and competitors’ performance provides valuable context. Understanding how a company’s efficiency ratios stack up against peers helps assess its relative performance and identify areas for improvement.
Interpreting Deviations
Interpreting deviations in efficiency ratios involves understanding the reasons behind unexpected changes or fluctuations. Deviations from historical trends or industry norms may indicate underlying operational challenges, market dynamics, or external factors affecting the business.
- Root Cause Analysis: Investigating the root causes of deviations in efficiency ratios is essential for identifying underlying issues. For example, a sudden decrease in inventory turnover ratio may result from overstocking, slowing sales, or supply chain disruptions. Conducting thorough root cause analysis helps pinpoint the source of the deviation and develop targeted solutions.
- Operational Changes: Changes in business processes, strategies, or market conditions can impact efficiency ratios. For instance, implementing new inventory management systems or adjusting credit policies may influence inventory turnover and accounts receivable turnover ratios. Analyzing how operational changes affect efficiency ratios helps assess the effectiveness of strategic initiatives.
Correlation with Other Financial Metrics
Efficiency ratios are interconnected with other financial metrics, reflecting various aspects of a company’s performance. Examining the correlation between efficiency ratios and other financial metrics provides valuable insights into the overall financial health and operational efficiency of the company.
- Profitability Metrics: Efficiency ratios, such as asset turnover and fixed asset turnover, are closely linked to profitability metrics like return on assets (ROA) and return on equity (ROE). Higher efficiency ratios generally lead to improved profitability, as companies effectively utilize their resources to generate revenue.
- Liquidity Metrics: Efficiency ratios also impact liquidity metrics, such as the current ratio and quick ratio. Efficient management of working capital, reflected in high inventory turnover and accounts receivable turnover ratios, improves liquidity and ensures the company’s ability to meet short-term obligations.
- Debt Management Metrics: Effective management of accounts payable turnover ratios influences debt management metrics, such as the debt-to-equity ratio and interest coverage ratio. By optimizing accounts payable turnover, companies can reduce reliance on external financing and minimize interest expenses.
Analyzing the correlation between efficiency ratios and other financial metrics provides a holistic view of the company’s financial performance and helps identify areas for improvement across different aspects of the business.
How to Improve Efficiency Ratios?
Efficiency ratios serve as valuable indicators of a company’s operational effectiveness and financial health. Improving these ratios involves implementing targeted strategies and initiatives to enhance various aspects of the business operations. Let’s explore effective strategies for improving efficiency ratios in detail.
Strategies for Inventory Management
Efficient inventory management is critical for optimizing working capital, reducing costs, and improving profitability. Here are some strategies to enhance inventory management efficiency:
- ABC Analysis: Classify inventory items based on their value and prioritize management efforts accordingly. Focus on optimizing the management of high-value items while minimizing costs associated with low-value items.
- Just-in-Time (JIT) Inventory: Implement JIT inventory systems to minimize excess inventory levels and reduce carrying costs. By synchronizing production with demand, companies can improve inventory turnover ratios and minimize the risk of obsolescence.
- Inventory Forecasting: Utilize demand forecasting techniques to predict future demand and adjust inventory levels accordingly. Accurate demand forecasting helps prevent stockouts and excess inventory, leading to improved inventory turnover ratios.
- Supplier Collaboration: Establish collaborative relationships with suppliers to optimize procurement processes, reduce lead times, and ensure timely deliveries. Negotiate favorable pricing terms and implement vendor-managed inventory (VMI) programs to improve inventory turnover and lower costs.
Optimizing Accounts Receivable
Efficient management of accounts receivable is essential for maintaining healthy cash flow and minimizing bad debt losses. Here are some strategies to optimize accounts receivable efficiency:
- Credit Policies: Establish clear and consistent credit policies to assess customer creditworthiness, set credit limits, and define payment terms. Conduct regular credit checks and monitor customer payment behaviors to mitigate the risk of late payments and bad debts.
- Invoicing Processes: Streamline invoicing processes to ensure accurate and timely billing. Provide clear payment instructions and incentives for early payment to encourage prompt settlements. Utilize electronic invoicing systems to expedite invoice delivery and improve cash flow.
- Collections Management: Implement effective collections management practices to follow up on overdue invoices promptly. Develop escalation procedures for delinquent accounts and leverage automated reminders and collection letters to expedite payment collections.
- Customer Relationships: Foster positive relationships with customers through proactive communication and exceptional service. Address customer inquiries and resolve disputes promptly to maintain goodwill and encourage timely payments.
Streamlining Accounts Payable
Efficient management of accounts payable is essential for optimizing cash flow, managing vendor relationships, and minimizing costs. Here are some strategies to streamline accounts payable processes:
- Vendor Negotiations: Negotiate favorable payment terms, discounts, and pricing with suppliers to optimize cash flow and reduce costs. Consolidate purchases and leverage bulk buying to negotiate better terms with vendors.
- Invoice Processing Automation: Implement automated invoice processing systems to streamline invoice receipt, verification, and approval processes. Utilize optical character recognition (OCR) technology to digitize and automate data entry tasks, reducing manual errors and processing times.
- Payment Optimization: Optimize payment schedules to take advantage of early payment discounts while preserving cash flow. Prioritize payments based on vendor terms, discounts, and cash availability to maximize savings and maintain positive supplier relationships.
- Supplier Relationships: Cultivate strong relationships with suppliers through open communication, transparency, and timely payments. Establish clear channels for addressing invoicing discrepancies and resolving payment issues promptly to maintain trust and reliability.
Enhancing Asset Utilization
Efficient utilization of assets is essential for maximizing operational efficiency and profitability. Here are some strategies to enhance asset utilization:
- Asset Tracking and Monitoring: Implement asset tracking systems to monitor the location, condition, and usage of assets in real-time. Utilize asset management software to track depreciation, maintenance schedules, and performance metrics.
- Maintenance Optimization: Develop proactive maintenance schedules to prevent downtime and extend the lifespan of assets. Conduct regular inspections, repairs, and preventive maintenance activities to ensure optimal asset performance and reliability.
- Asset Sharing: Explore opportunities for asset sharing or leasing to minimize idle time and maximize utilization rates. Collaborate with other businesses or departments to share underutilized assets and reduce ownership costs.
- Capacity Planning: Conduct regular capacity planning assessments to ensure that assets are utilized efficiently and effectively. Identify underutilized assets and explore opportunities to reallocate resources or adjust production schedules to optimize capacity utilization.
By implementing these strategies and continuously monitoring efficiency ratios, companies can enhance operational performance, improve financial health, and achieve sustainable growth.
Efficiency Ratios Examples
Examining real-world examples can provide practical insights into how efficiency ratios are calculated, interpreted, and used in financial analysis. Let’s explore several examples illustrating the application of efficiency ratios in different industries and scenarios.
Example 1: Retail Industry
Consider a retail company that sells consumer electronics. To assess its inventory management efficiency, we can calculate the inventory turnover ratio. Suppose the company had cost of goods sold (COGS) of $2,000,000 and an average inventory value of $500,000 during the year.
Inventory Turnover Ratio = Cost of Goods Sold / Average Inventory
Inventory Turnover Ratio = $2,000,000 / $500,000 = 4
With an inventory turnover ratio of 4, it indicates that the company turns over its inventory four times during the year. This suggests relatively efficient inventory management, as the company is effectively converting inventory into sales.
Example 2: Manufacturing Industry
In the manufacturing sector, efficient utilization of fixed assets is critical for profitability. Let’s consider a manufacturing company that produces automotive components. We’ll calculate the fixed asset turnover ratio to assess how effectively the company utilizes its fixed assets to generate revenue.
Suppose the company had net sales of $5,000,000 and average fixed assets of $1,500,000 during the year.
Fixed Asset Turnover Ratio = Net Sales / Average Fixed Assets
Fixed Asset Turnover Ratio = $5,000,000 / $1,500,000 = 3.33
With a fixed asset turnover ratio of 3.33, it indicates that the company generates $3.33 in sales for every $1 of fixed assets invested. This suggests efficient utilization of fixed assets in generating revenue.
Example 3: Service Industry
Efficient management of accounts receivable is crucial for service-based businesses. Let’s consider a consulting firm that provides professional services to clients. We’ll calculate the accounts receivable turnover ratio to assess how quickly the firm collects payments from its clients.
Suppose the consulting firm had net credit sales of $1,200,000 and an average accounts receivable balance of $200,000 during the year.
Accounts Receivable Turnover Ratio = Net Credit Sales / Average Accounts Receivable
Accounts Receivable Turnover Ratio = $1,200,000 / $200,000 = 6
With an accounts receivable turnover ratio of 6, it indicates that the consulting firm collects its average accounts receivable balance six times during the year. This suggests efficient management of accounts receivable and effective credit collection practices.
These examples demonstrate how efficiency ratios can be applied across different industries to assess operational performance, financial health, and profitability. By analyzing efficiency ratios in context, businesses can identify areas for improvement and implement strategies to enhance efficiency and competitiveness.
Conclusion
Efficiency ratios serve as indispensable tools for evaluating a company’s operational efficiency and financial health. By examining key metrics such as inventory turnover, accounts receivable turnover, and asset utilization, stakeholders gain valuable insights into how effectively a company utilizes its resources to generate profits. These ratios not only help identify areas for improvement but also facilitate informed decision-making, whether it’s optimizing inventory management, streamlining accounts payable processes, or enhancing asset utilization. Armed with a deeper understanding of efficiency ratios and their significance, investors, lenders, and business managers can make better-informed decisions to drive sustainable growth and success.
Efficiency ratios offer a window into the inner workings of businesses, shedding light on their ability to manage resources, generate cash flow, and maximize profitability. From analyzing trends and patterns to interpreting deviations and benchmarking against industry peers, the insights gleaned from efficiency ratios are invaluable for strategic planning and performance evaluation. By continuously monitoring efficiency ratios and implementing targeted strategies for improvement, companies can enhance operational efficiency, mitigate risks, and position themselves for long-term success in today’s competitive landscape.
Get Started With a Prebuilt Template!
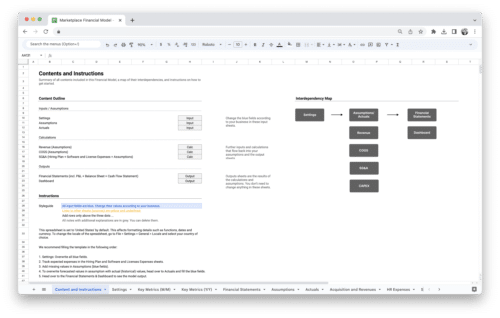
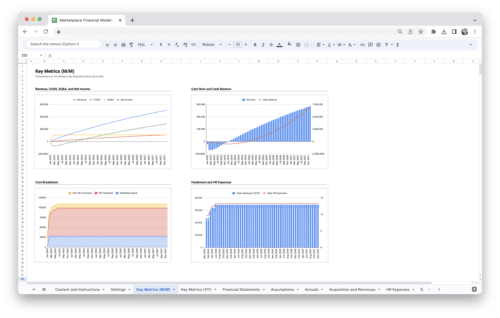
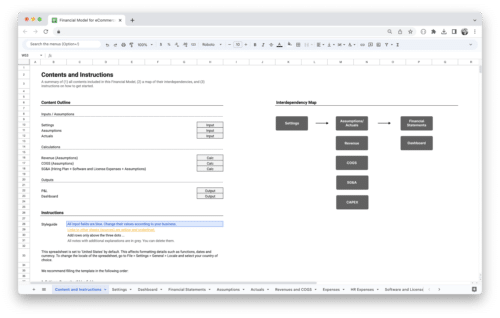
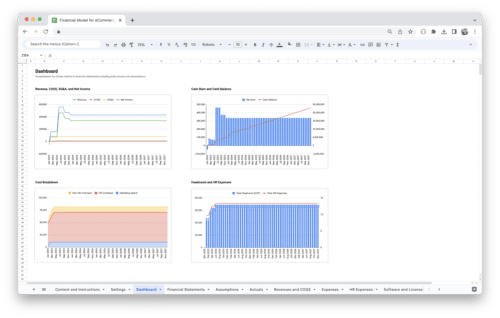
Looking to streamline your business financial modeling process with a prebuilt customizable template? Say goodbye to the hassle of building a financial model from scratch and get started right away with one of our premium templates.
- Save time with no need to create a financial model from scratch.
- Reduce errors with prebuilt formulas and calculations.
- Customize to your needs by adding/deleting sections and adjusting formulas.
- Automatically calculate key metrics for valuable insights.
- Make informed decisions about your strategy and goals with a clear picture of your business performance and financial health.

