What is a Balance Sheet?
A balance sheet is a financial statement that reports a company’s assets, liabilities, and equity at a specific point in time. It shows the company’s financial position and provides information about its resources and obligations. The balance sheet is prepared based on the accounting equation, which states that assets must equal liabilities plus equity. This equation ensures that the balance sheet is always balanced, hence the name.
The Purpose of a Balance Sheet
The primary purpose of a balance sheet is to provide an overview of a company’s financial position. It helps investors, analysts, and other stakeholders to understand the company’s resources, obligations, and equity. By examining the balance sheet, stakeholders can evaluate a company’s financial health, liquidity, and solvency. In addition, it provides information about a company’s ability to meet its obligations, including paying off debts and fulfilling other financial obligations.
Balance Sheet Format
The balance sheet is typically presented in a standardized format with three main sections: assets, liabilities, and equity. Here is a breakdown of each section:
Assets
- Current assets: Assets that can be converted into cash within one year, including cash and cash equivalents, accounts receivable, inventory, and prepaid expenses.
- Long-term assets: Assets that cannot be easily converted into cash, including property, plant, and equipment, intangible assets, and long-term investments.
Liabilities
- Current liabilities: Obligations that must be paid within one year, including accounts payable, accrued expenses, and short-term debt.
- Long-term liabilities: these are obligations that are due more than one year from the balance sheet date, including long-term debt, lease obligations, and pension liabilities.
Equity
- Common stock: Represents the par value of the company’s outstanding shares of common stock.
- Additional paid-in capital: Represents the amount of capital the company has received from issuing shares of stock above their par value.
- Retained earnings: Represents the company’s cumulative earnings that have not been paid out as dividends.
- Accumulated other comprehensive income: this represents gains and losses that have not yet been realized, such as unrealized gains or losses on investments.
How to Read a Balance Sheet?
Analyzing a balance sheet involves evaluating a company’s financial health and performance. Here are some key metrics that can be calculated from it:
- Working capital: Calculated as current assets minus current liabilities. It represents the amount of capital that a company has available to meet its short-term obligations. A positive working capital indicates that a company has enough resources to pay its short-term debts, while a negative working capital indicates that a company may struggle to meet its obligations.
- Debt-to-equity ratio: Calculated as total liabilities divided by total equity. It represents the amount of debt a company has relative to its equity. A high debt-to-equity ratio indicates that a company is relying heavily on debt to finance its operations, while a low debt-to-equity ratio indicates that a company is using more equity to fund its operations.
- Current ratio: Calculated as current assets divided by current liabilities. It represents the company’s ability to meet its short-term obligations. A current ratio of less than one indicates that a company may struggle to pay its short-term debts, while a current ratio of more than one indicates that it has enough resources to pay its short-term debts.
- Net worth: Calculated as total assets minus total liabilities. It represents the value of a company’s equity. A positive net worth indicates that a company’s assets exceed its liabilities, while a negative net worth indicates a company has more liabilities than assets.
Limitations of a Balance Sheet
While the balance sheet provides valuable information about a company’s financial position, it does have some limitations. For example:
- It provides a snapshot of a company’s financial position at a specific time, which may not be representative of its long-term financial health.
- It only includes quantitative data and does not provide insight into a company’s qualitative factors, such as management expertise or competitive advantage.
- It may not accurately reflect the fair market value of a company’s assets or liabilities.
Conclusion
The balance sheet is a critical financial statement that provides valuable information about a company’s financial position. It summarizes the company’s assets, liabilities, and equity and can be used to evaluate its financial health, liquidity, and solvency. By understanding how to analyze a balance sheet, investors and analysts can make informed decisions about a company’s prospects. While it has some limitations, it remains an essential tool for evaluating a company’s financial position.
Get Started With a Prebuilt Template!
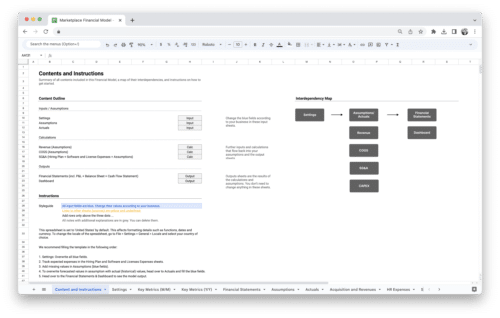
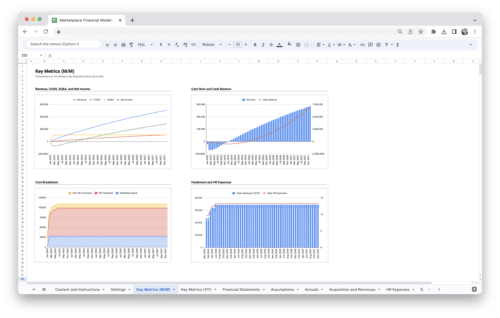
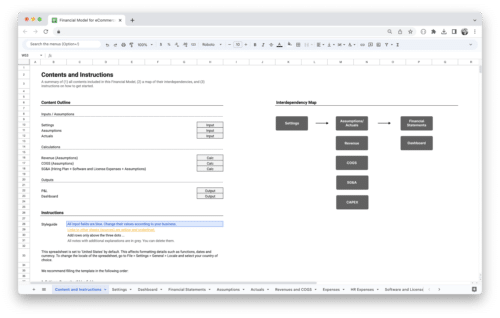
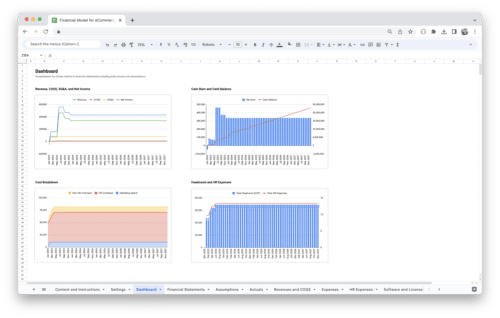
Looking to streamline your business financial modeling process with a prebuilt customizable template? Say goodbye to the hassle of building a financial model from scratch and get started right away with one of our premium templates.
- Save time with no need to create a financial model from scratch.
- Reduce errors with prebuilt formulas and calculations.
- Customize to your needs by adding/deleting sections and adjusting formulas.
- Automatically calculate key metrics for valuable insights.
- Make informed decisions about your strategy and goals with a clear picture of your business performance and financial health.

