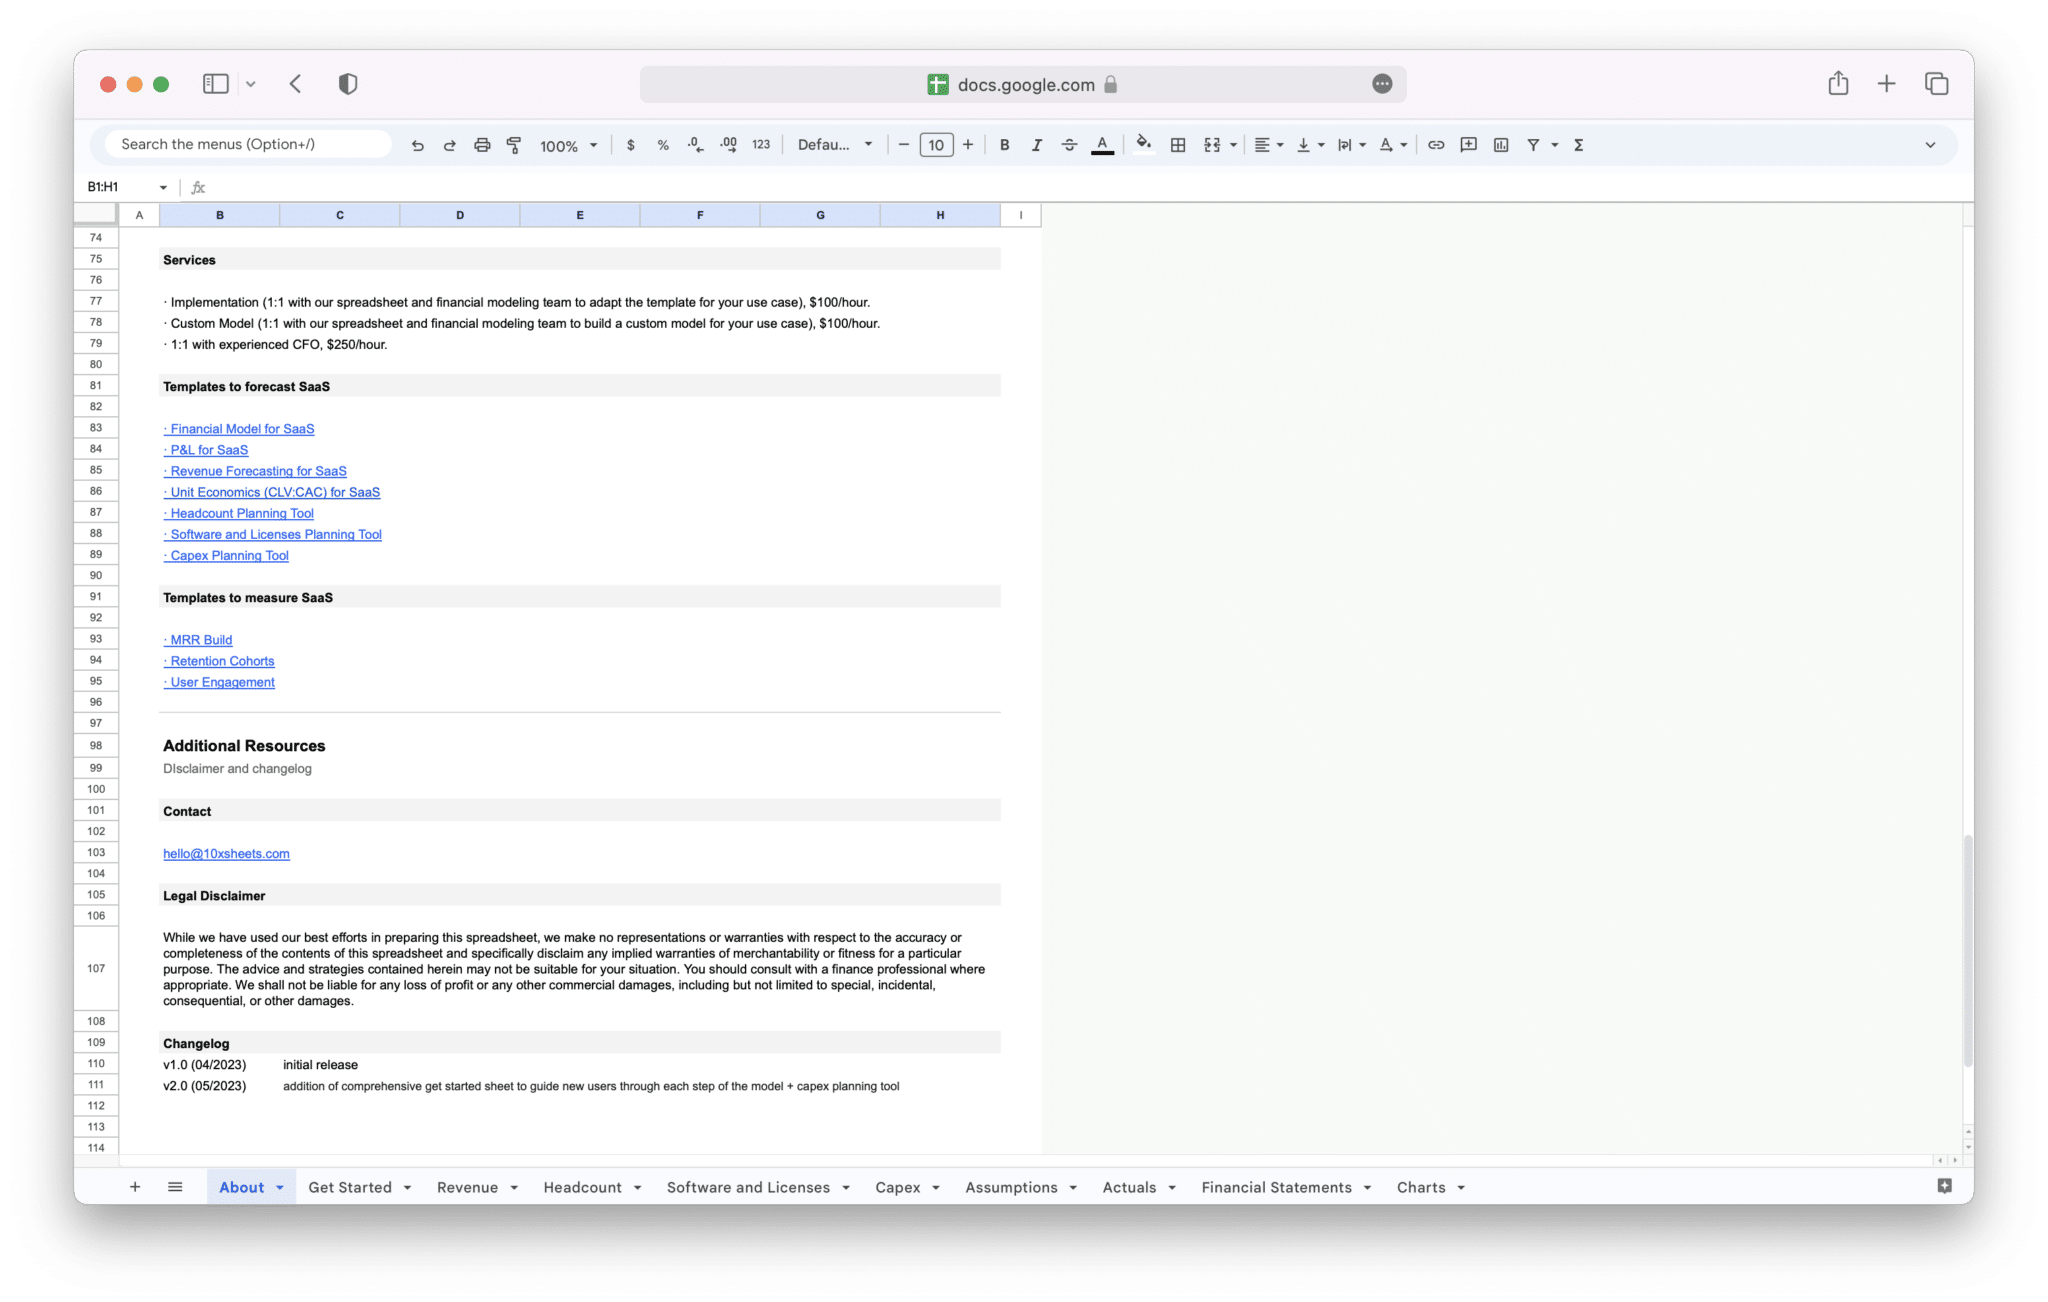
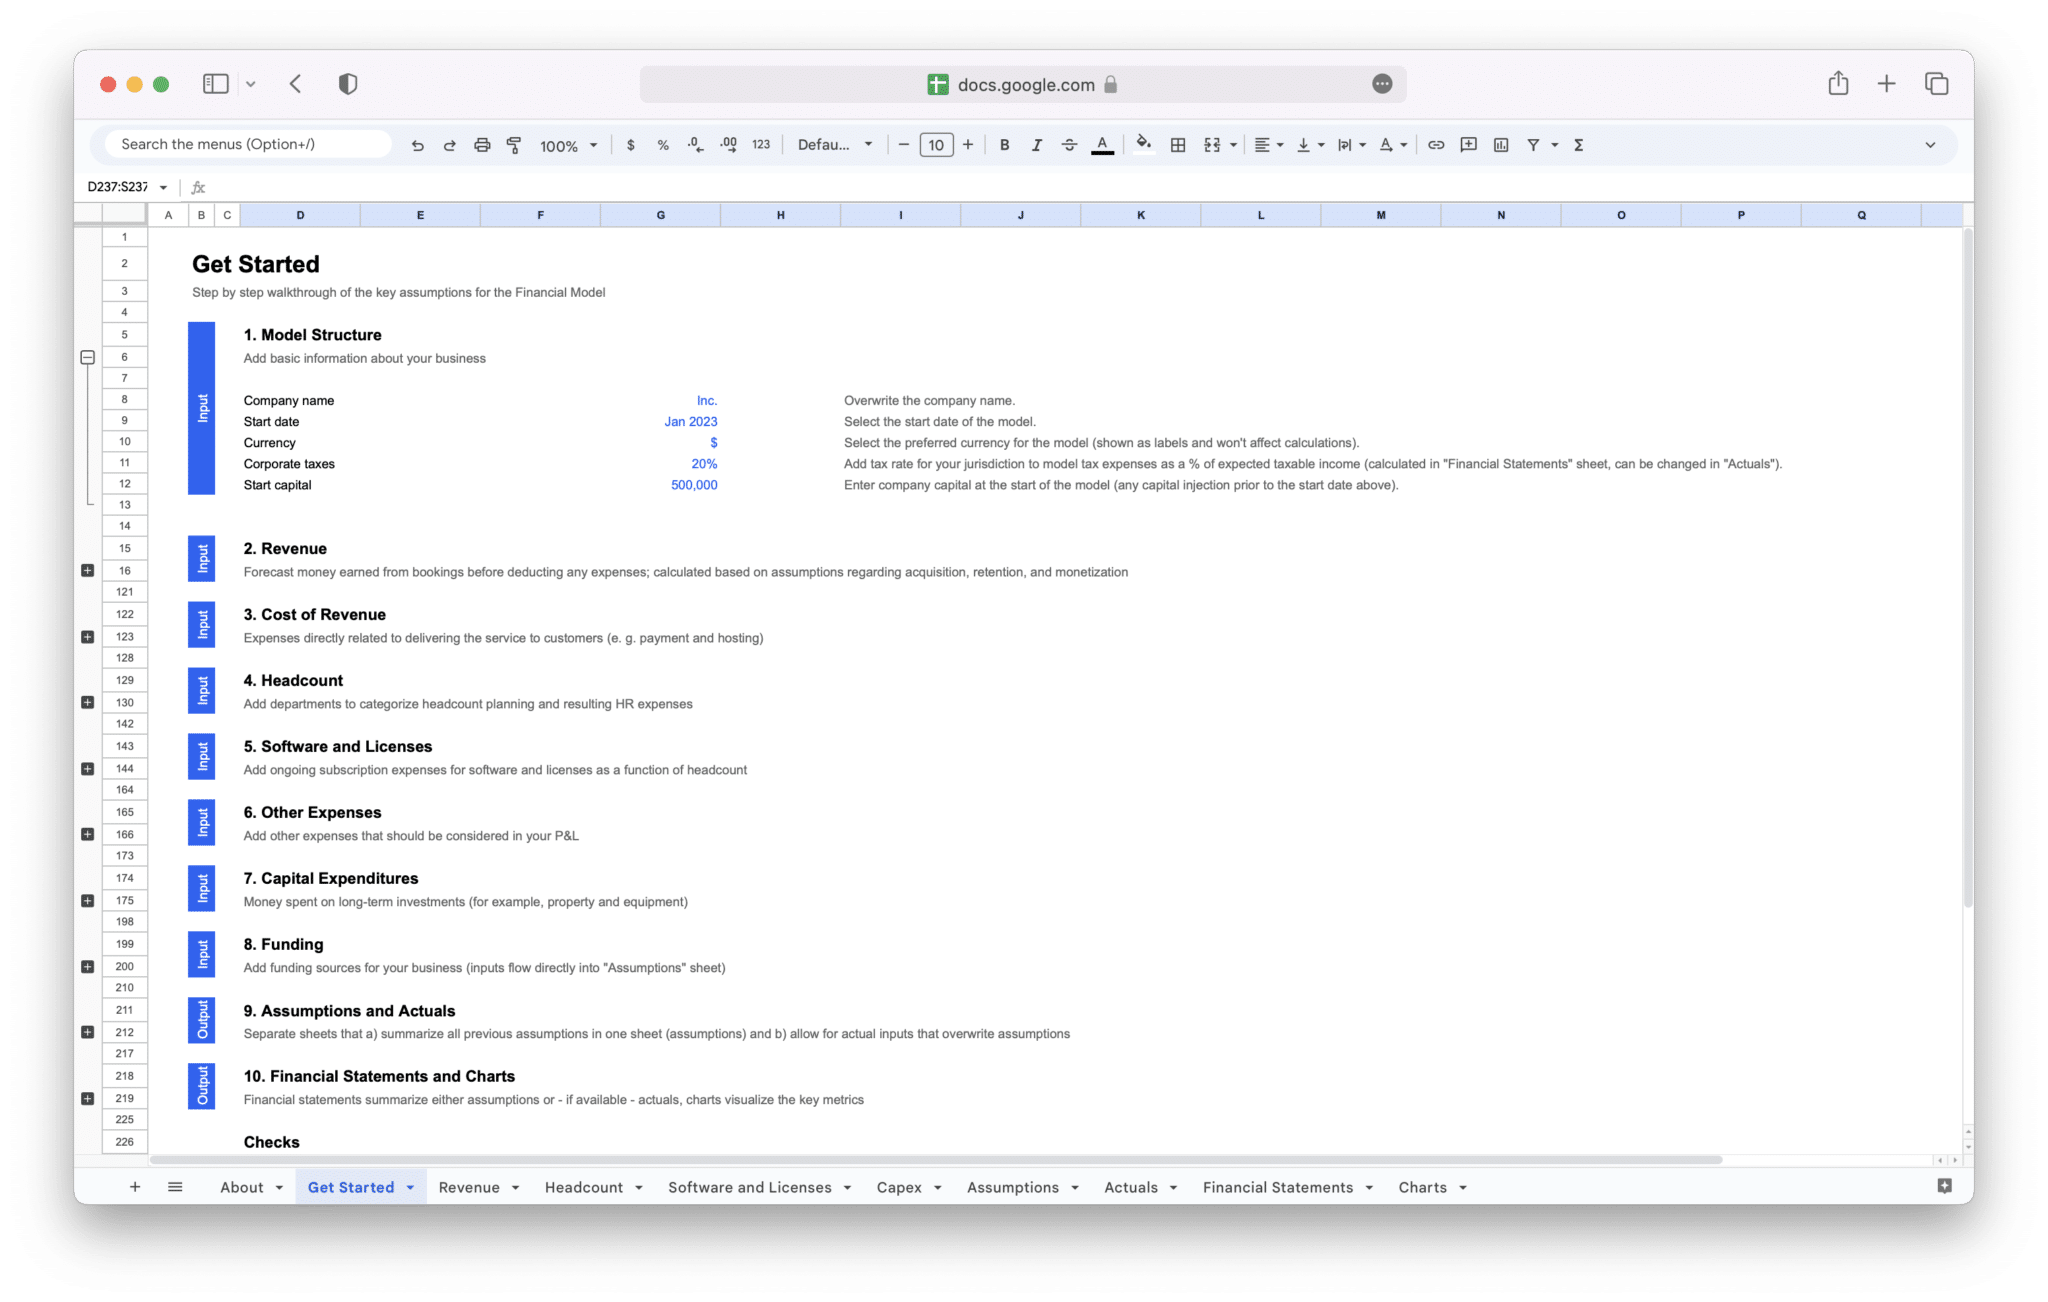
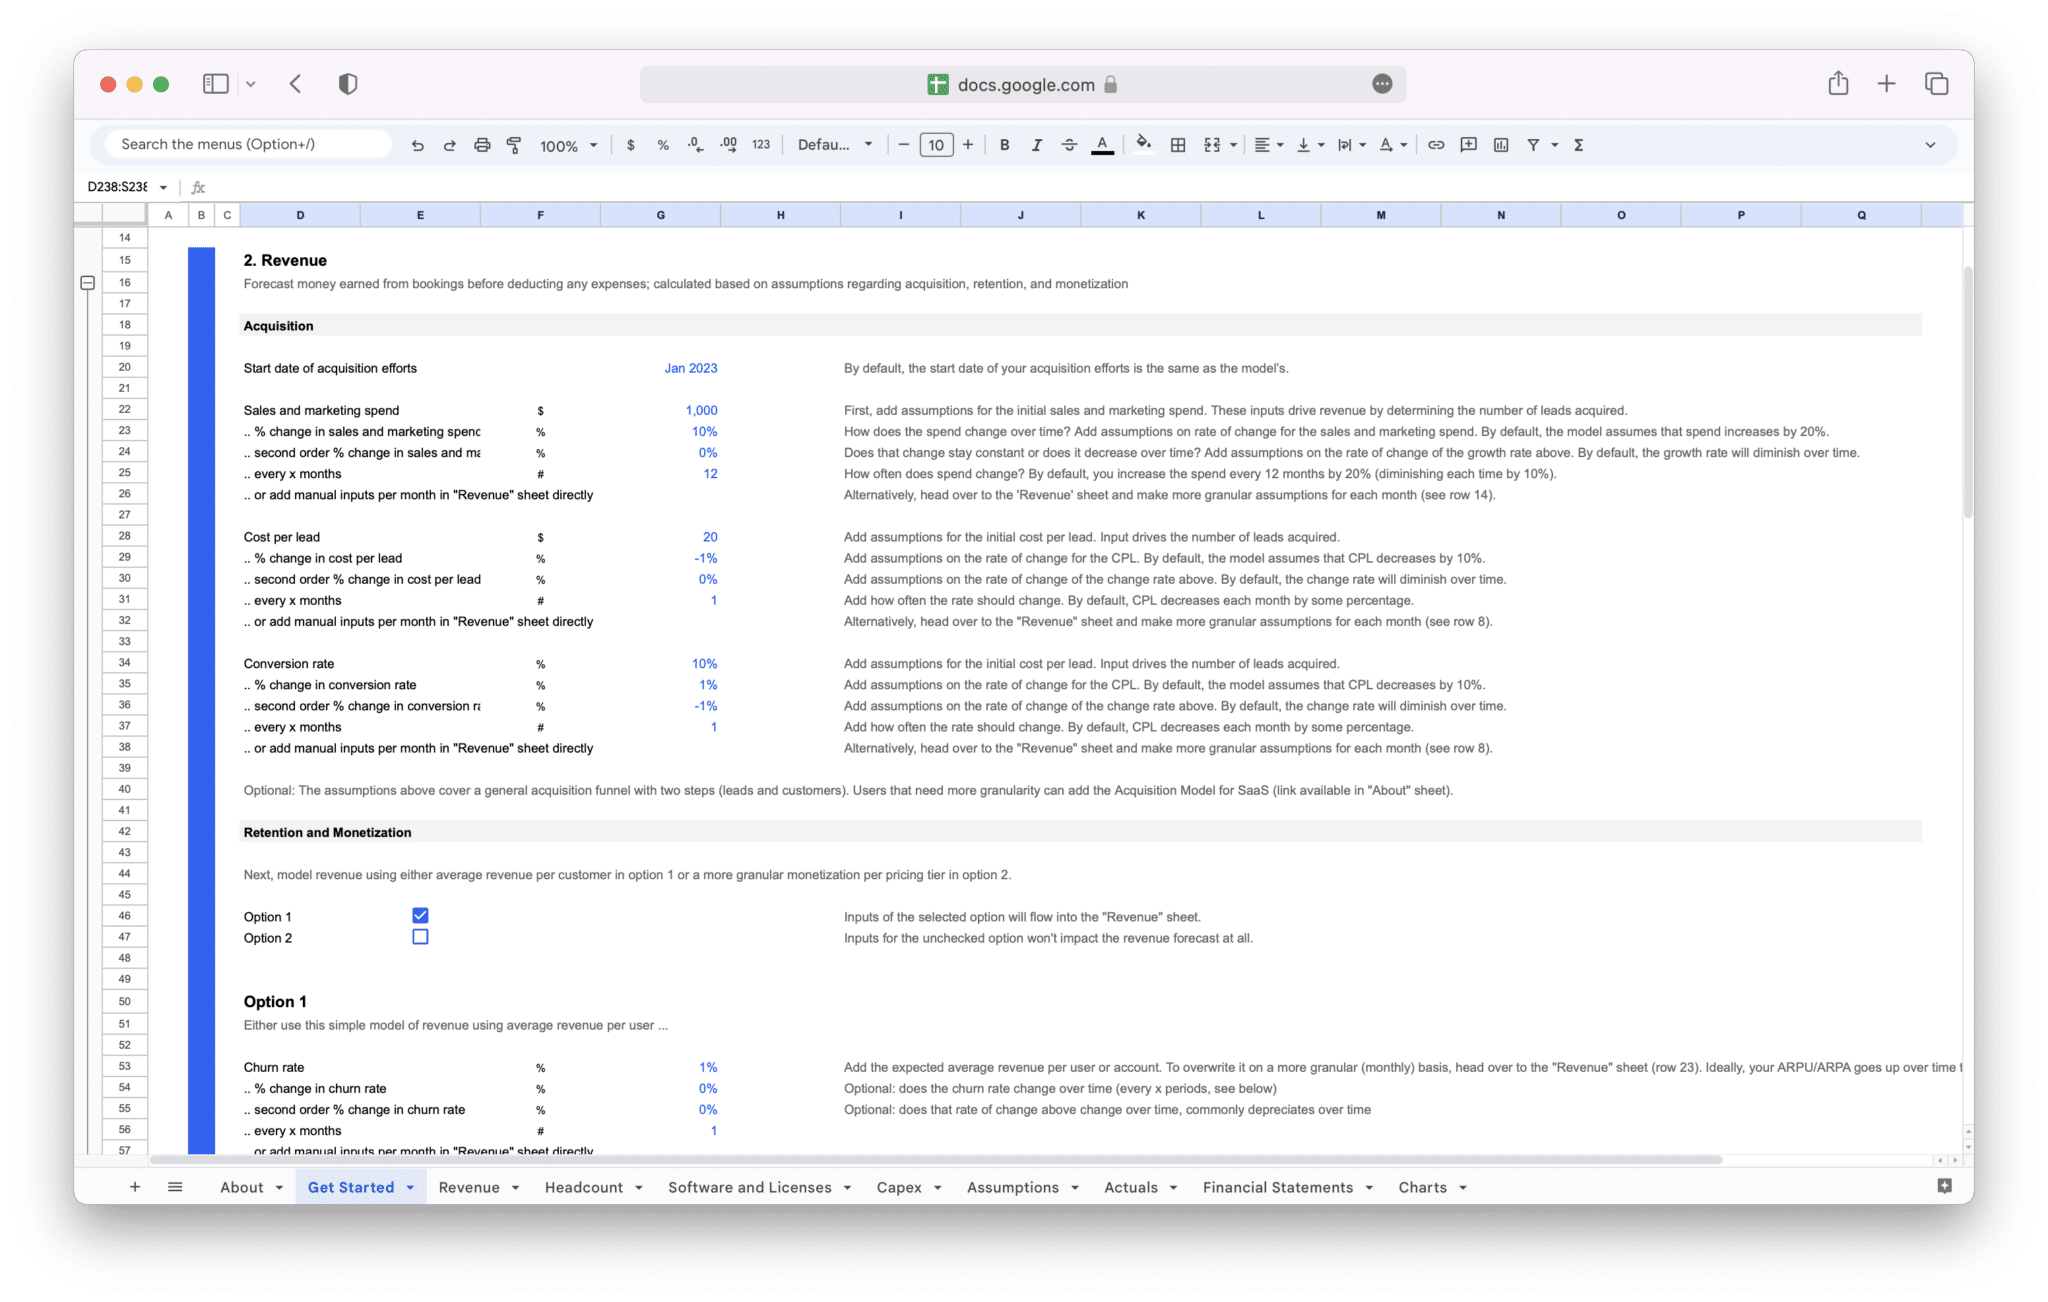
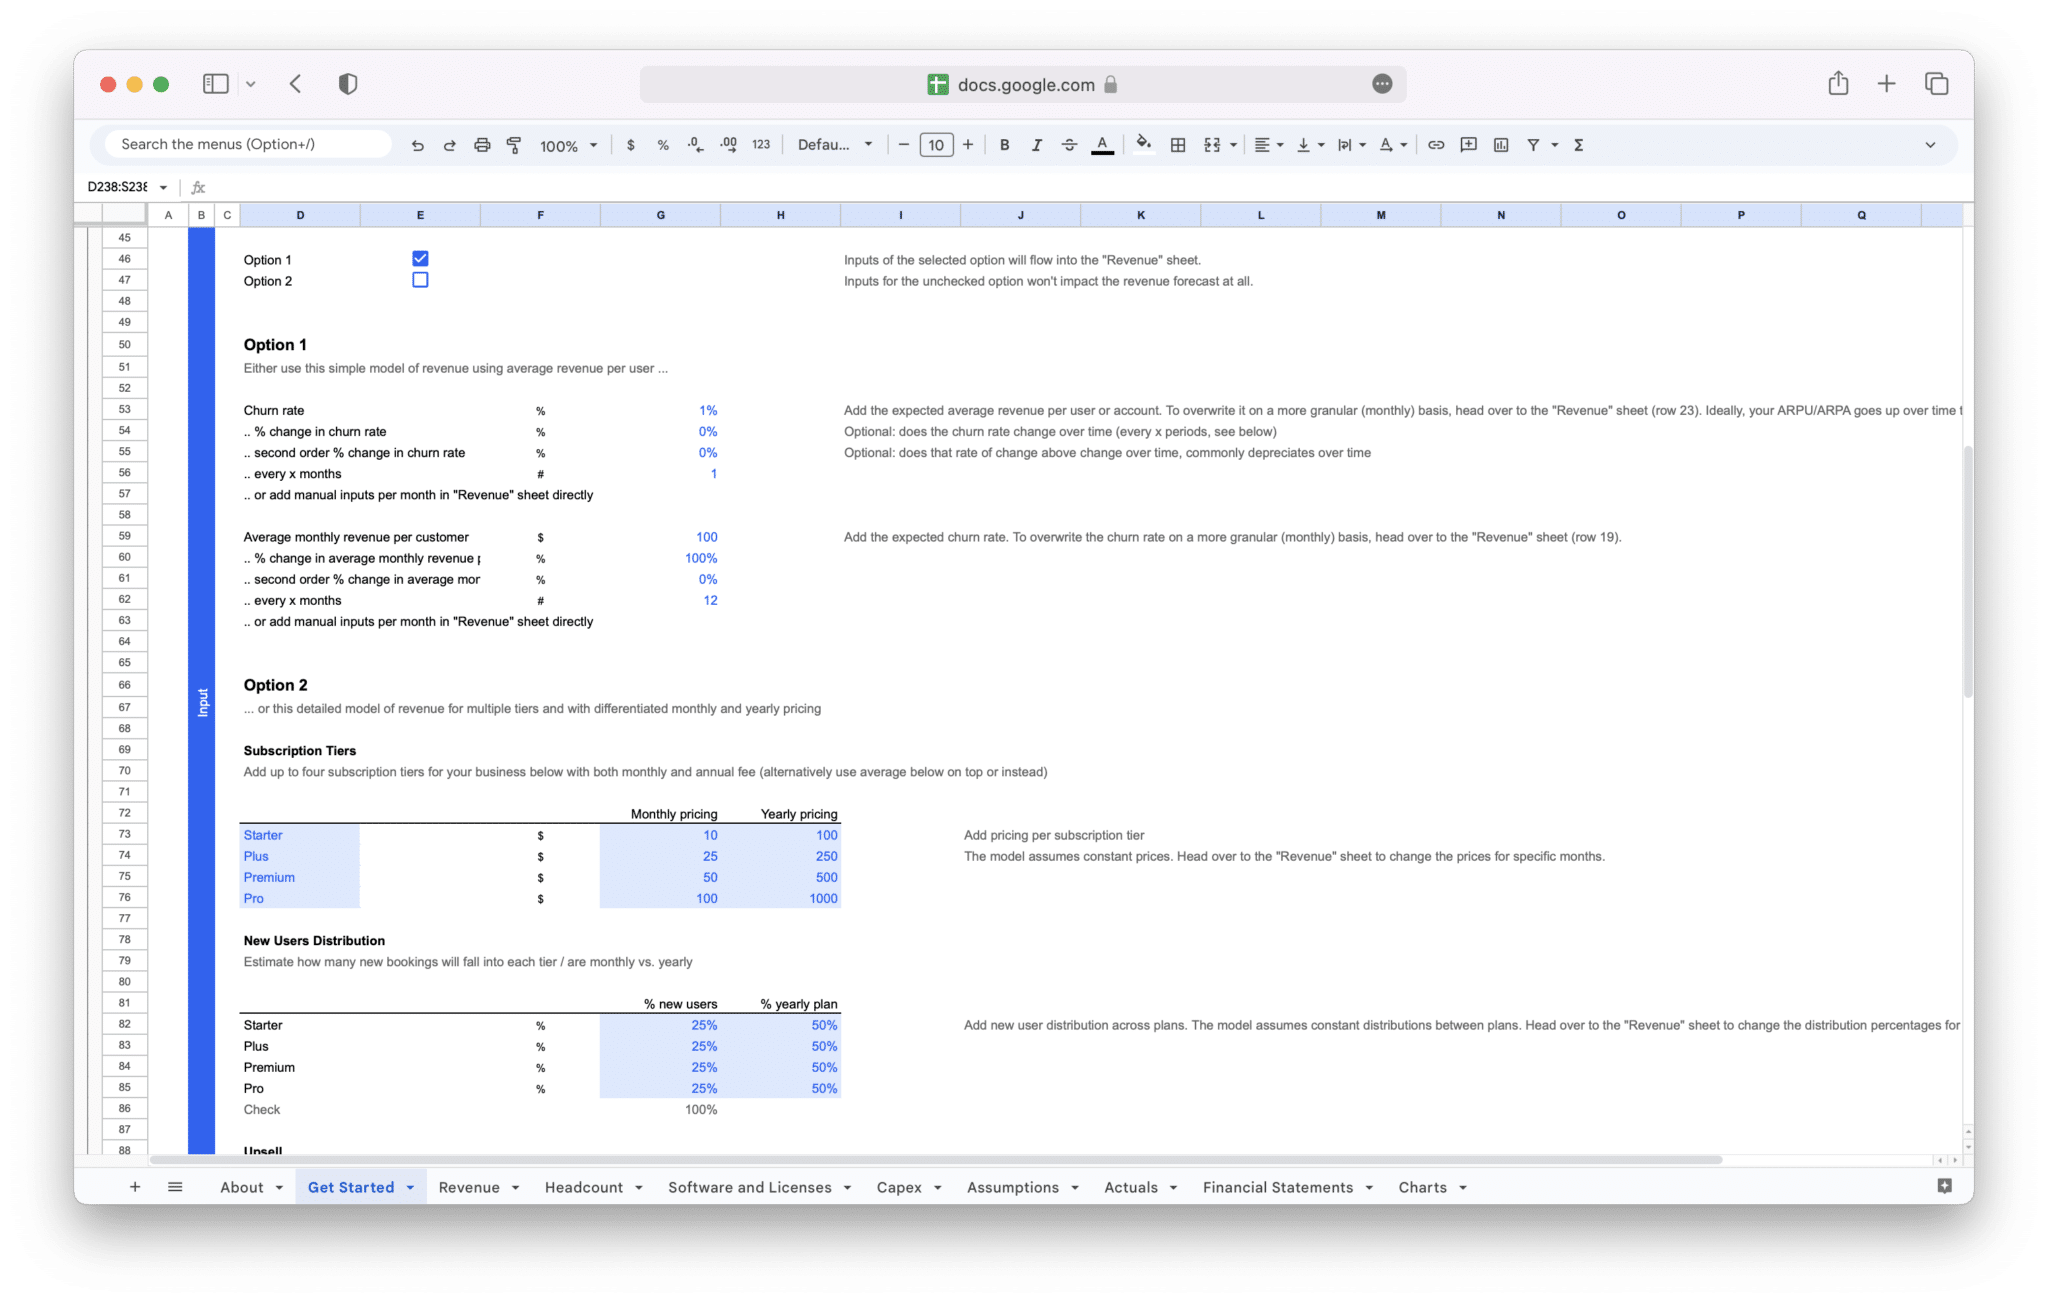
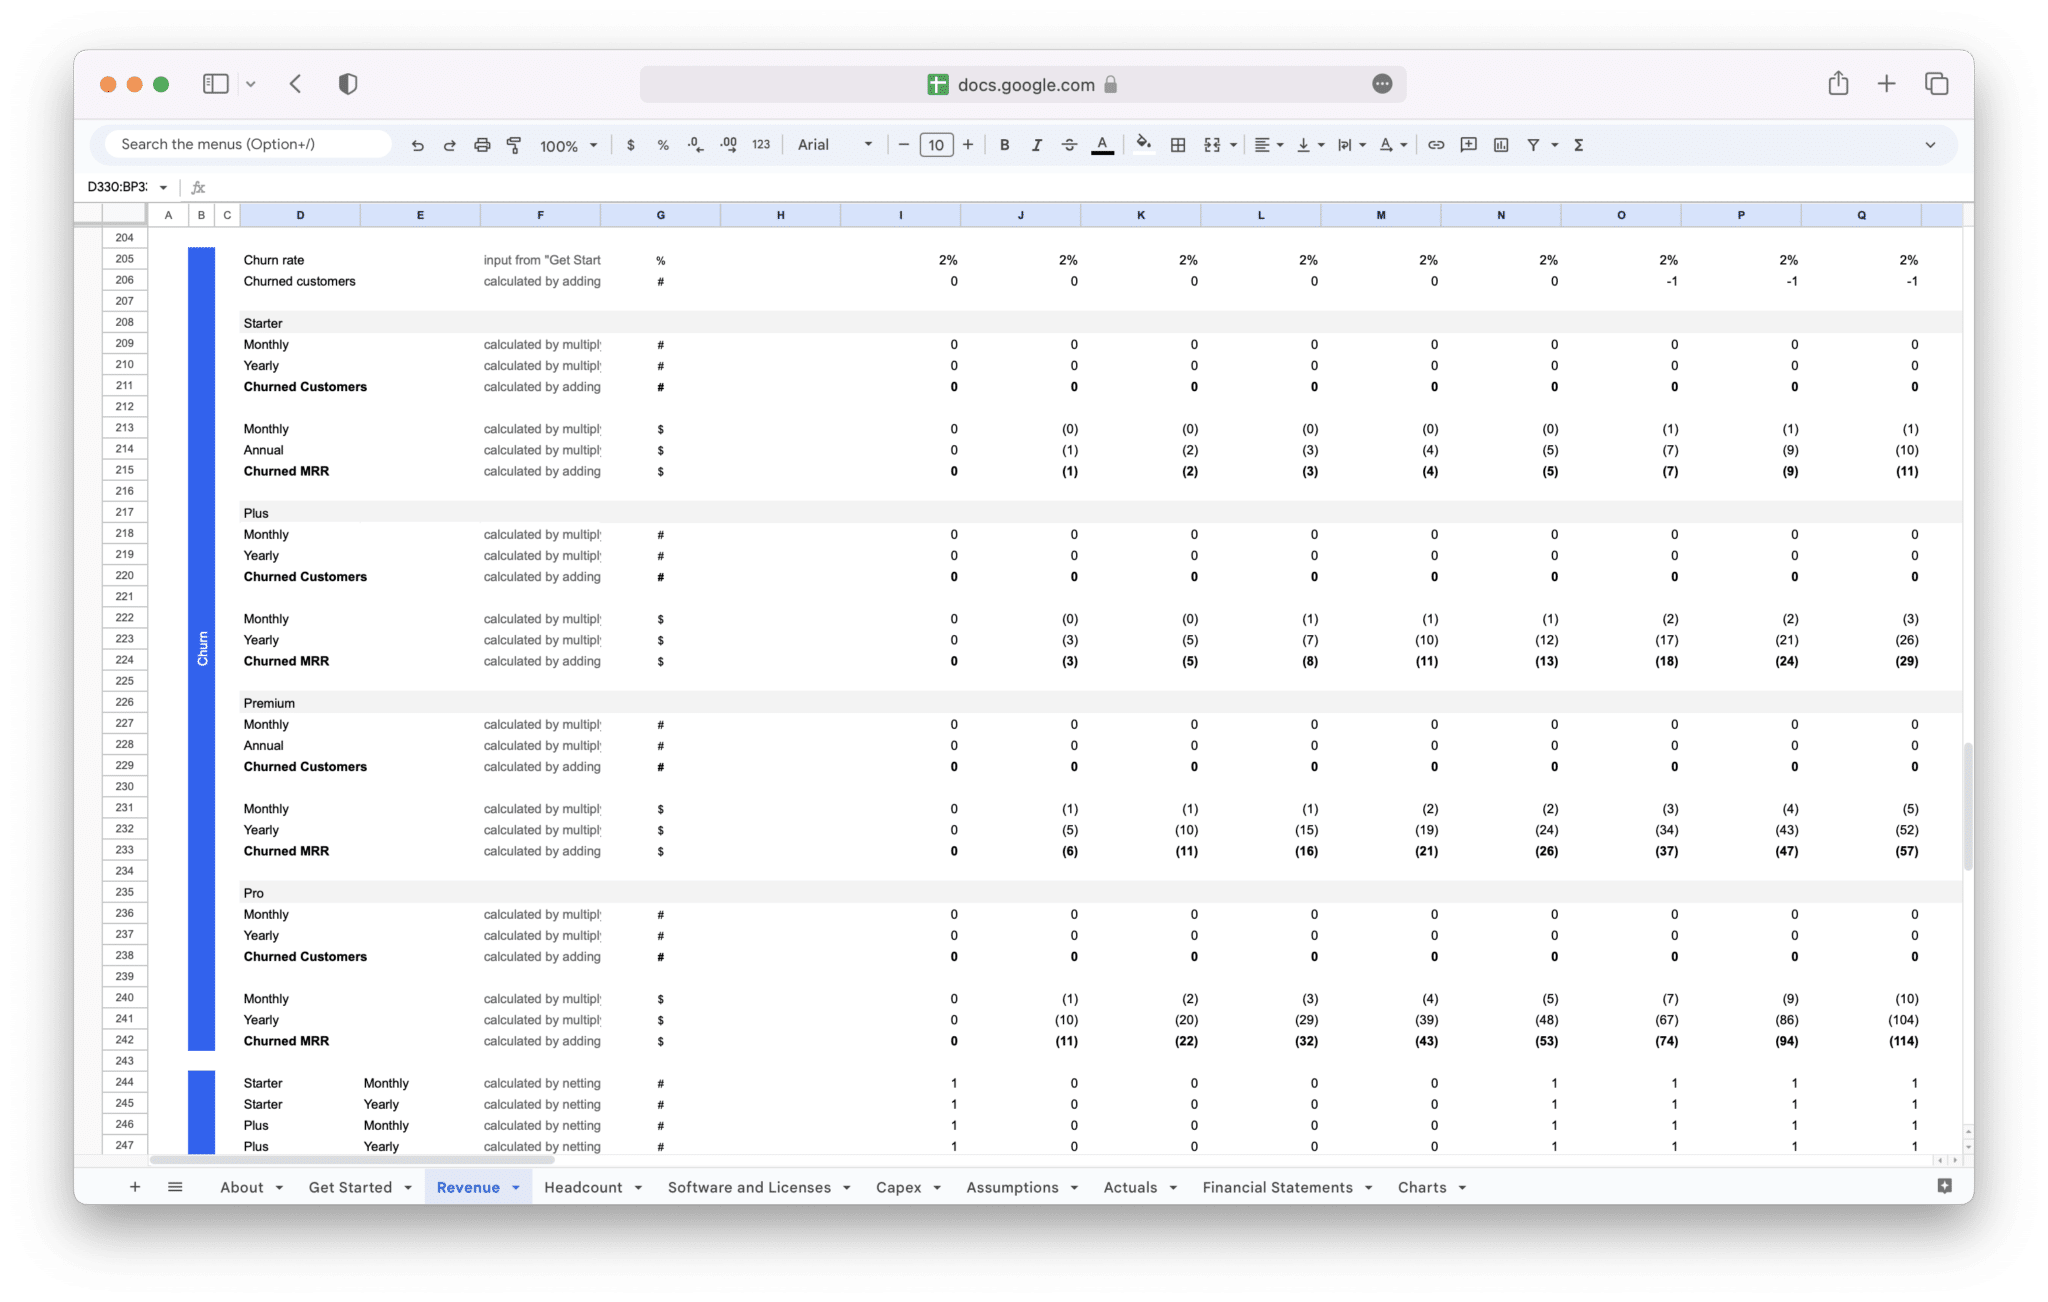
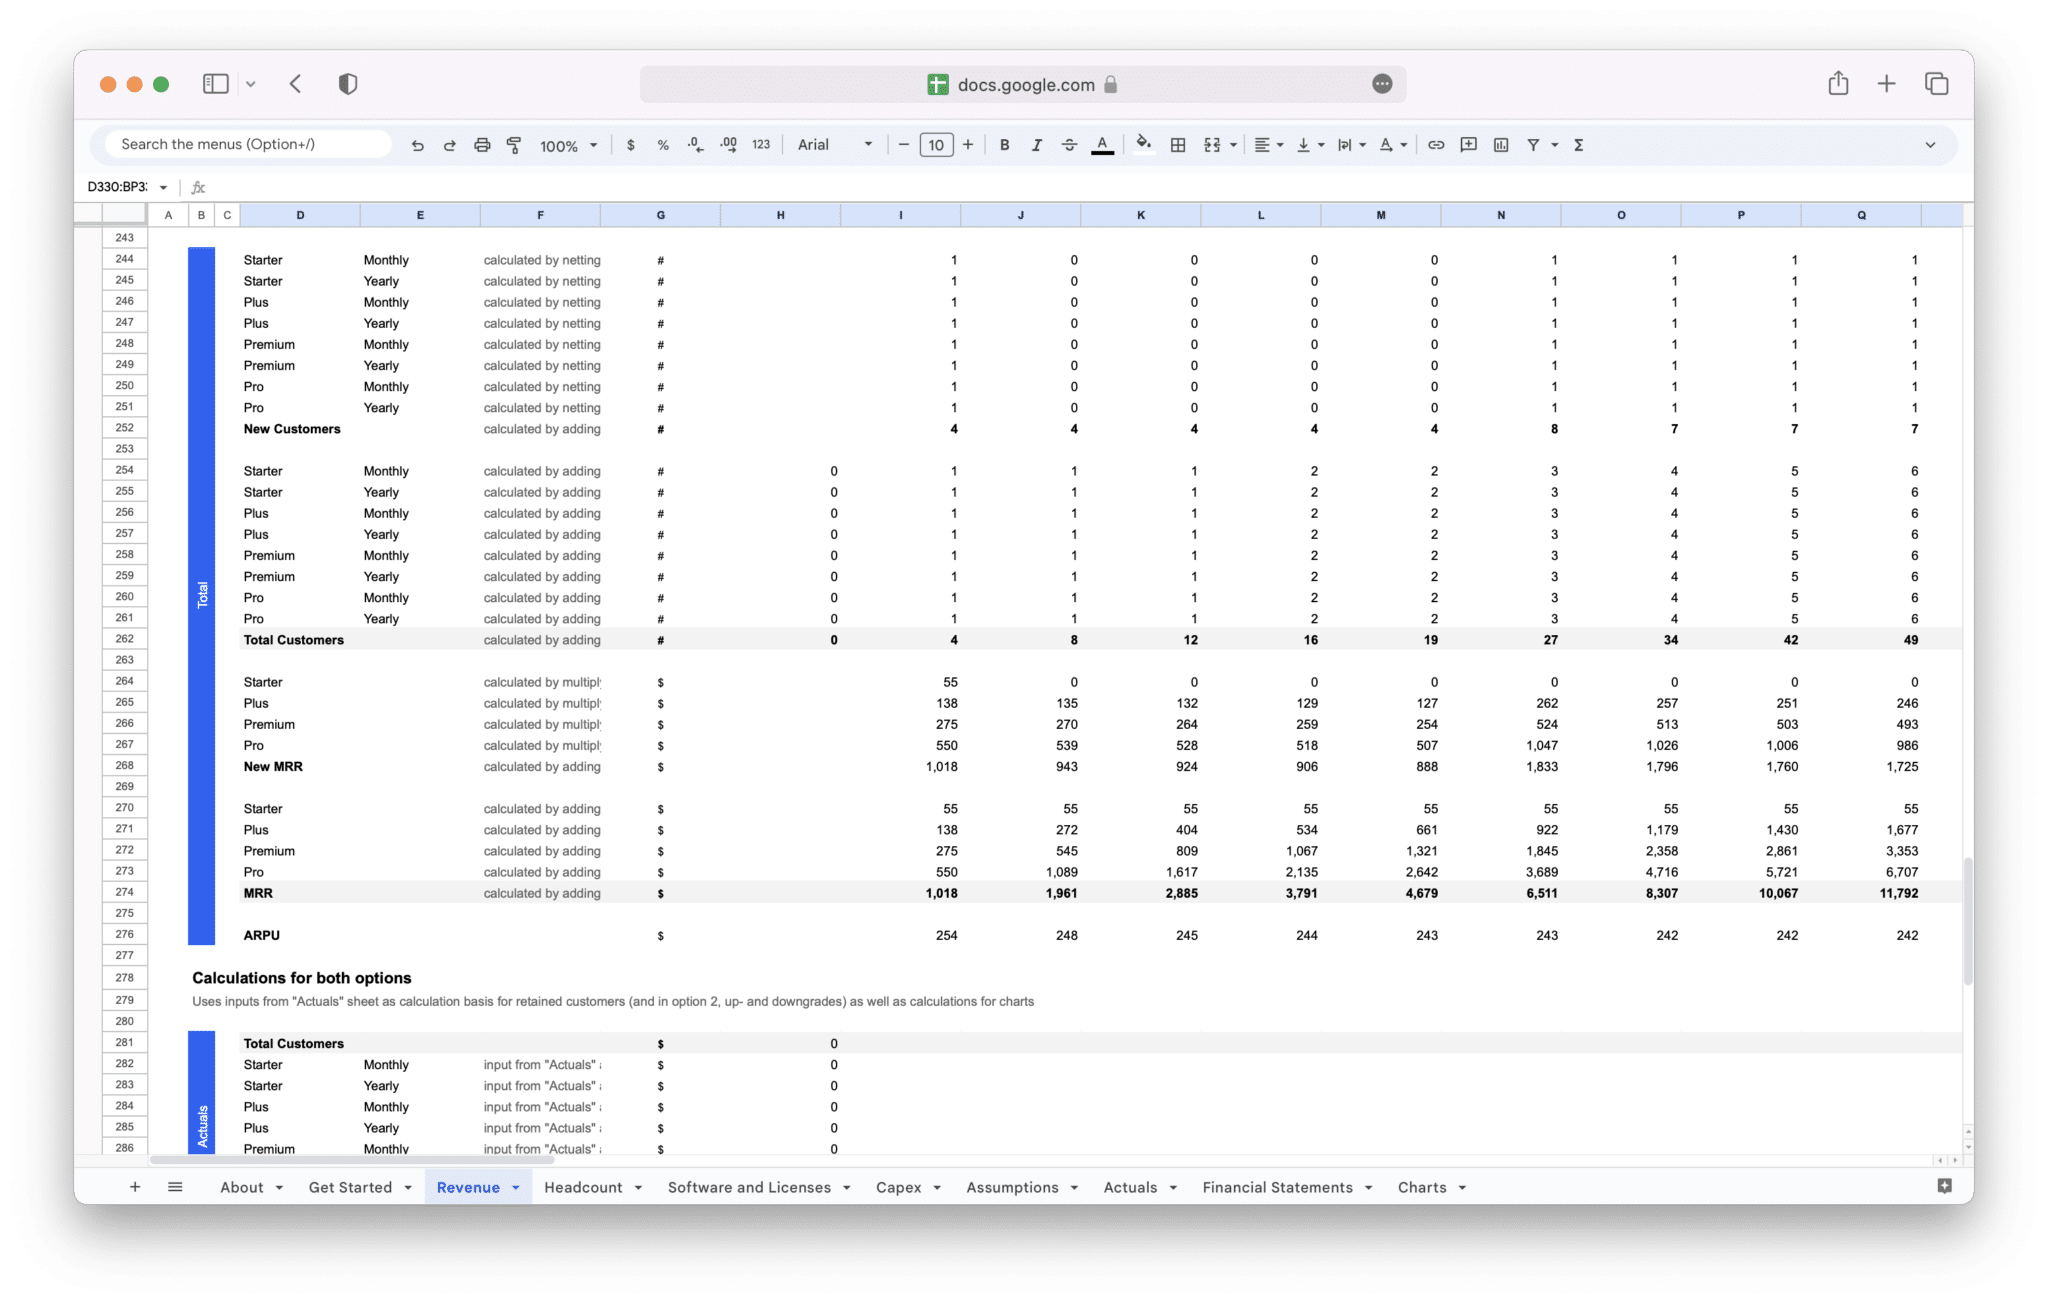
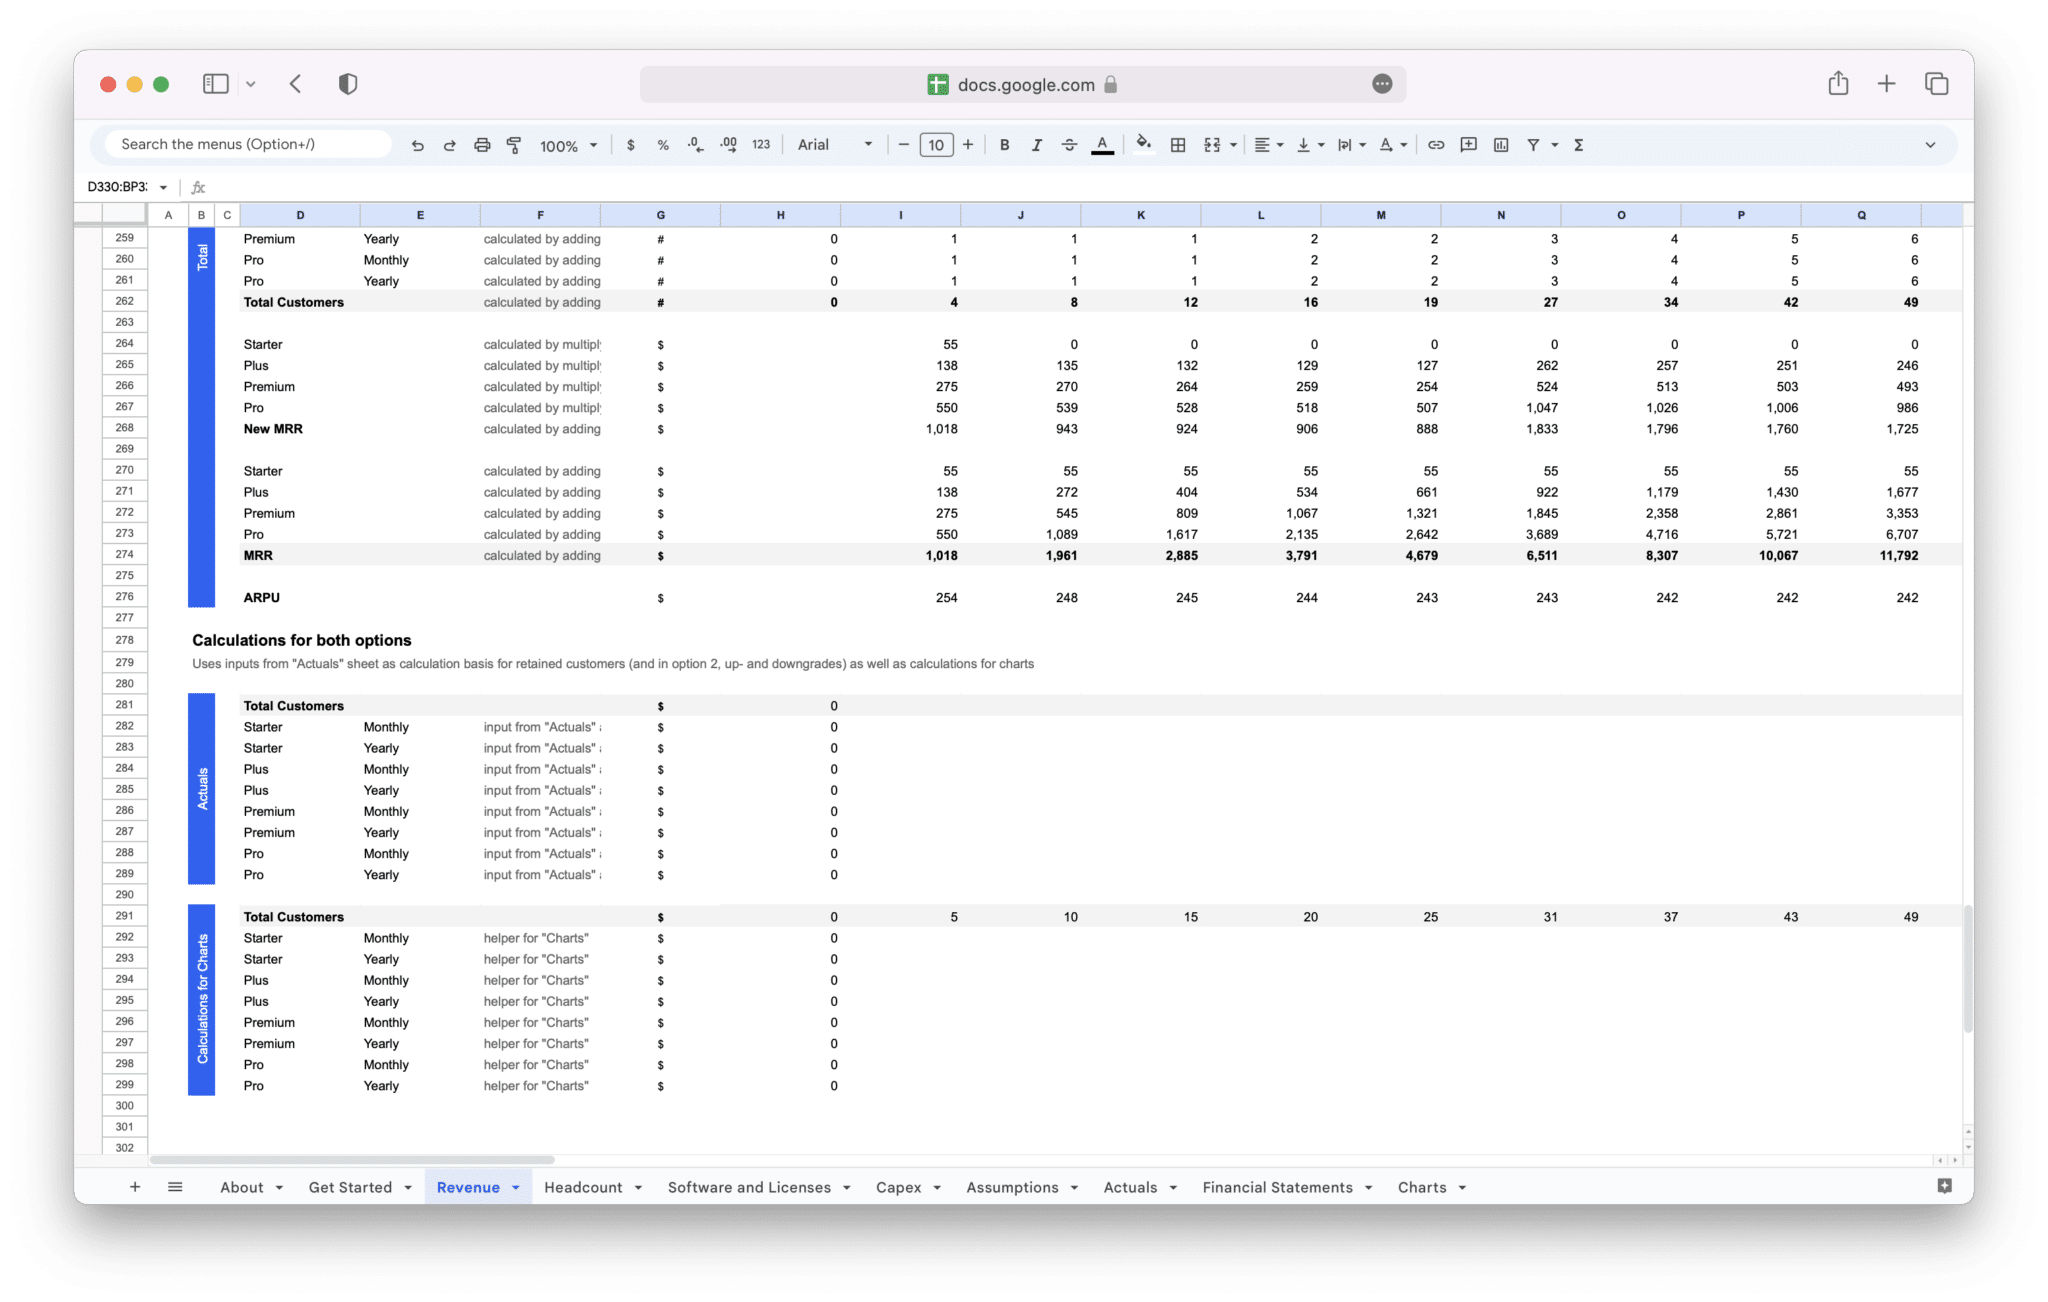
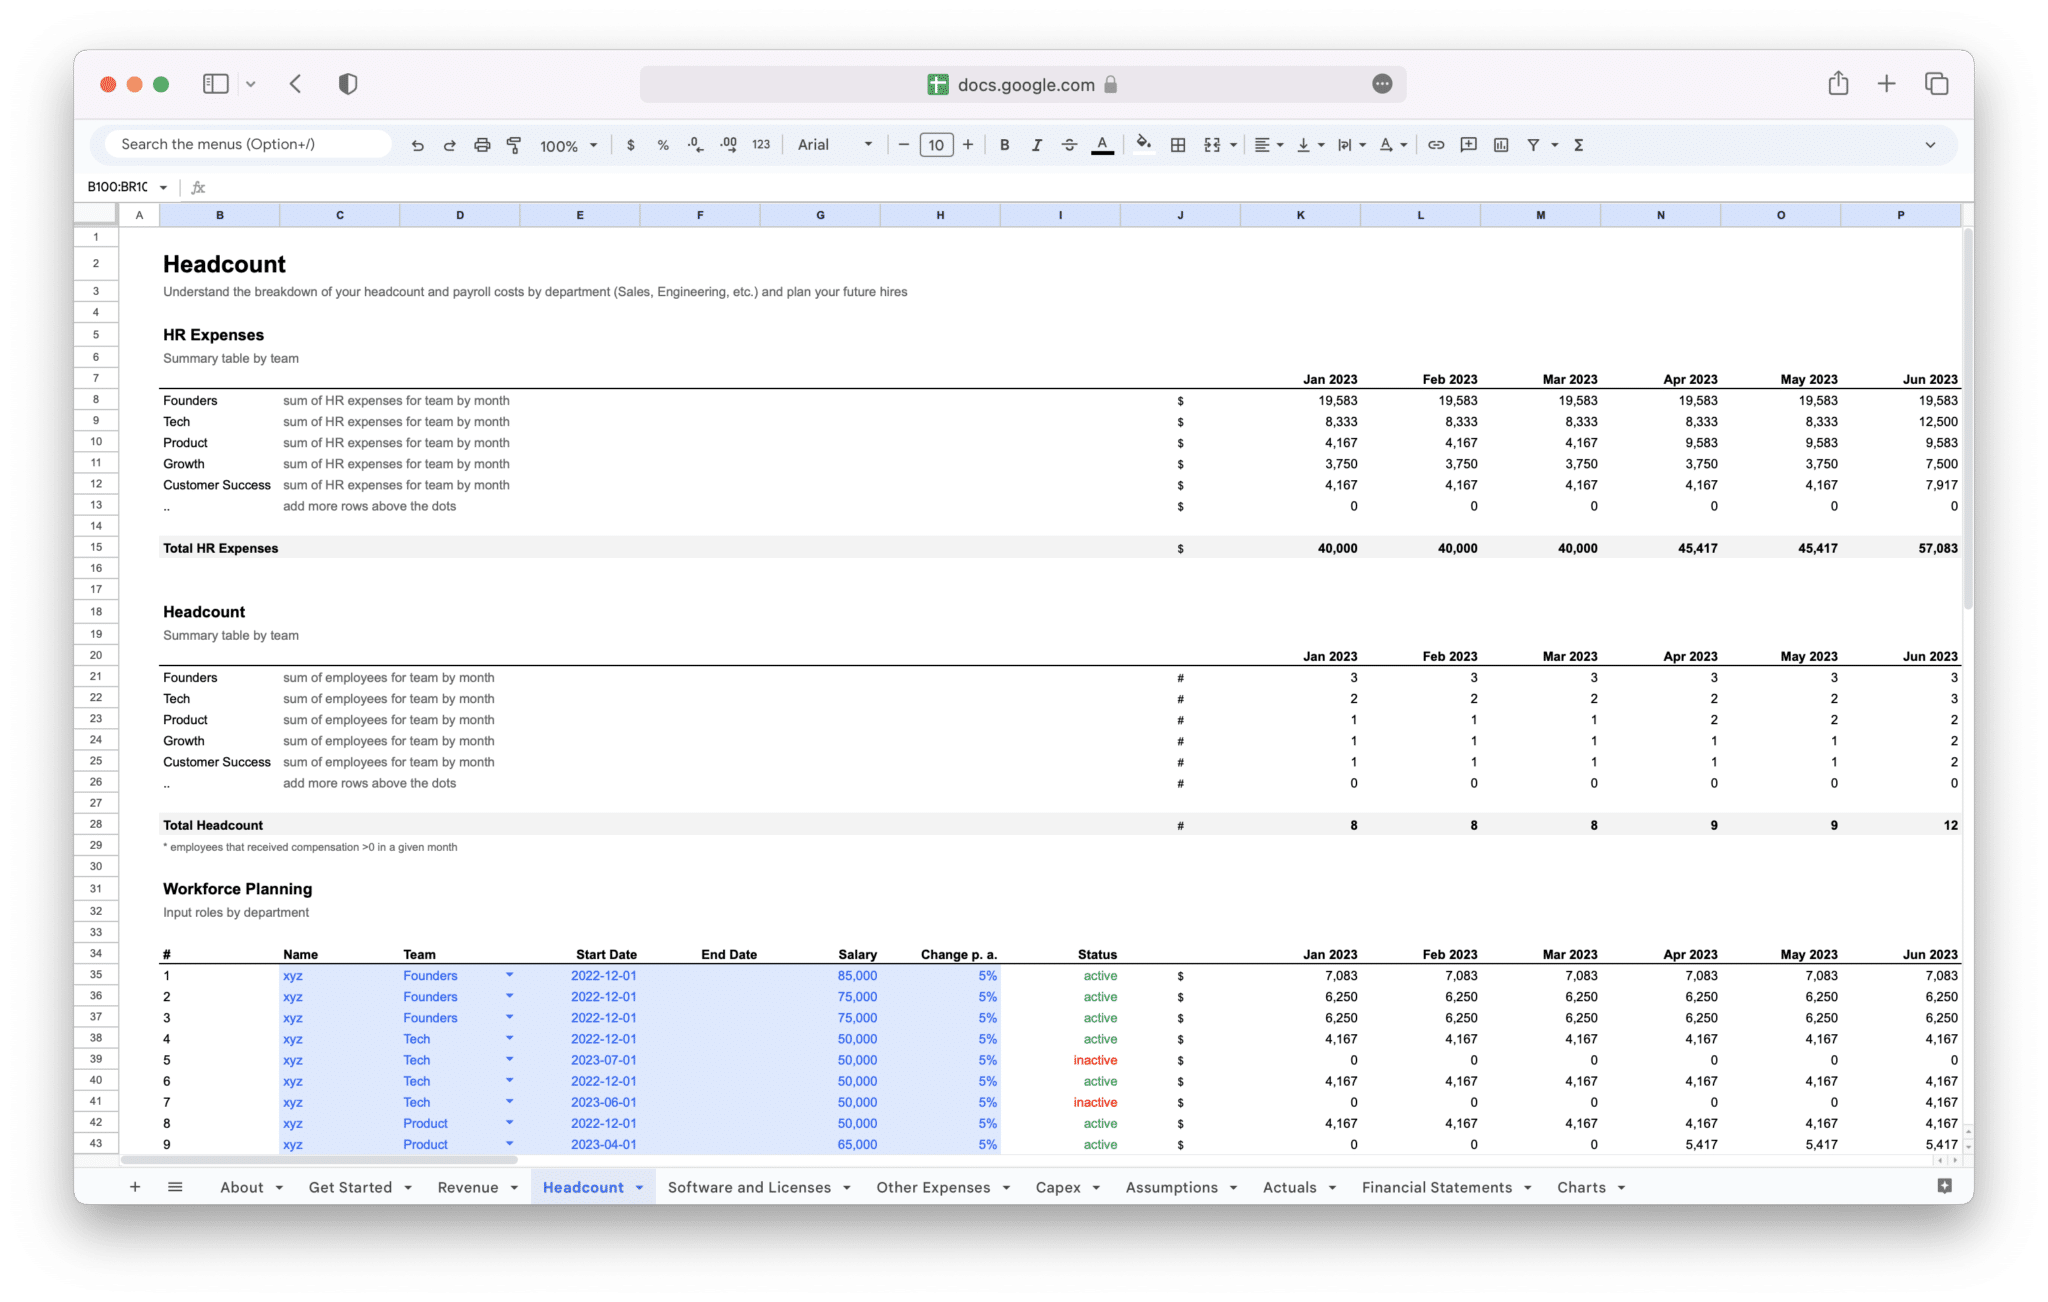
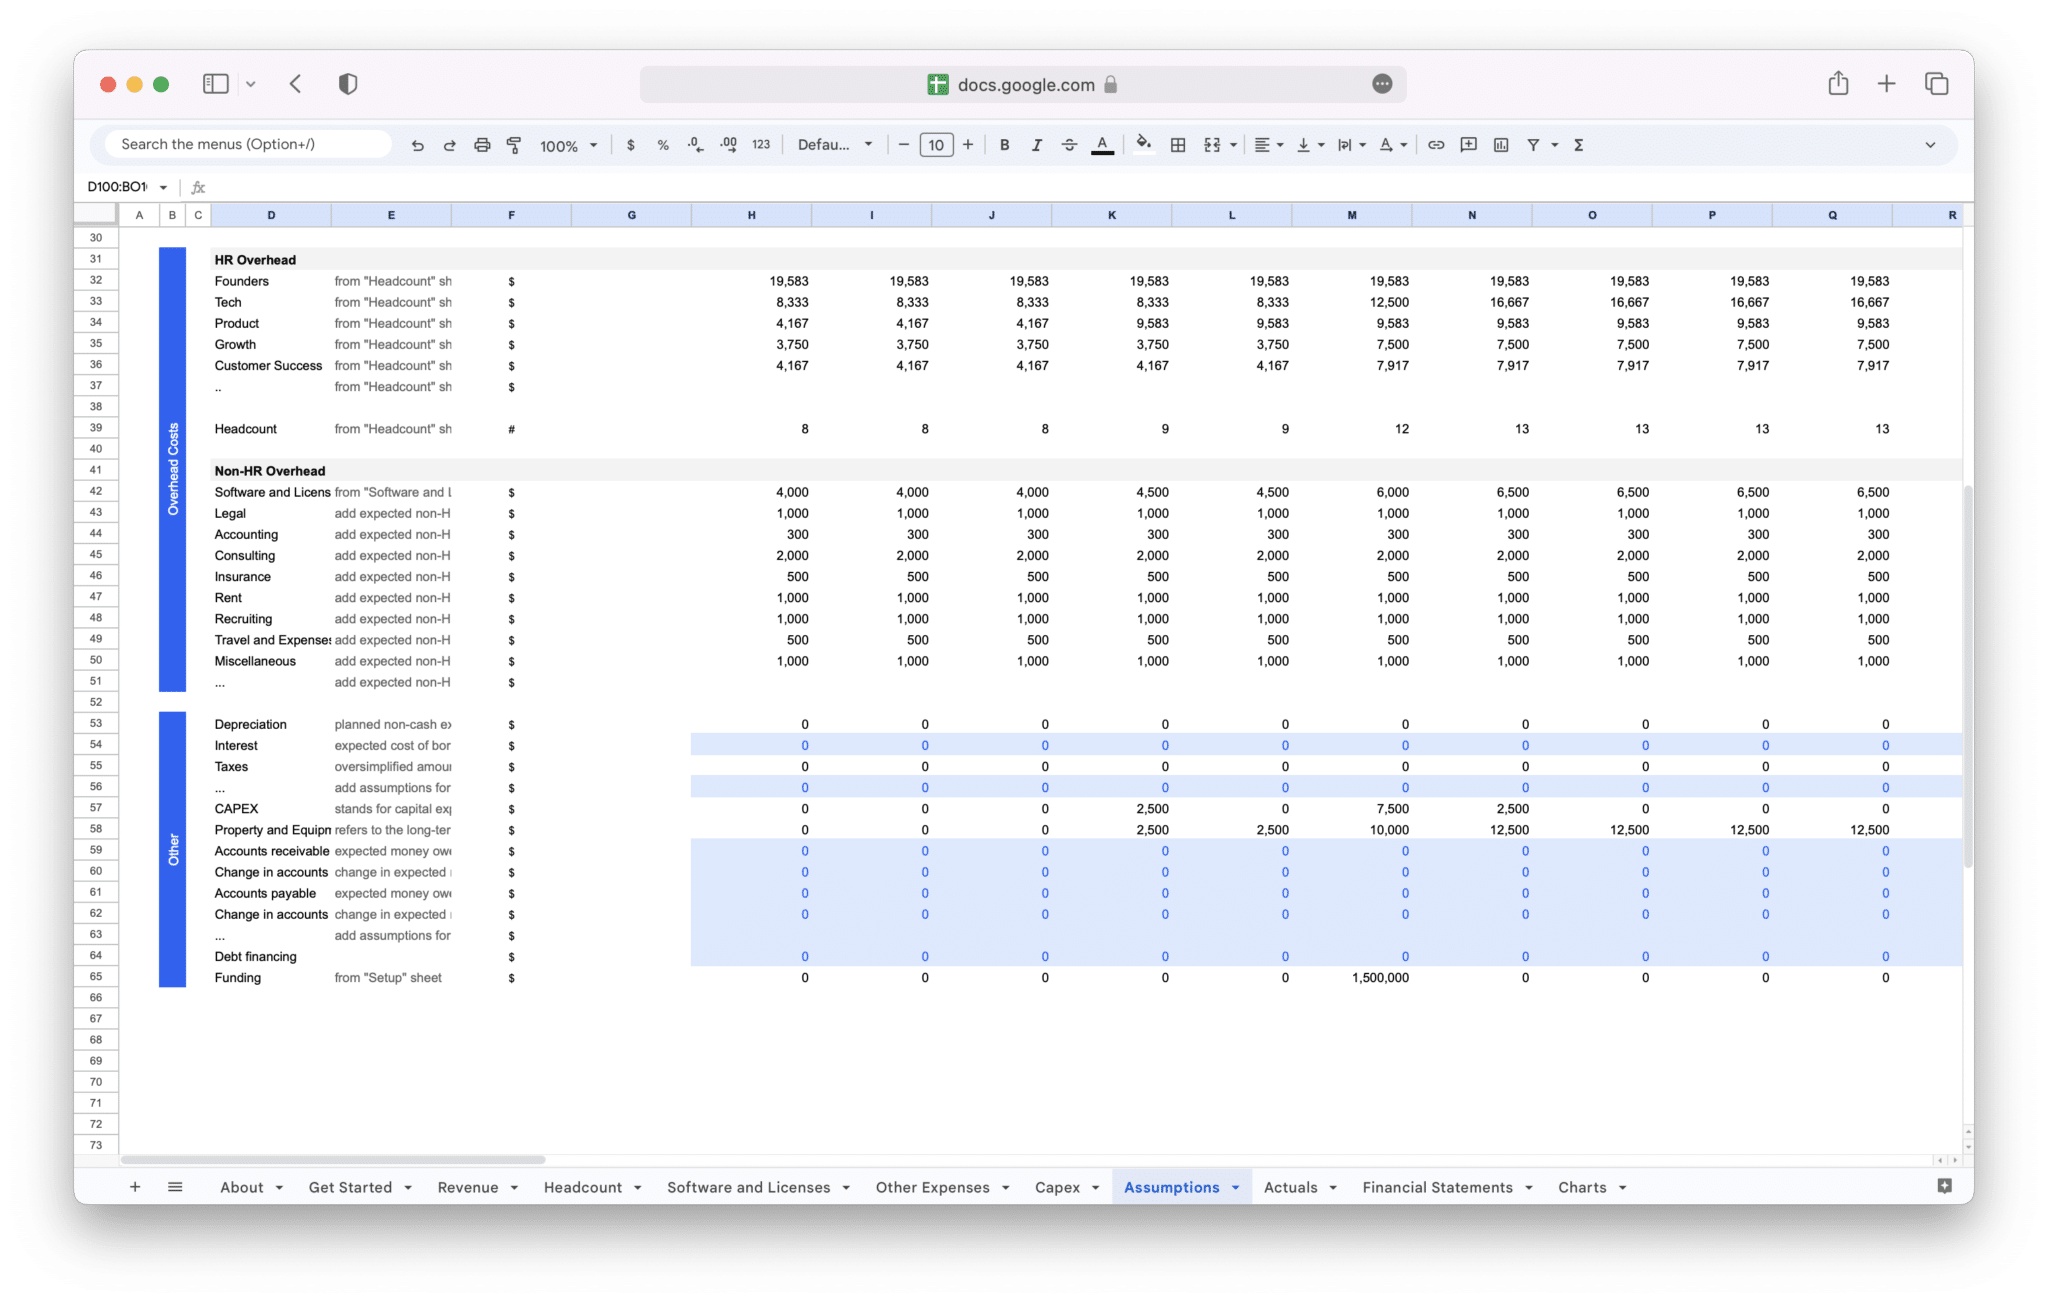
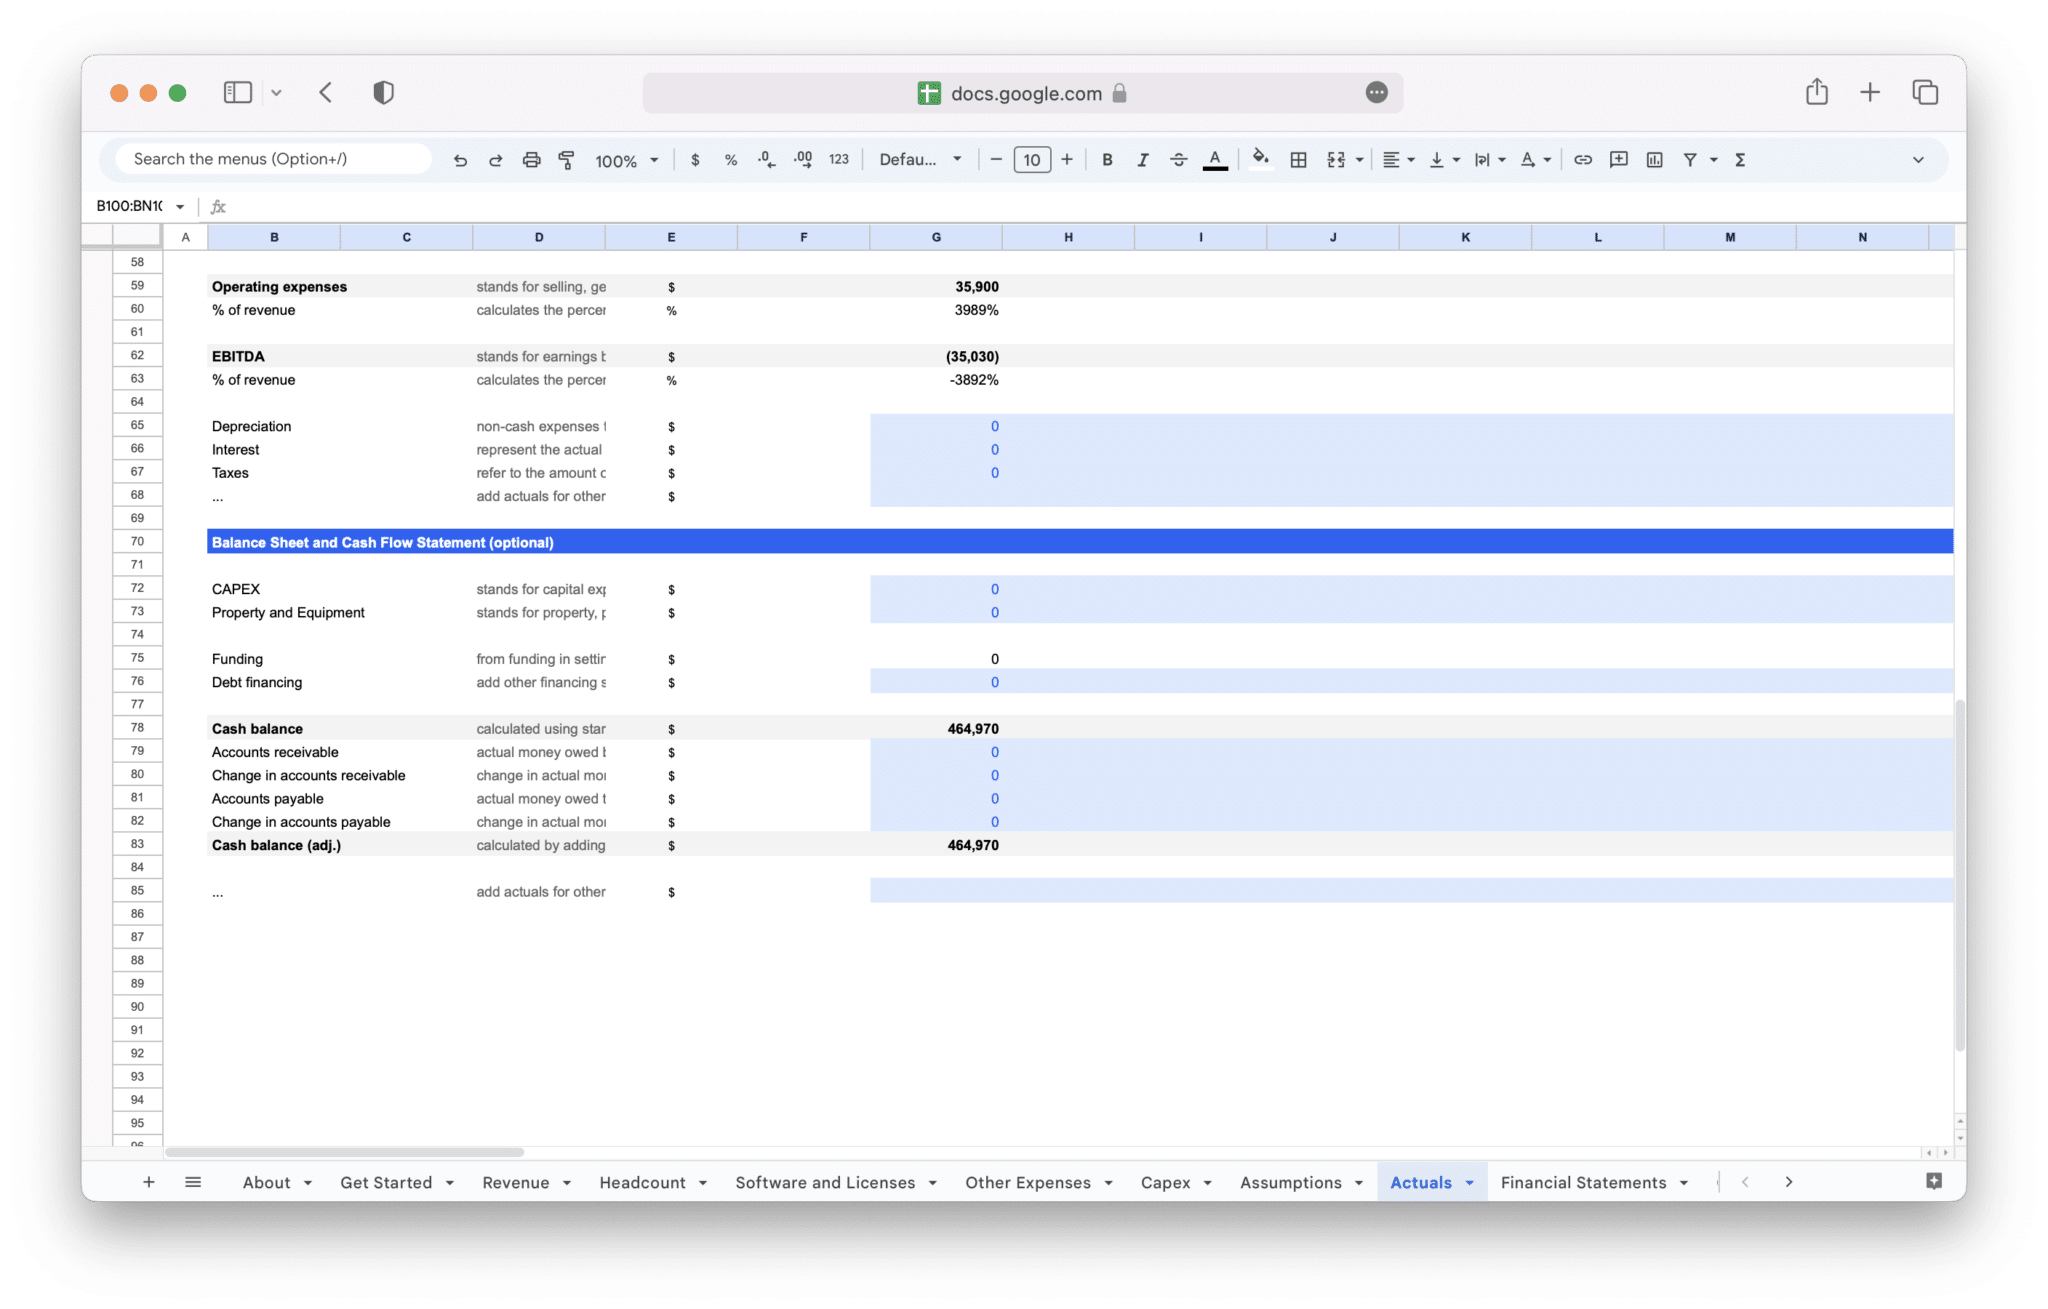
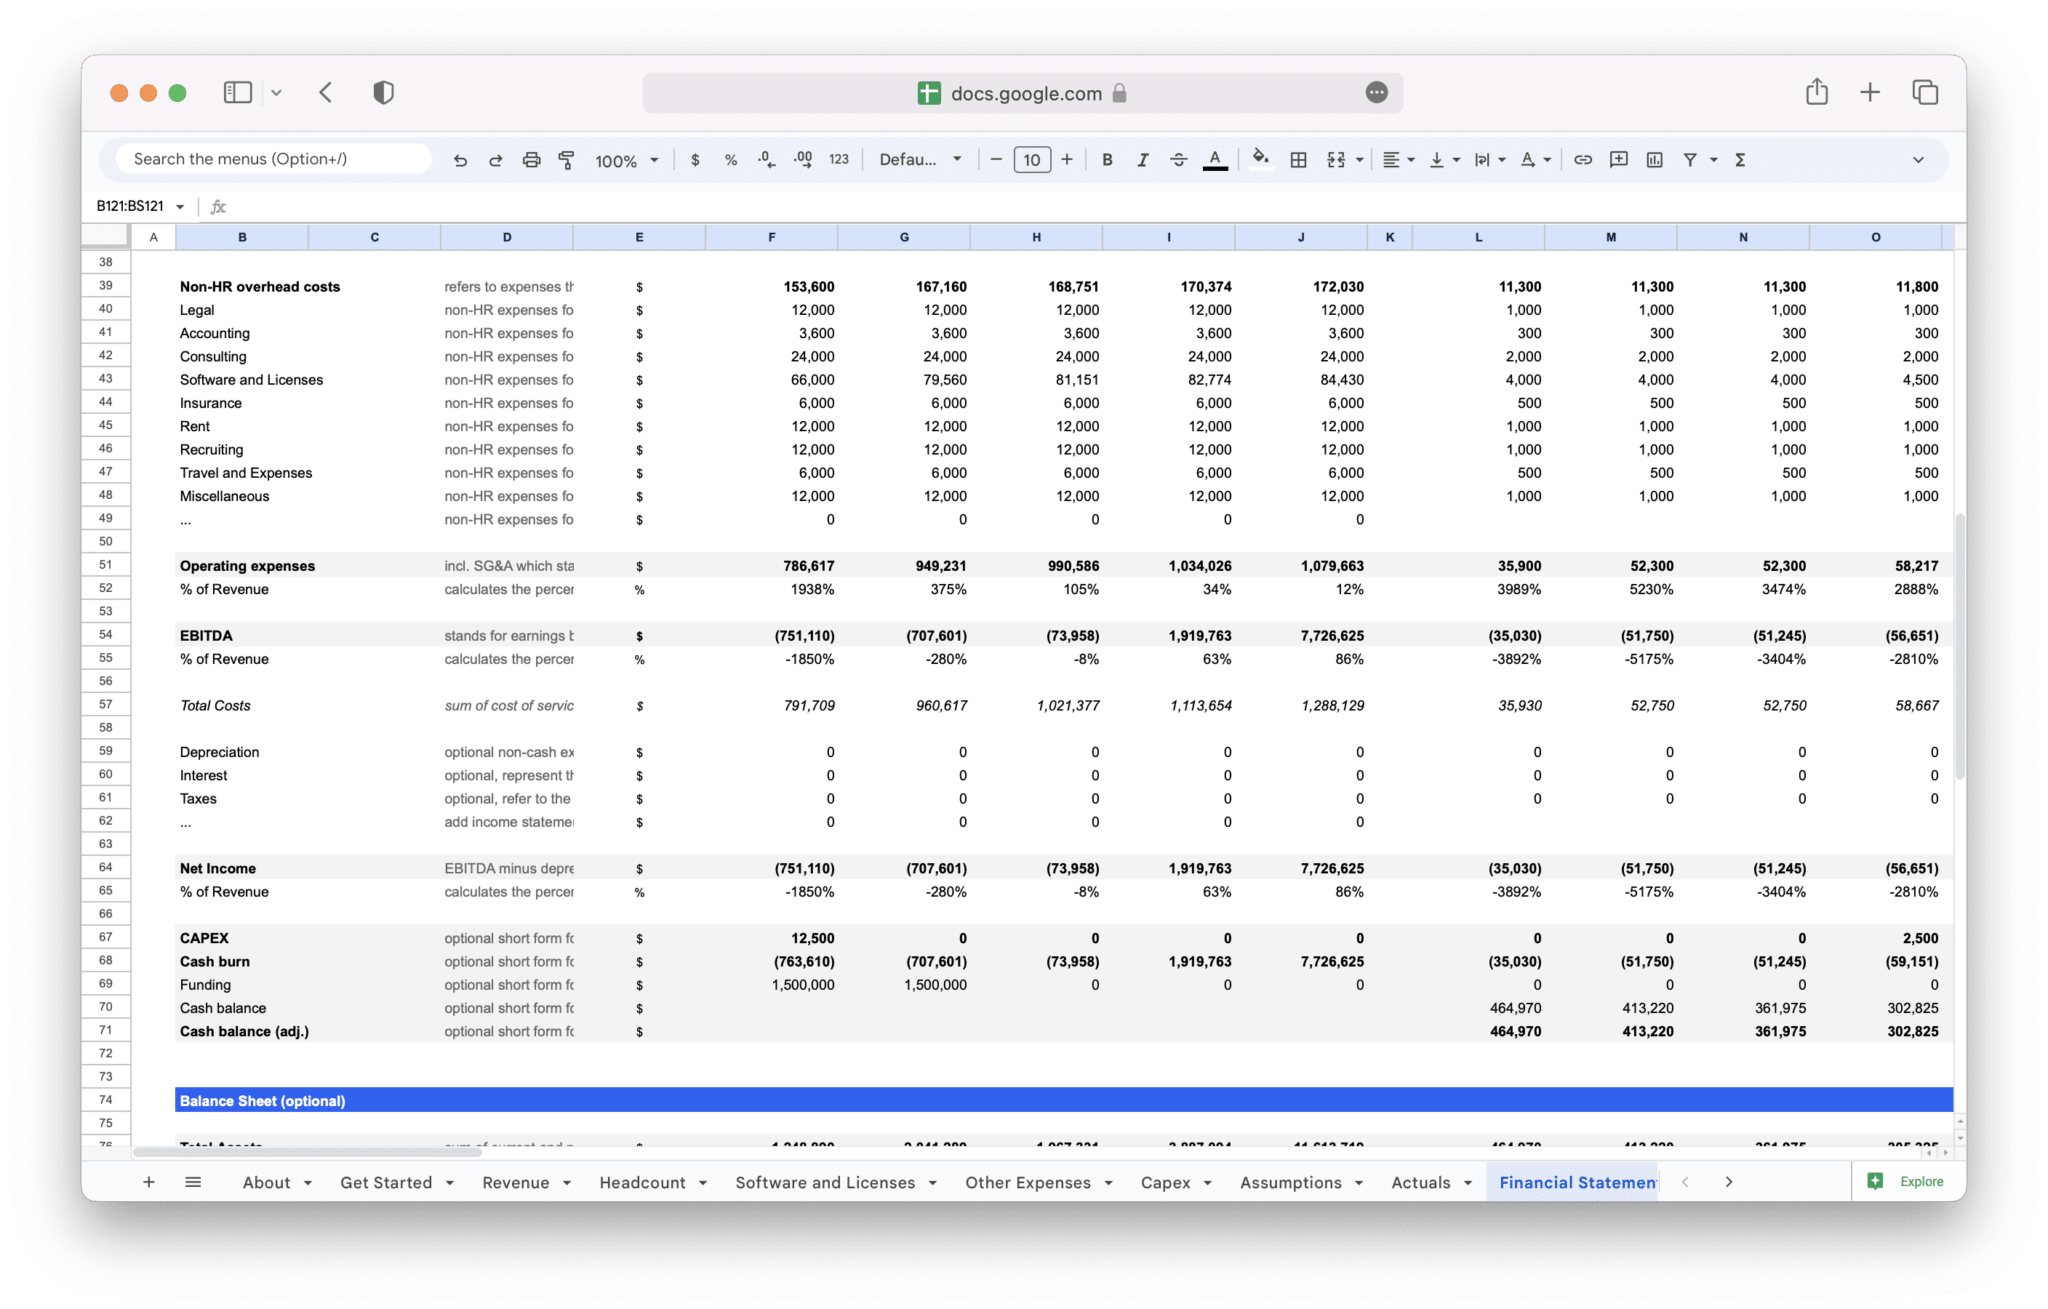
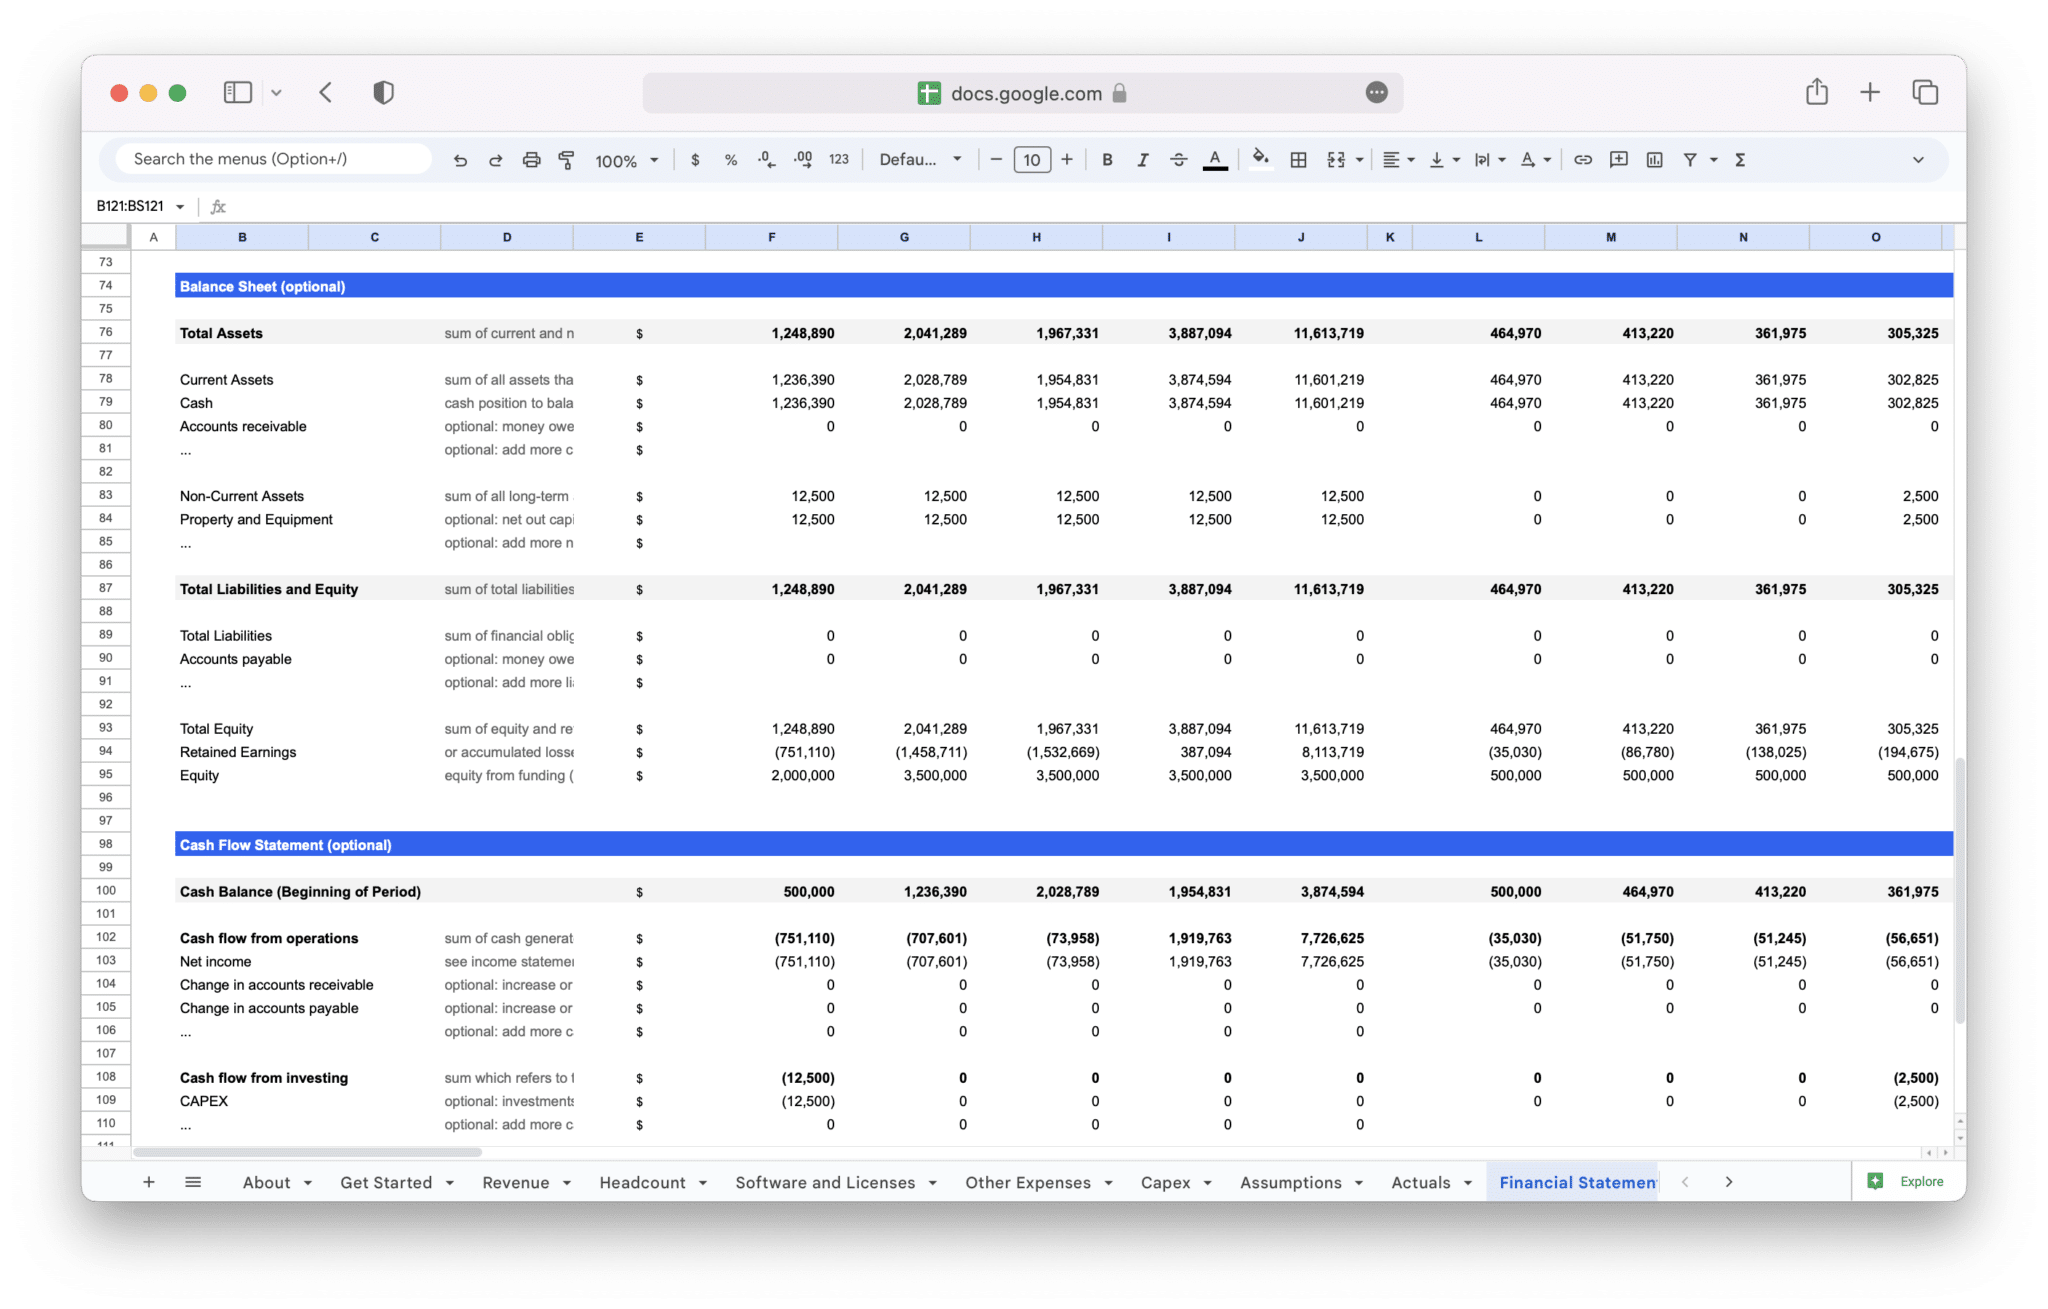
SaaS Financial Model Template
184,03 € Original price was: 184,03 €.125,21 €Current price is: 125,21 €.
32% Off
Value added tax is not collected, as small businesses according to §19 (1) UStG.
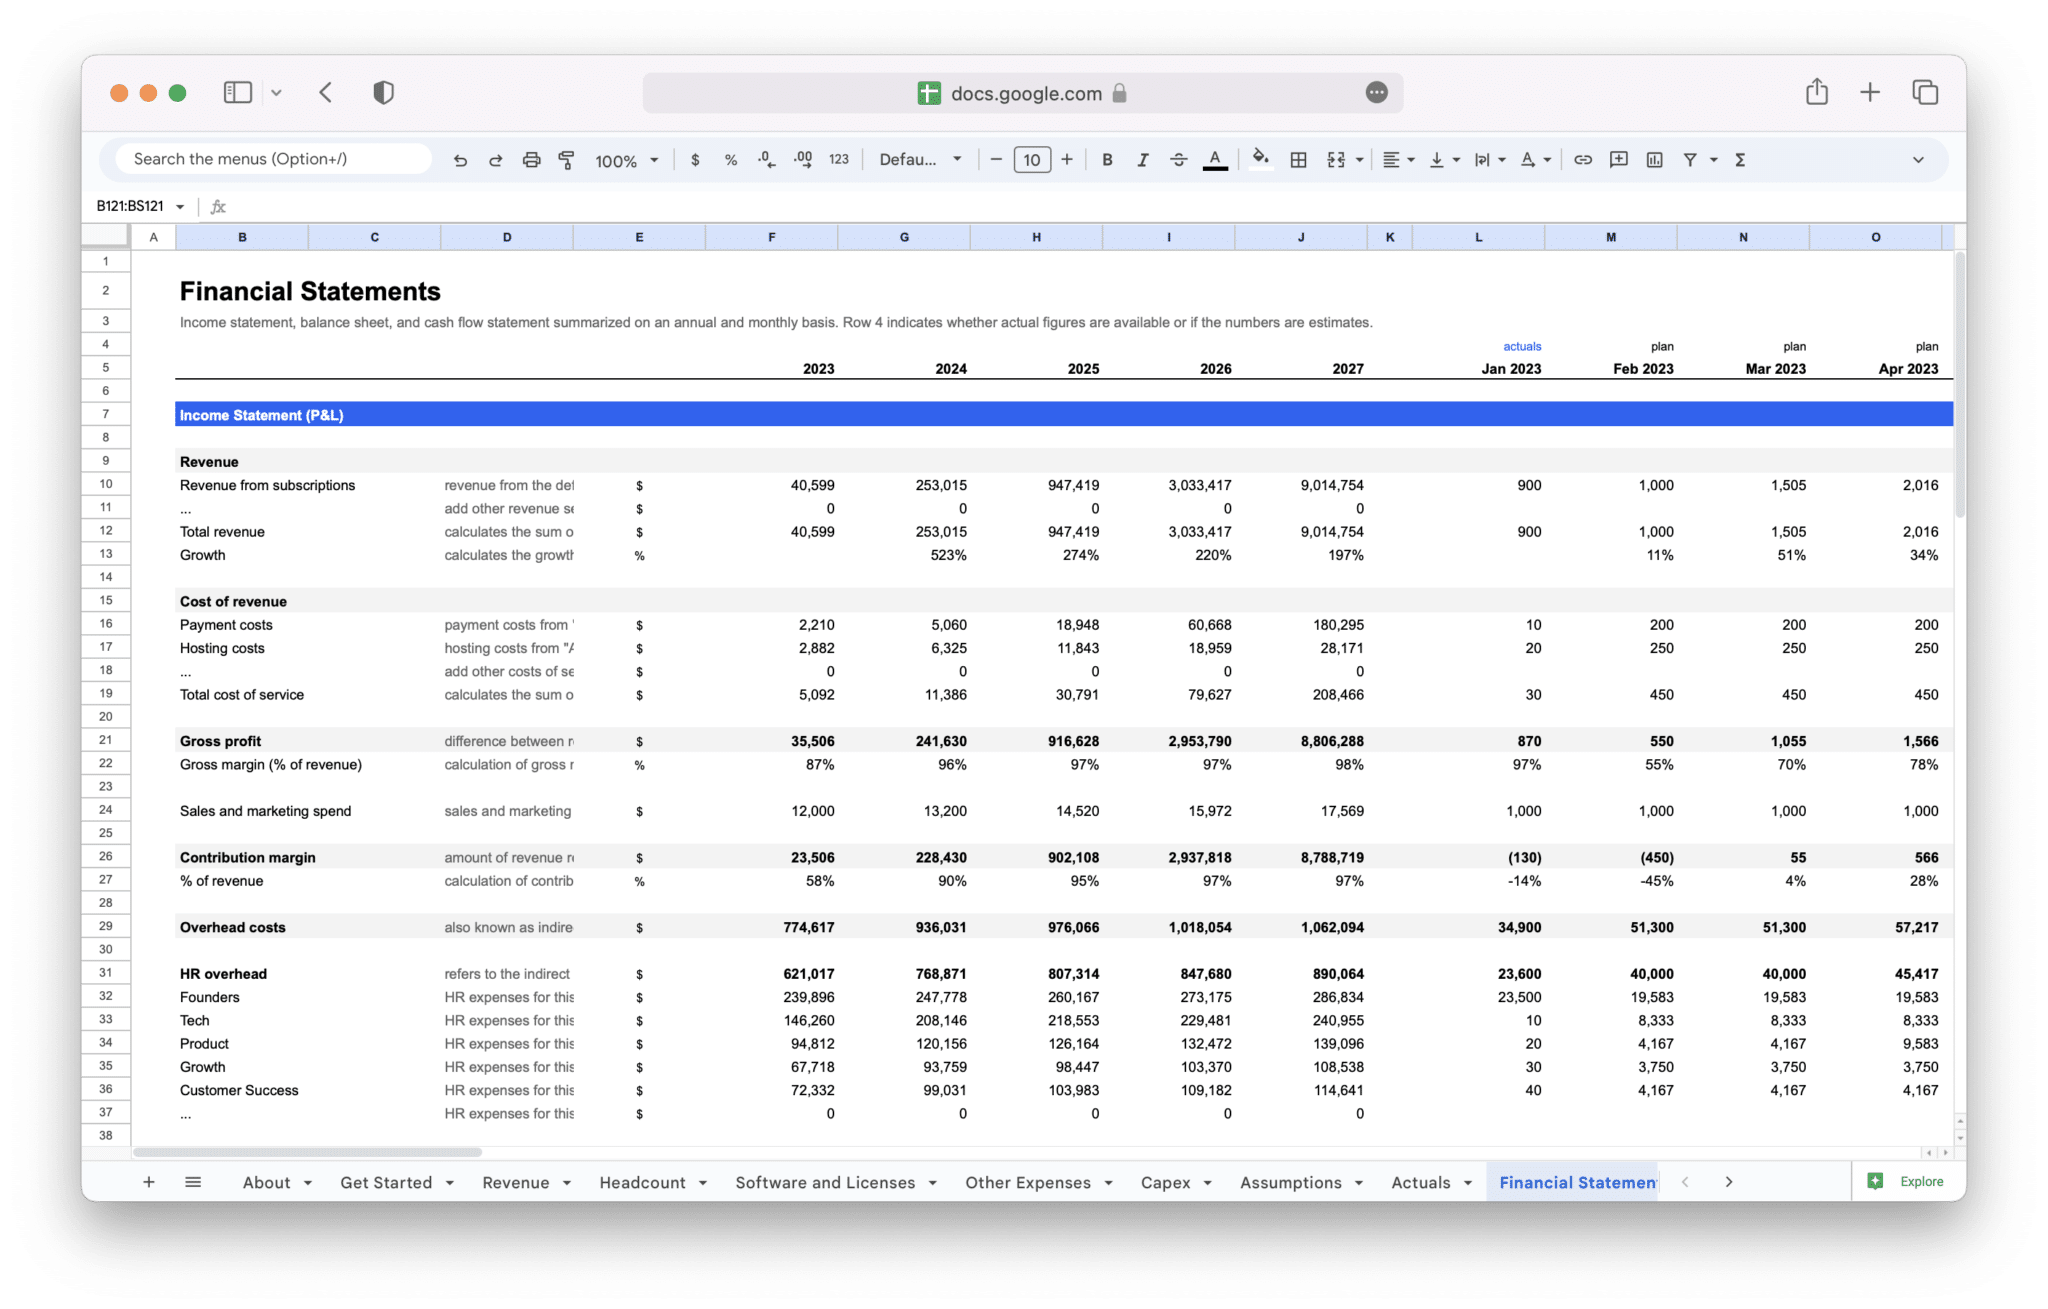
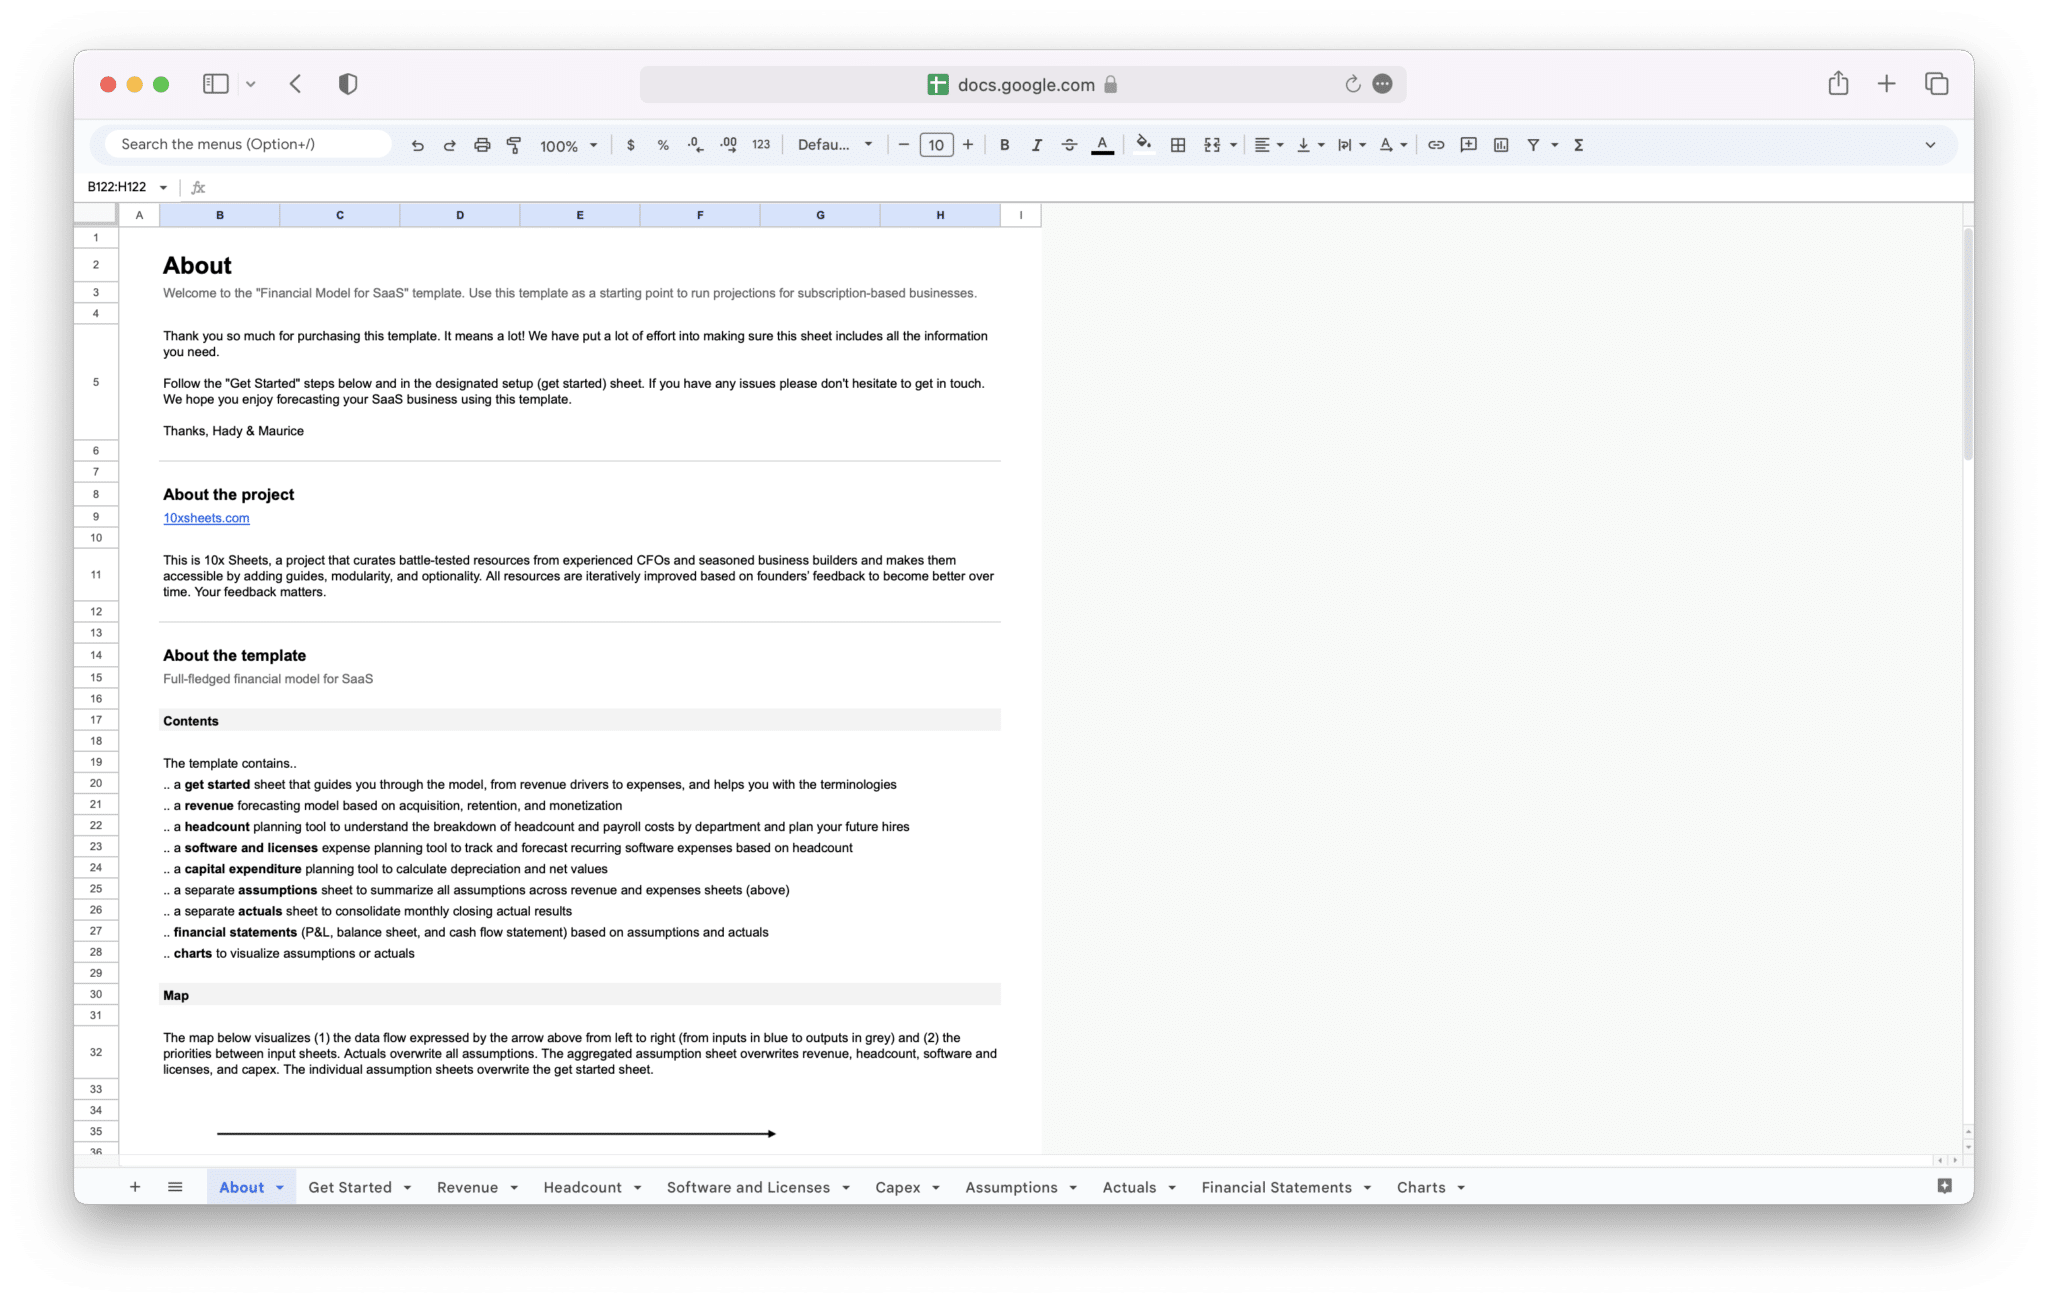
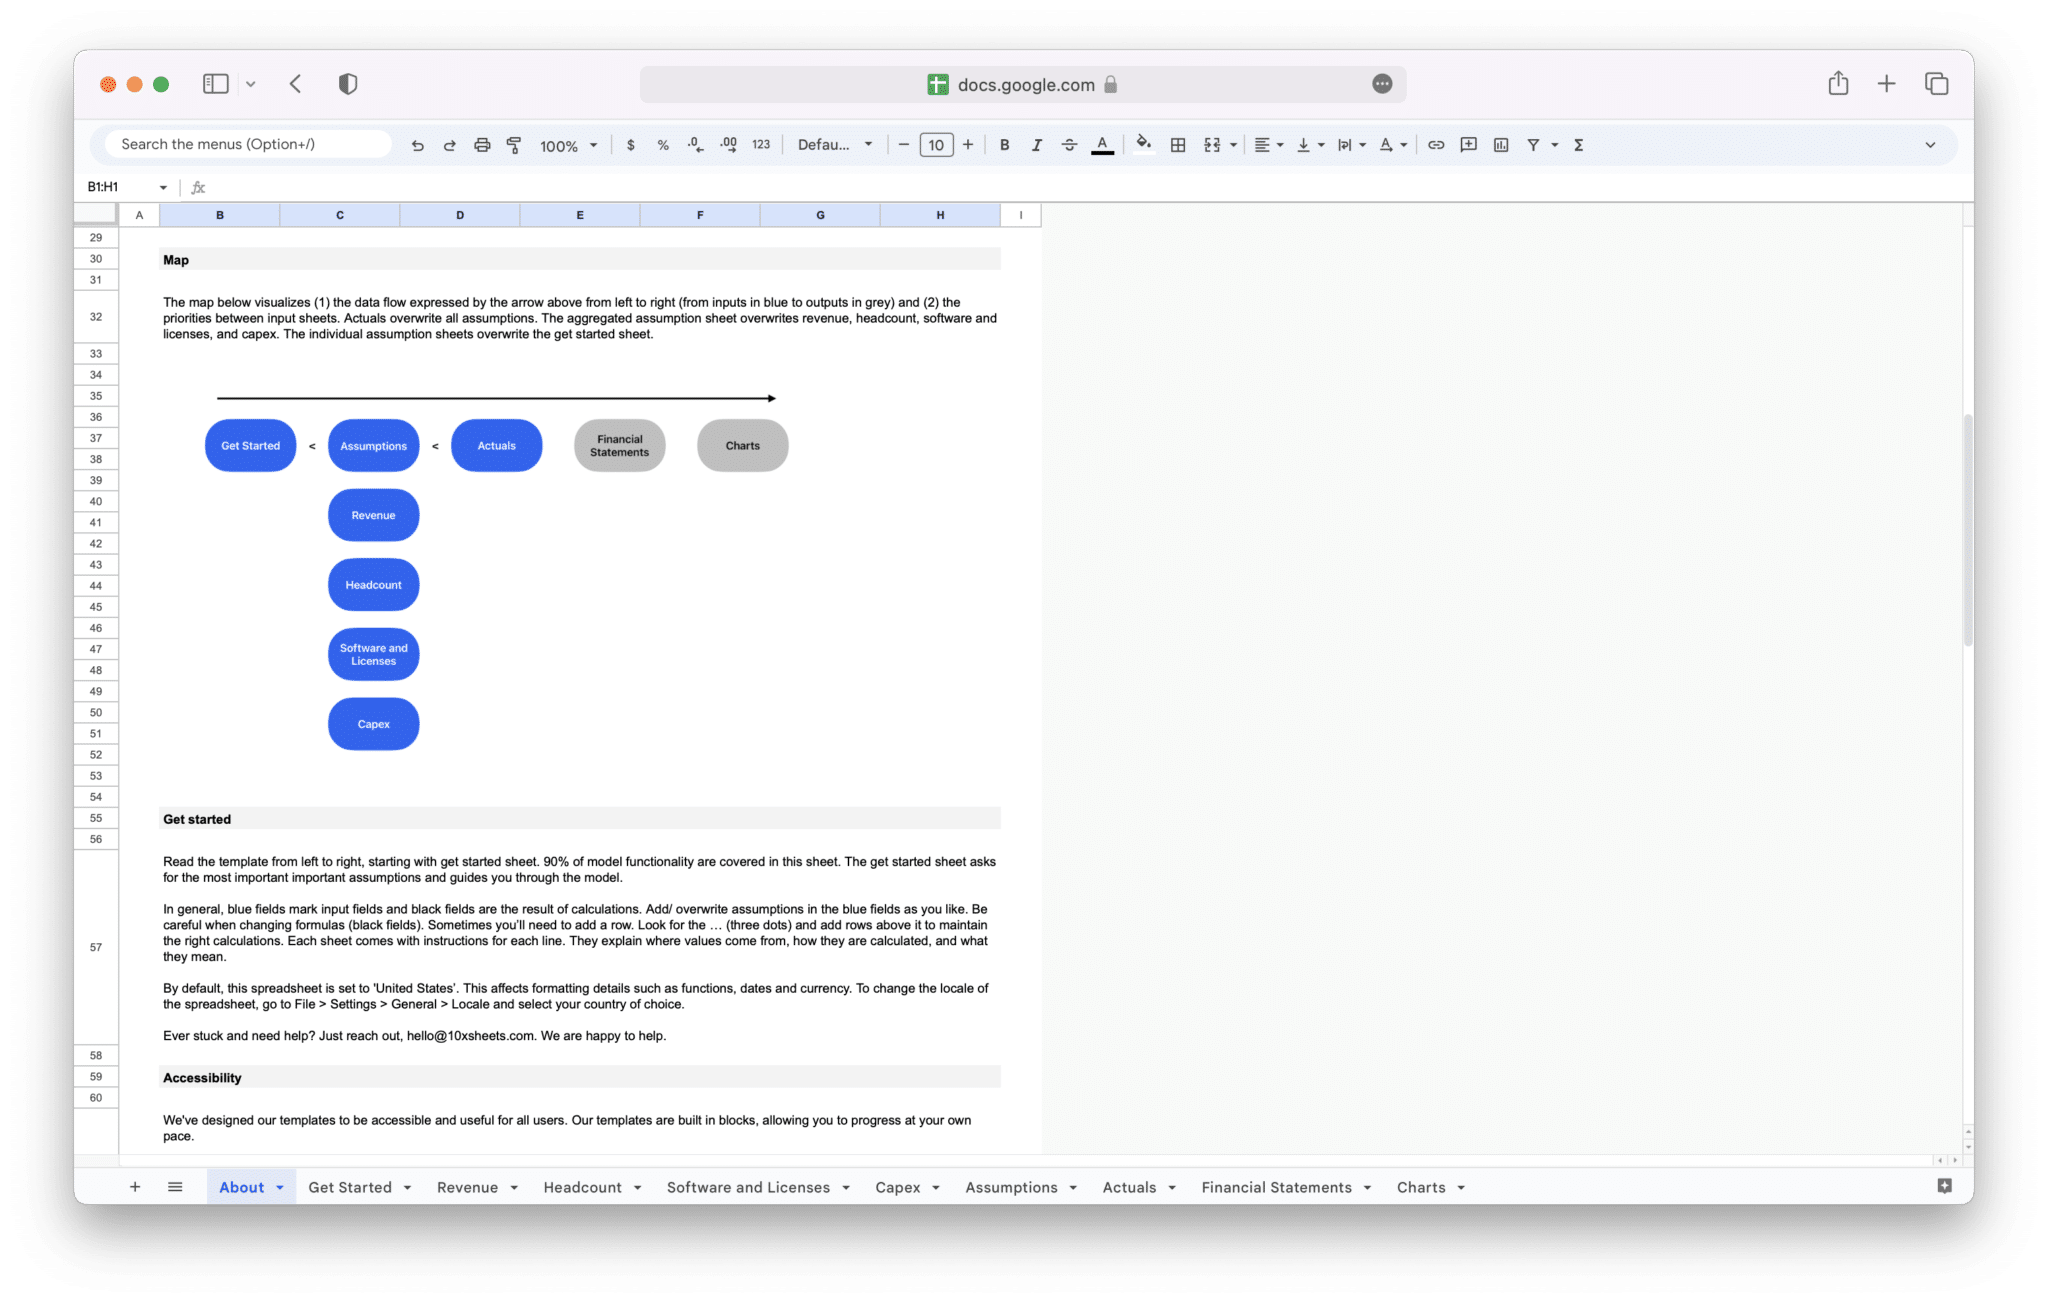
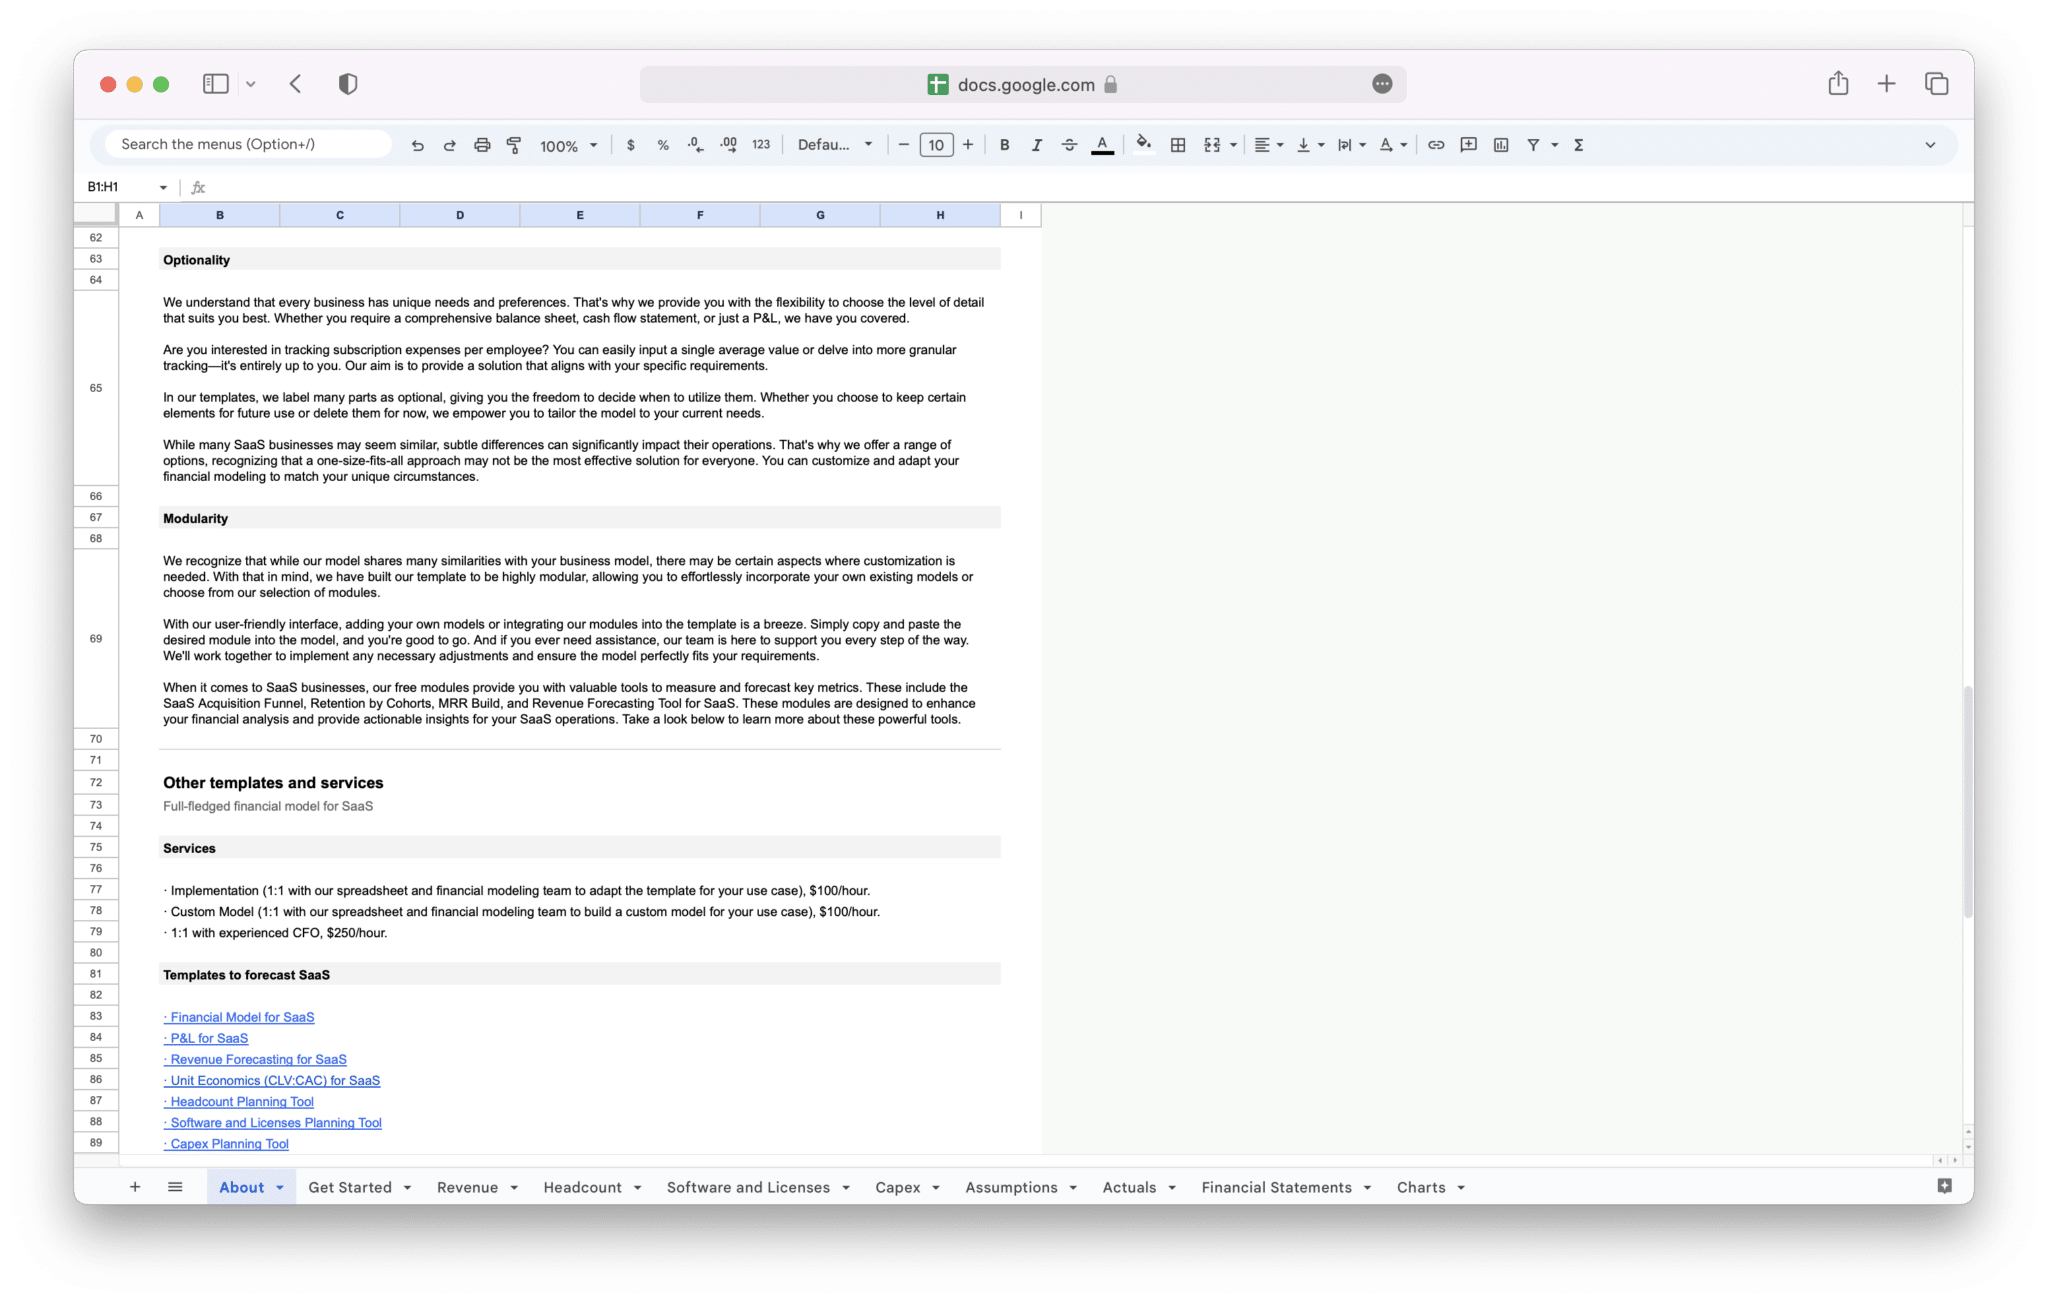
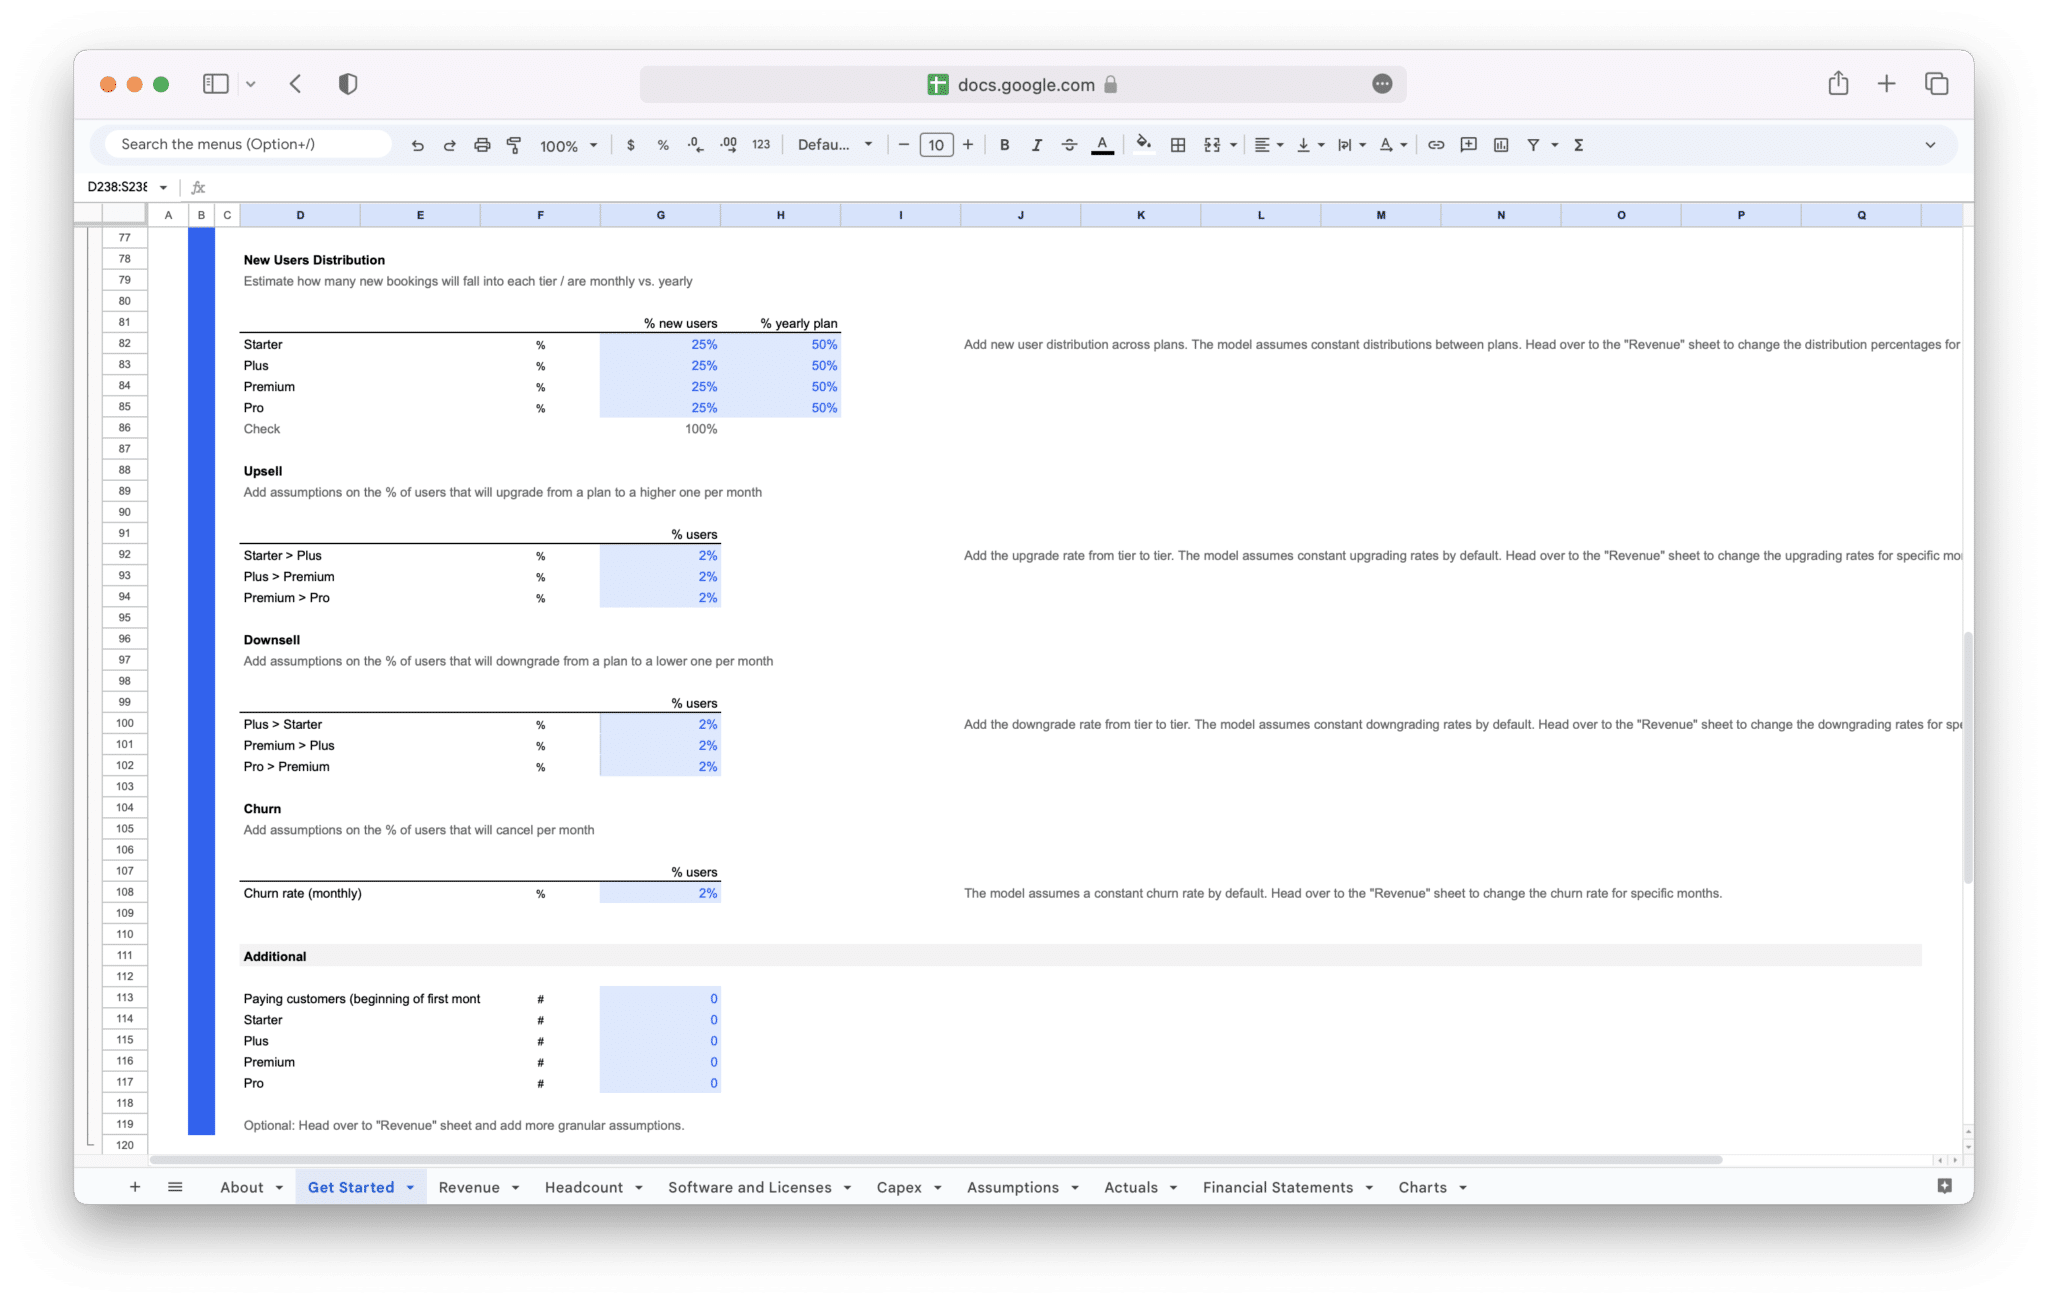
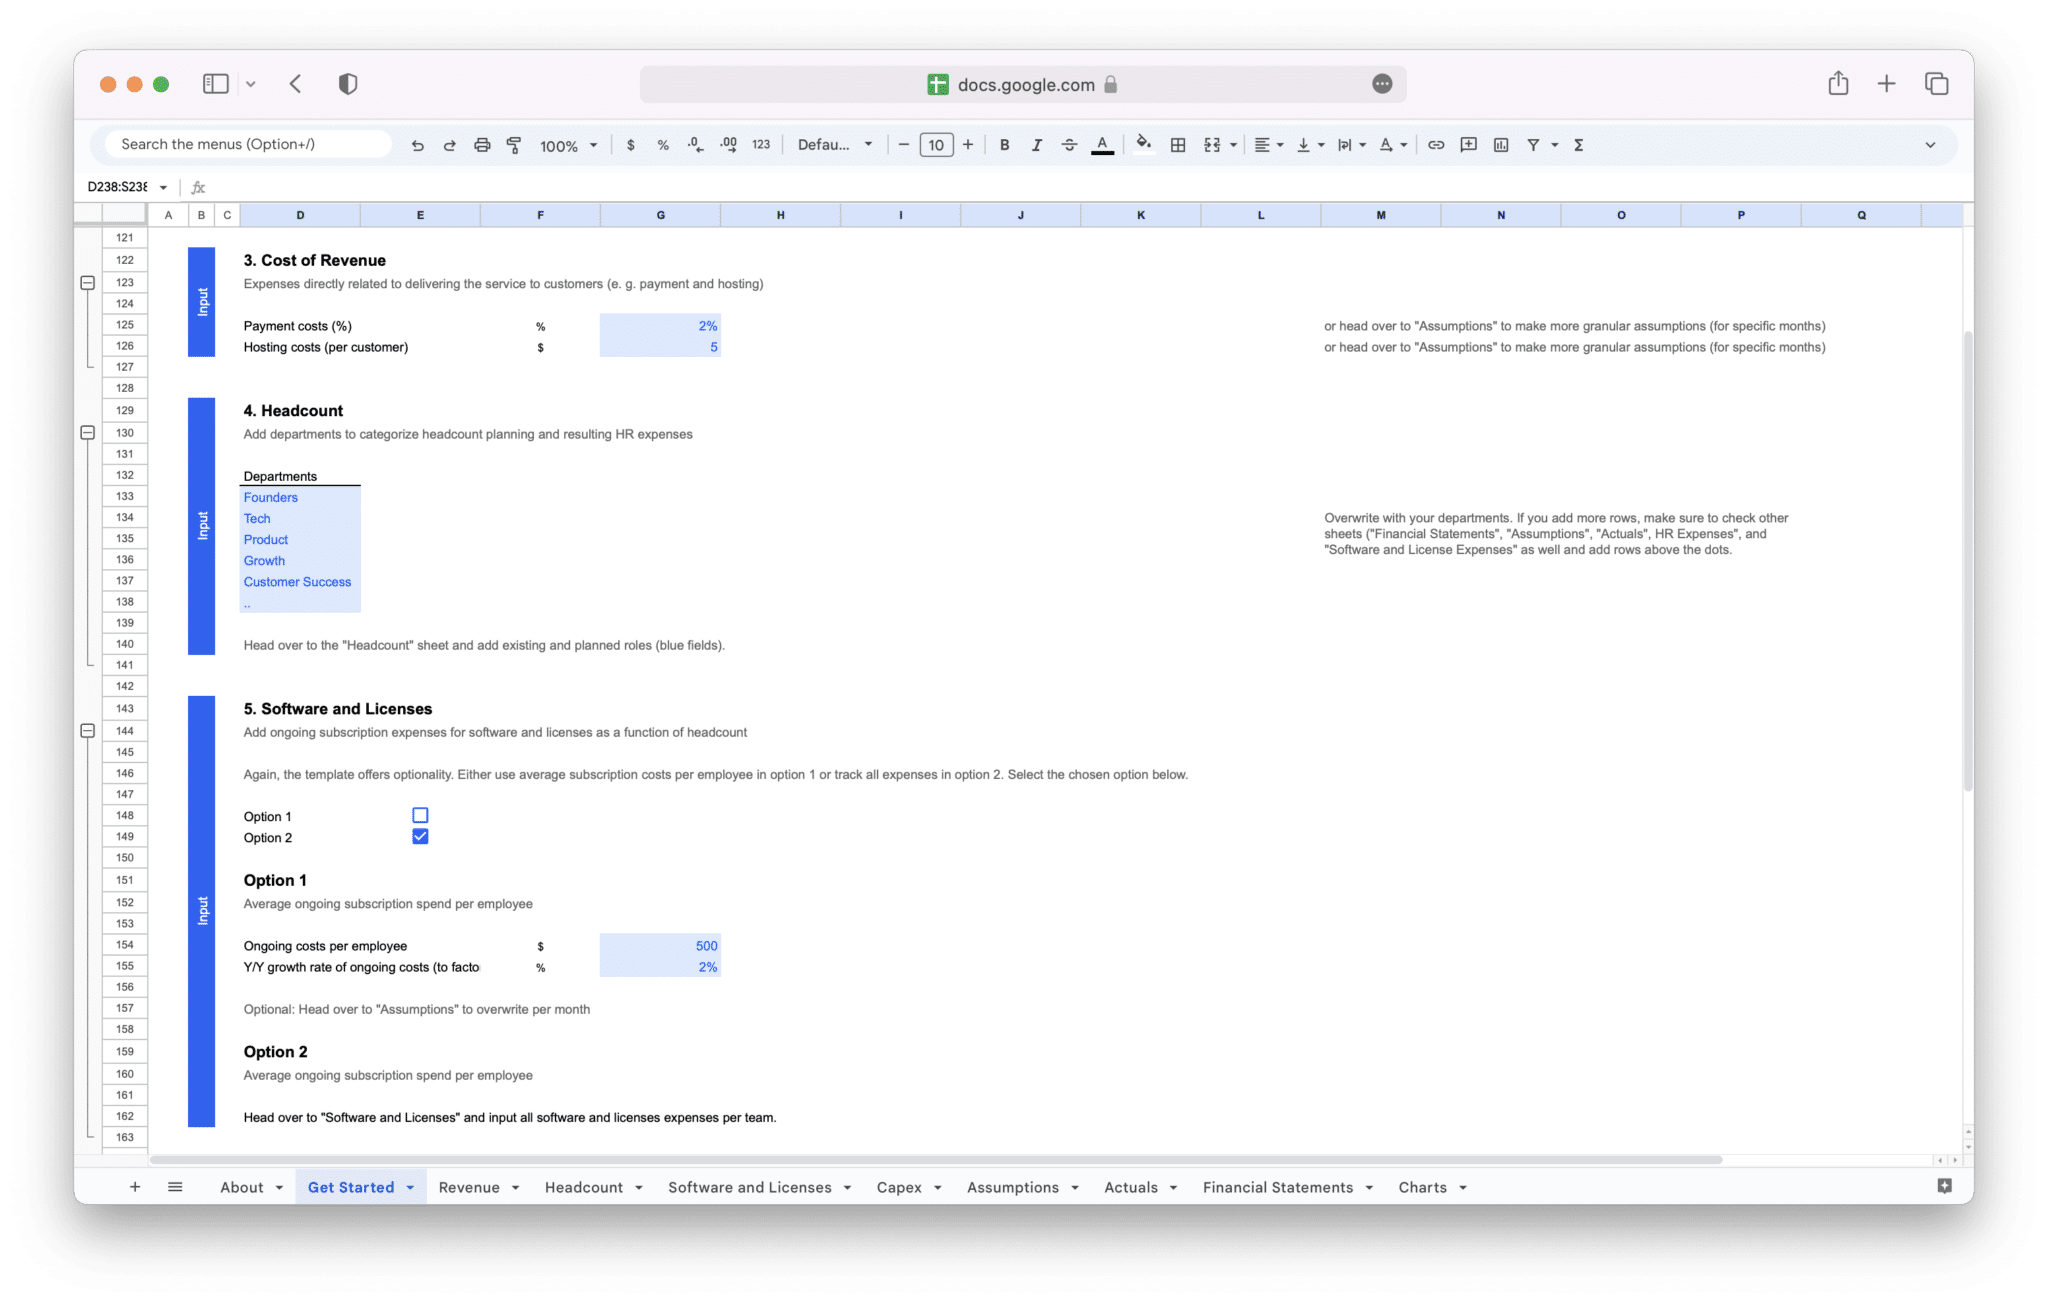
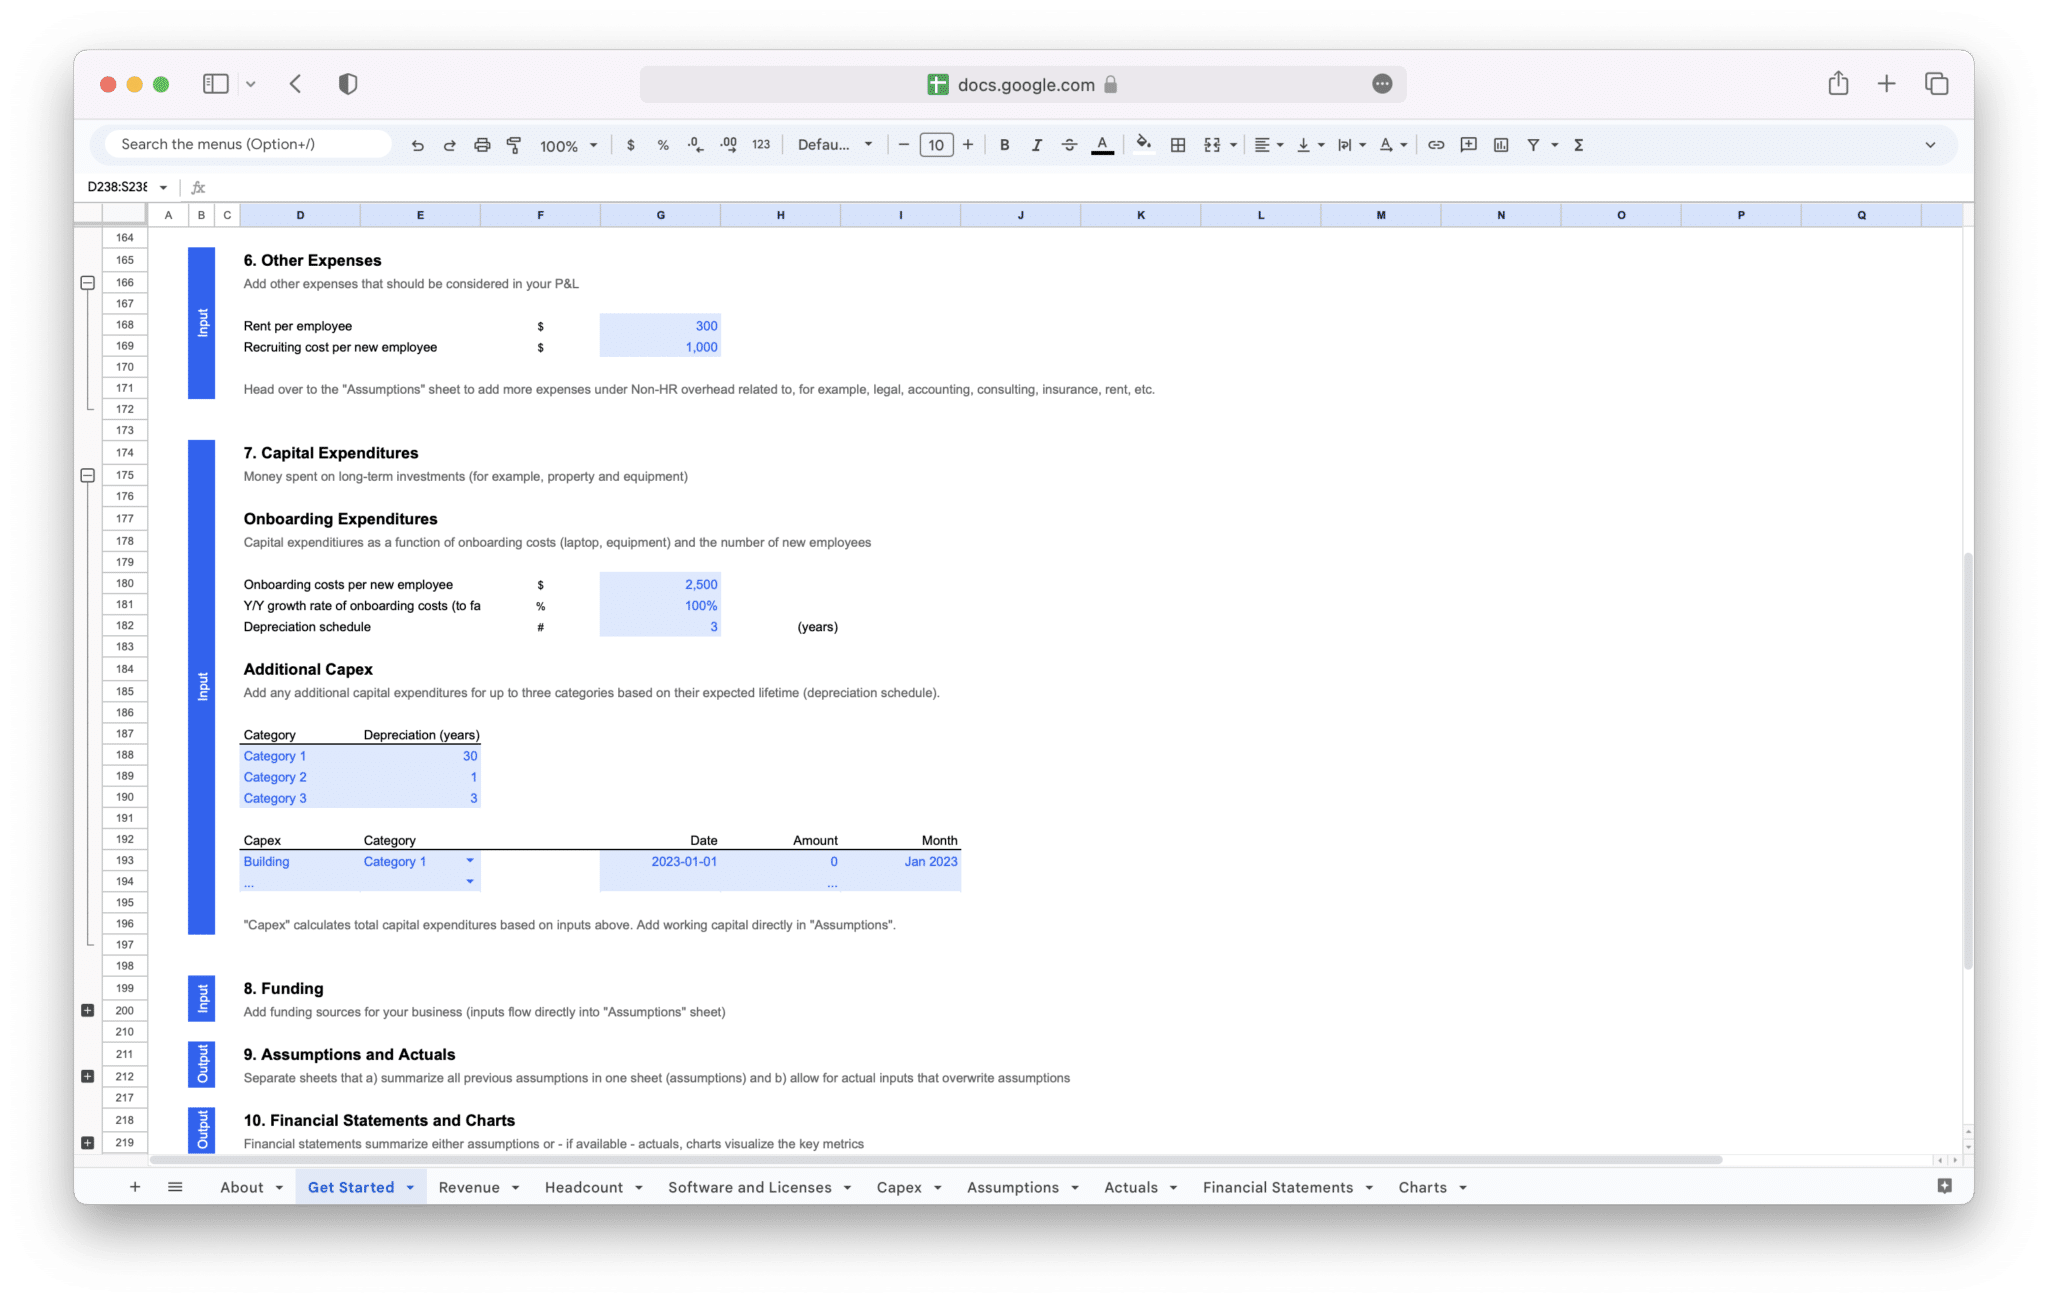
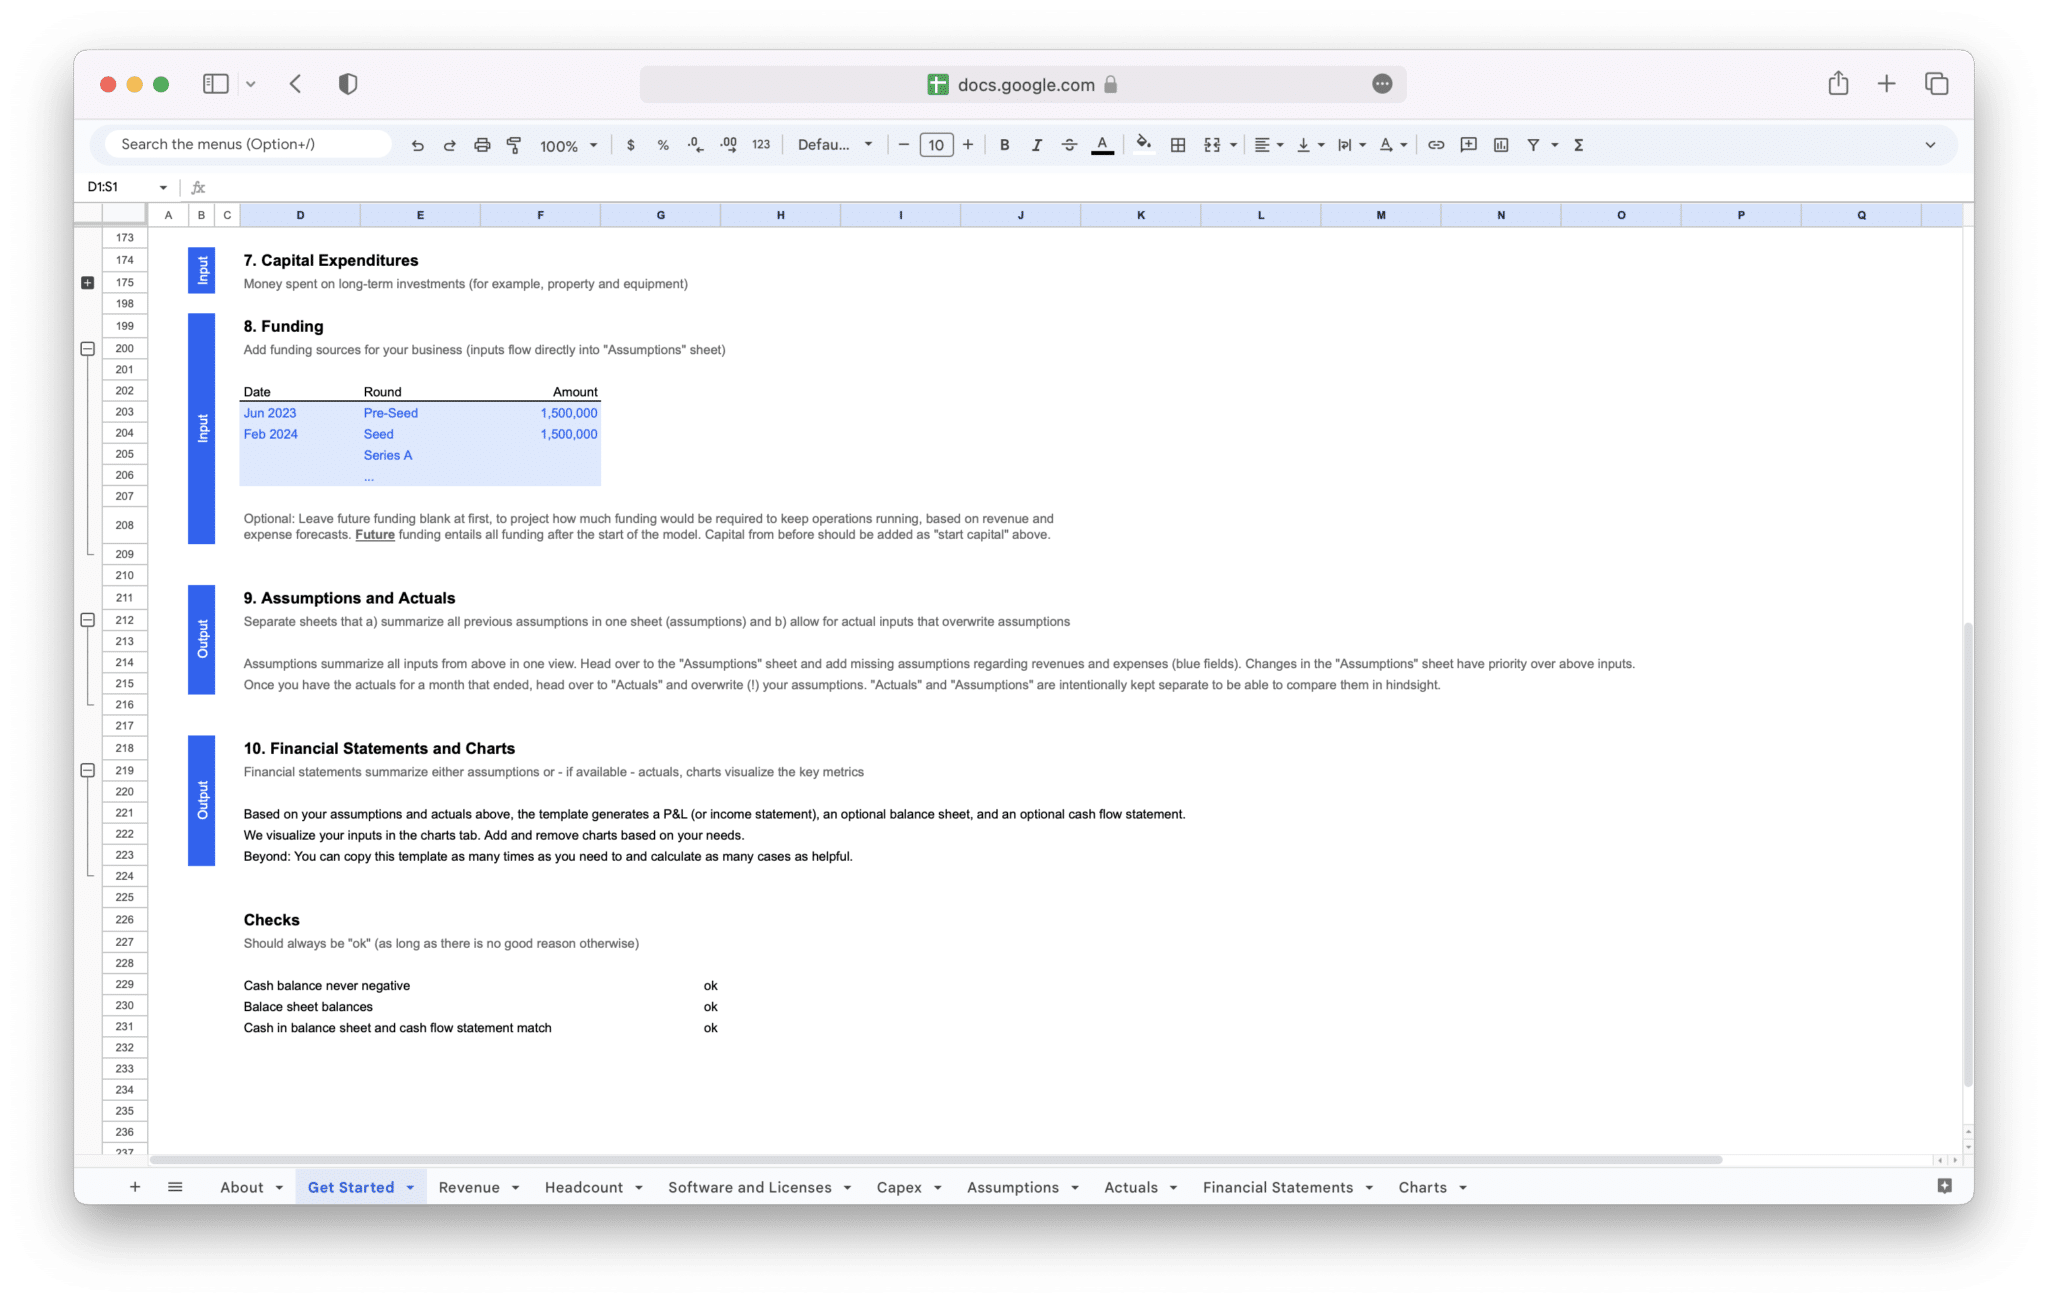
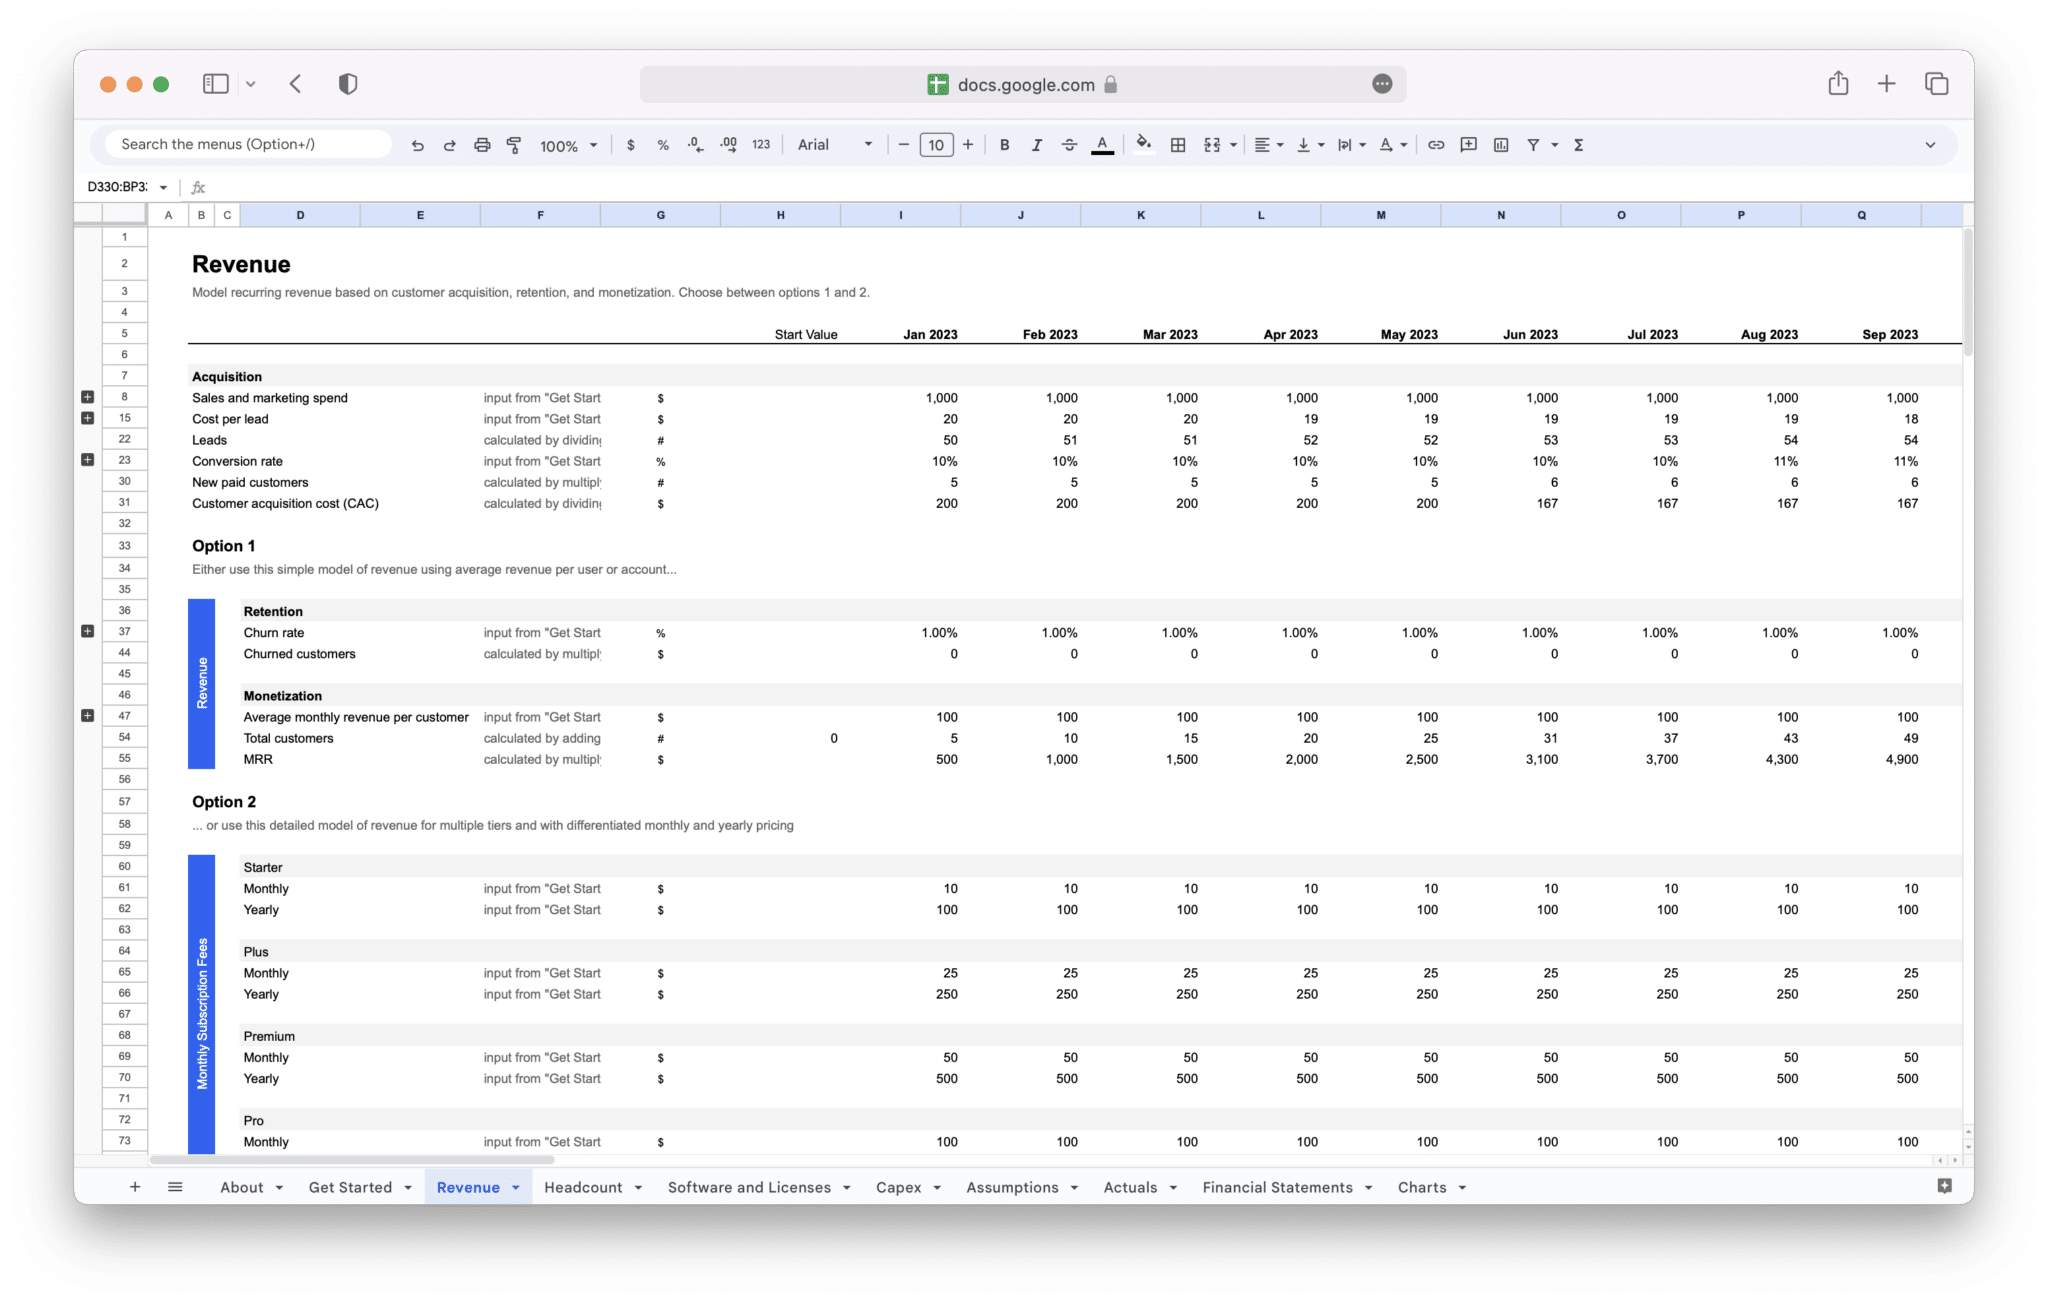
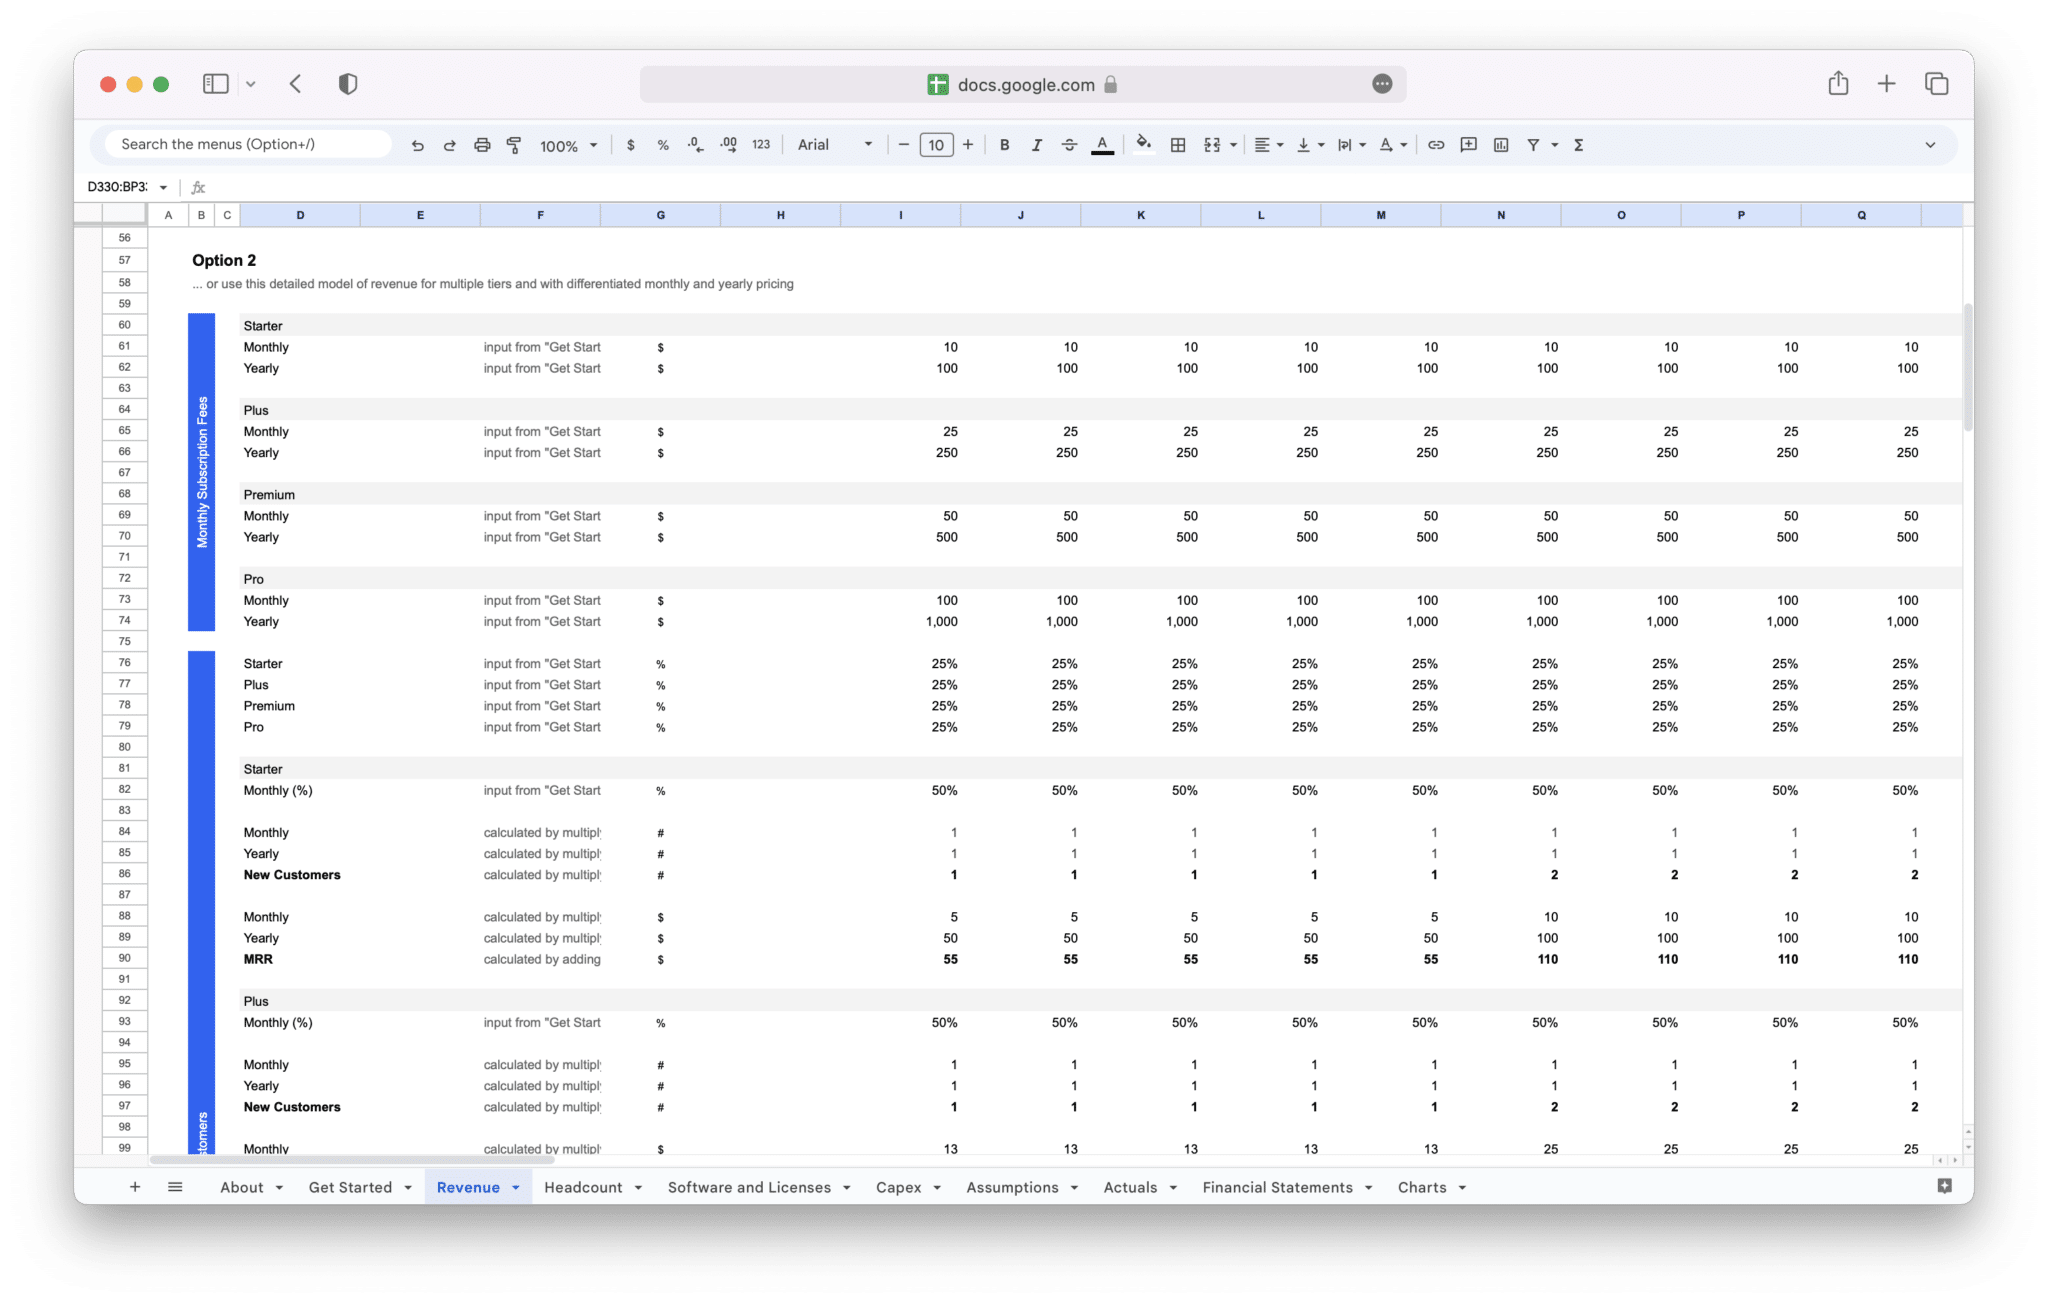
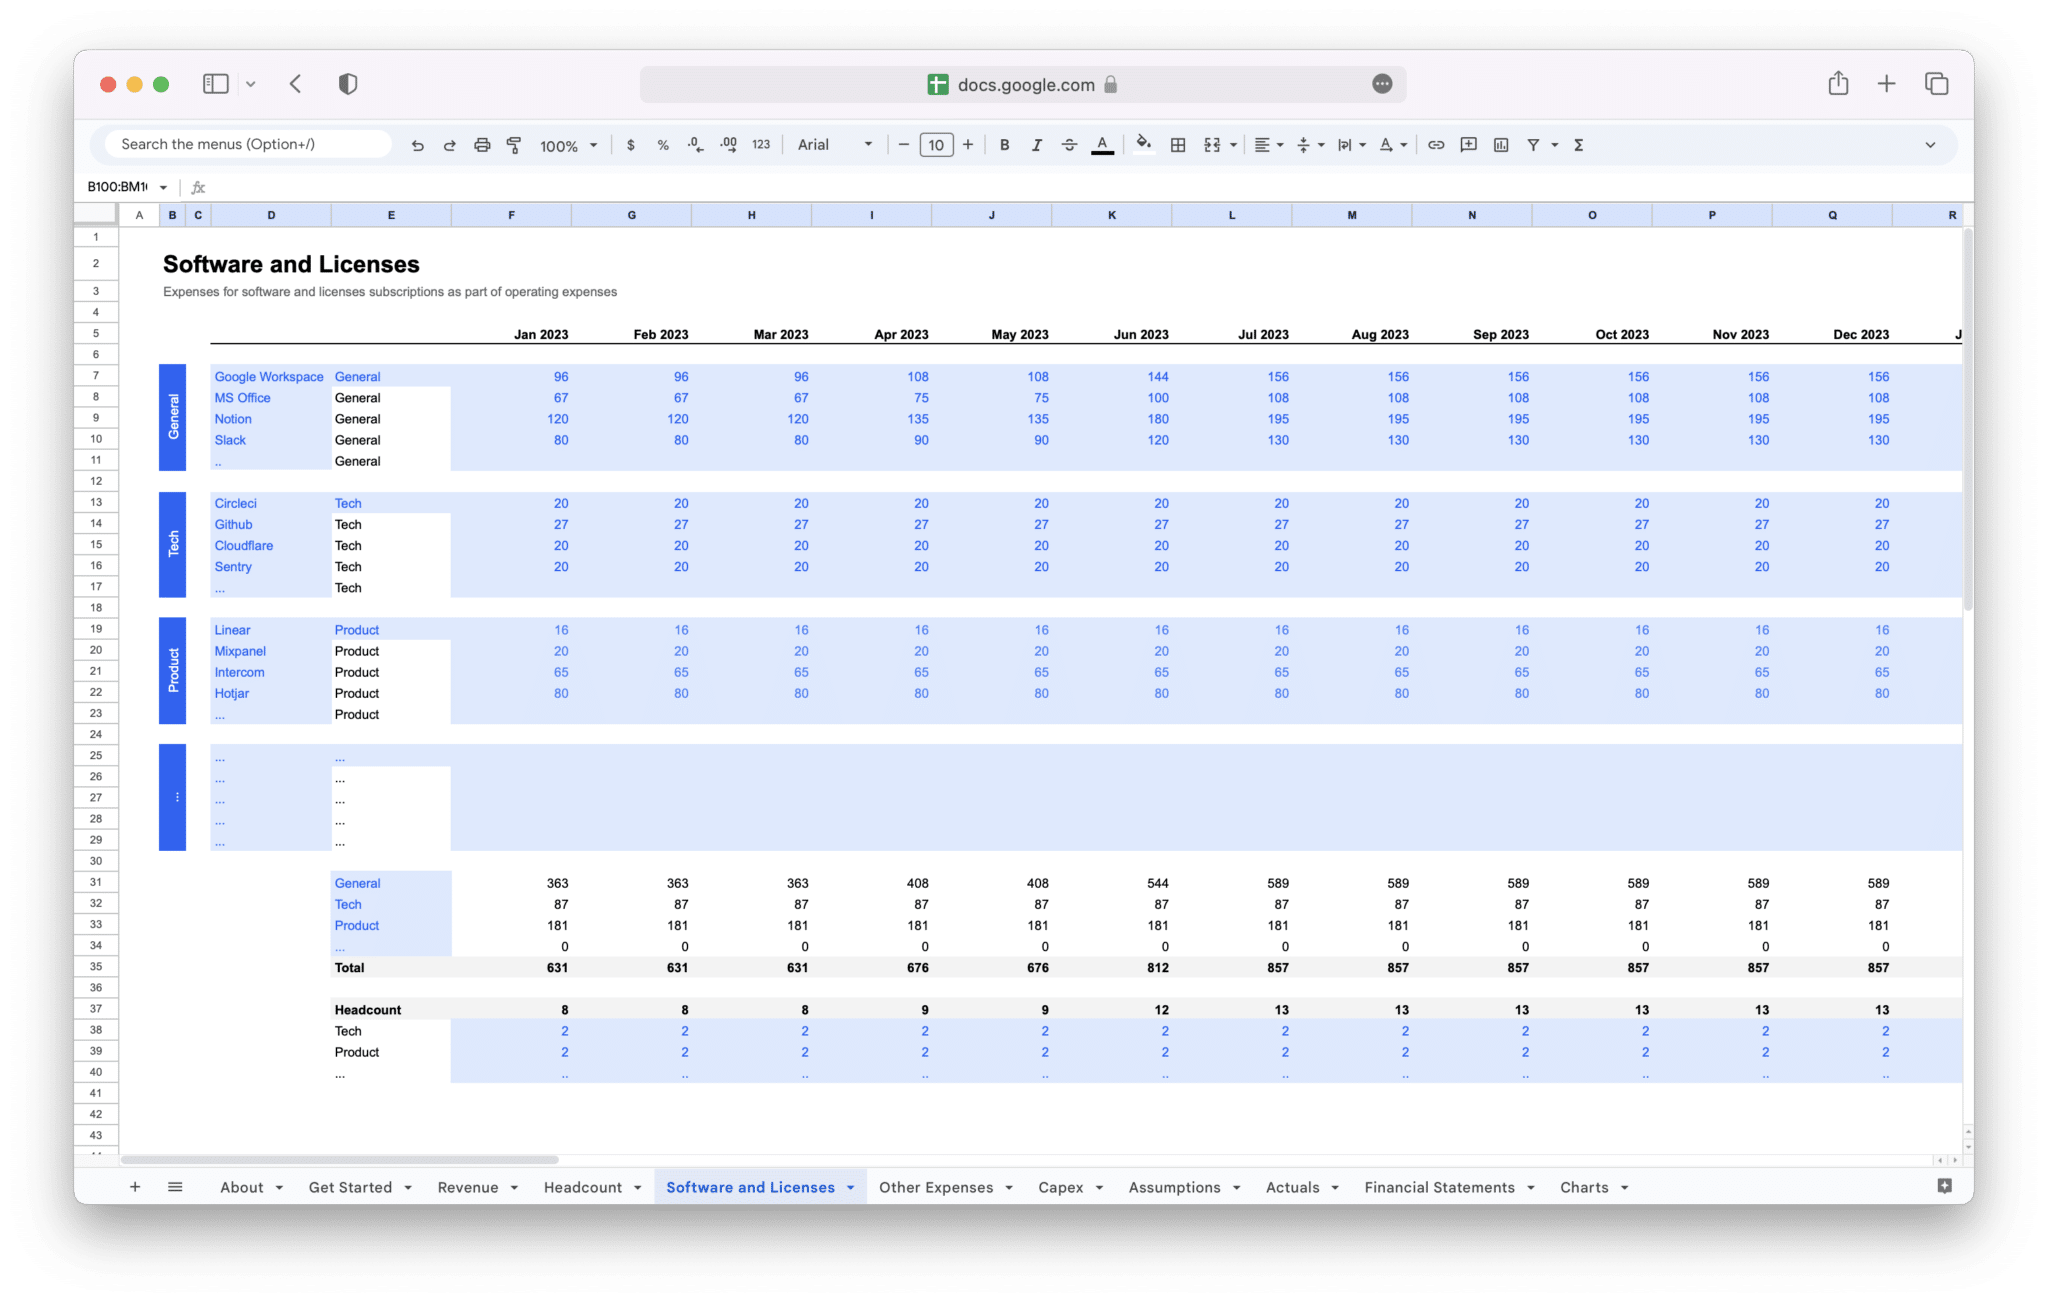
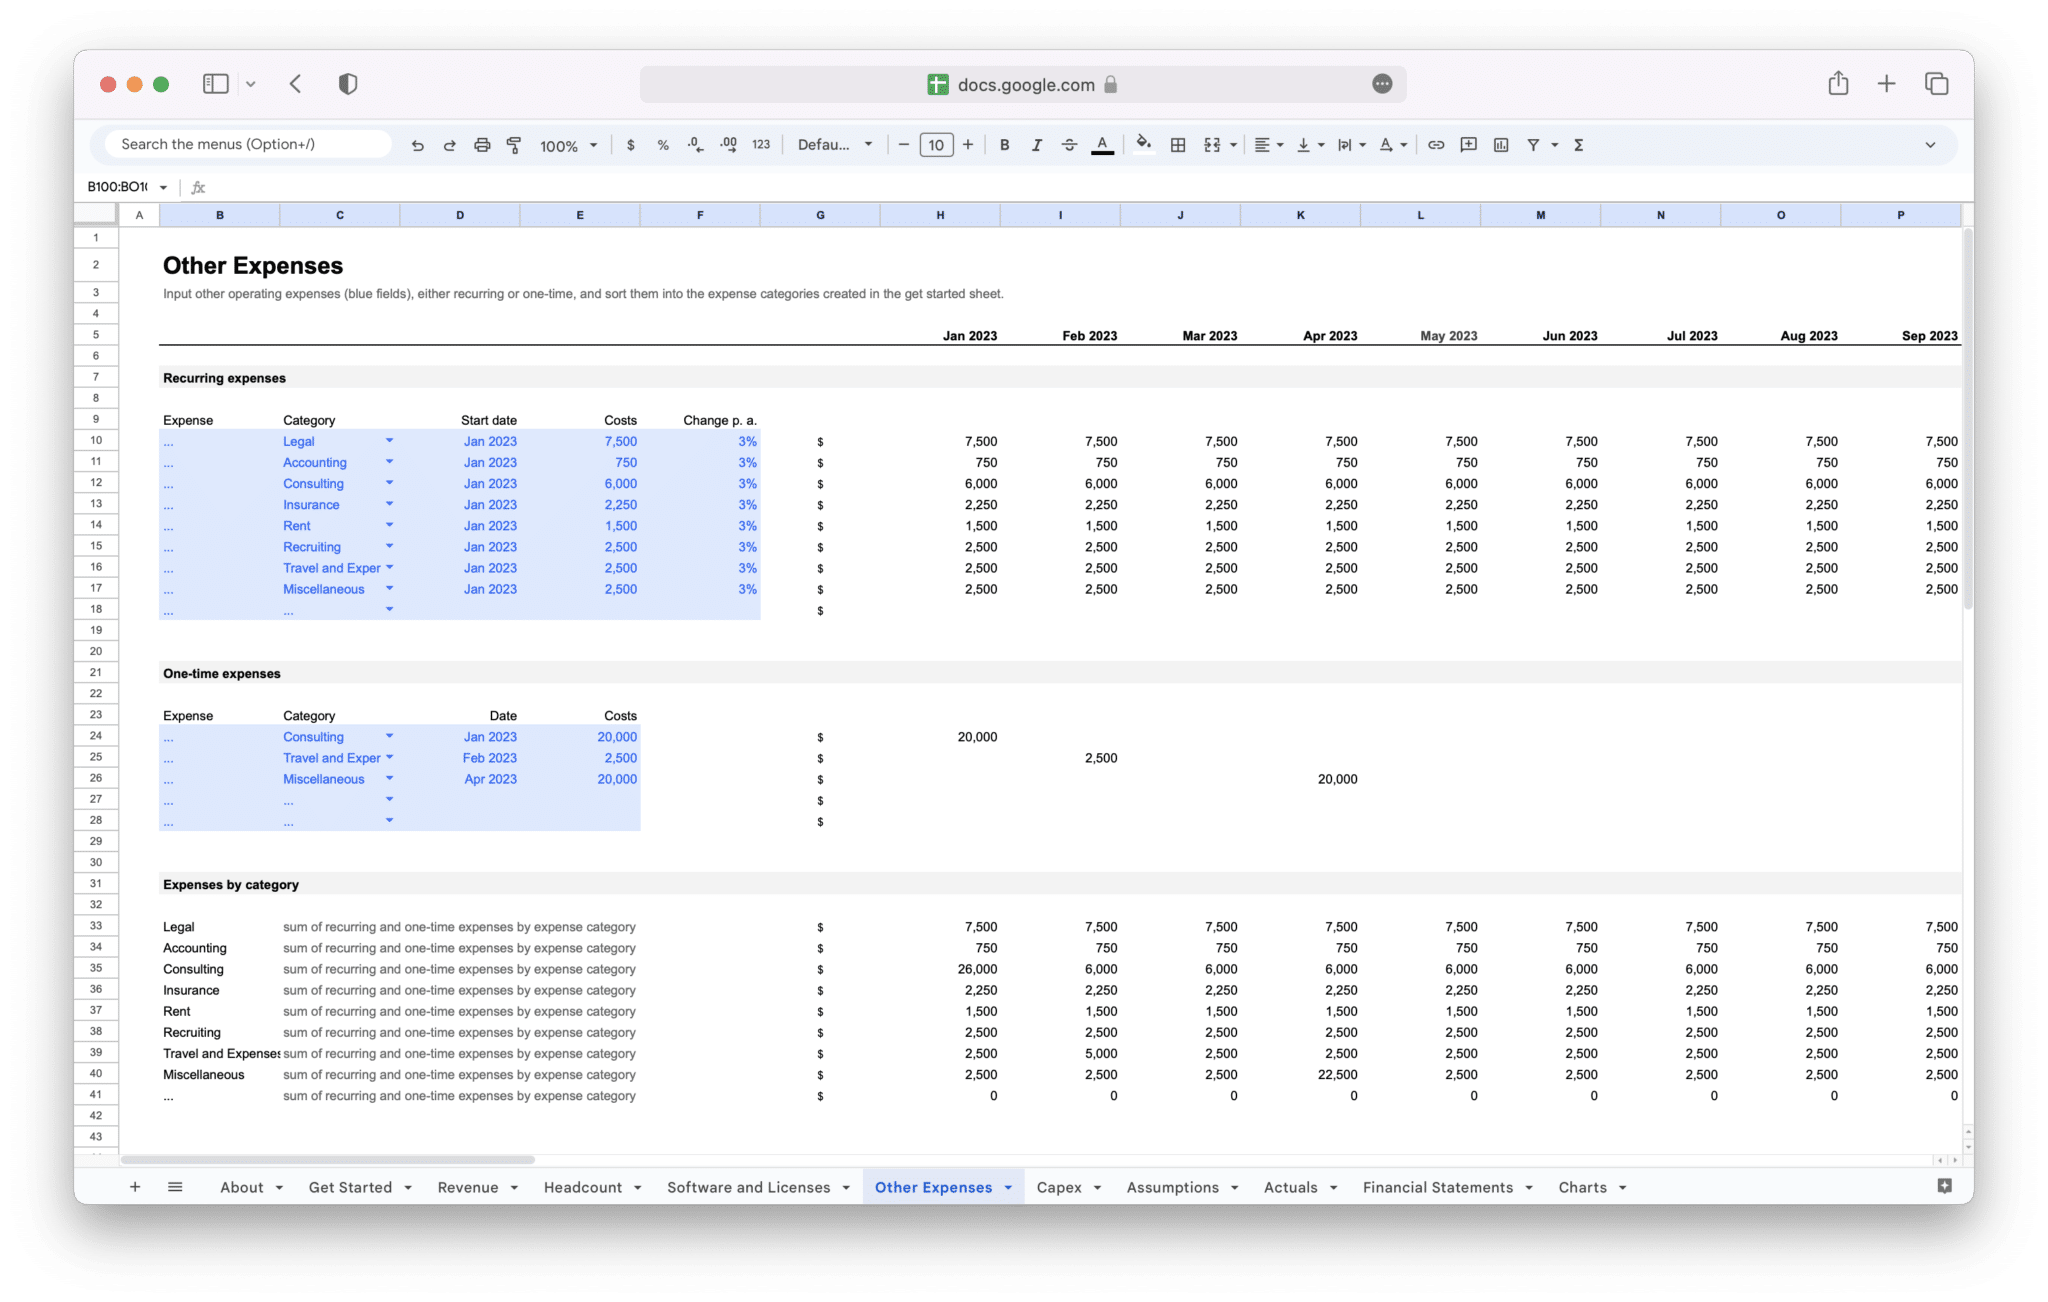
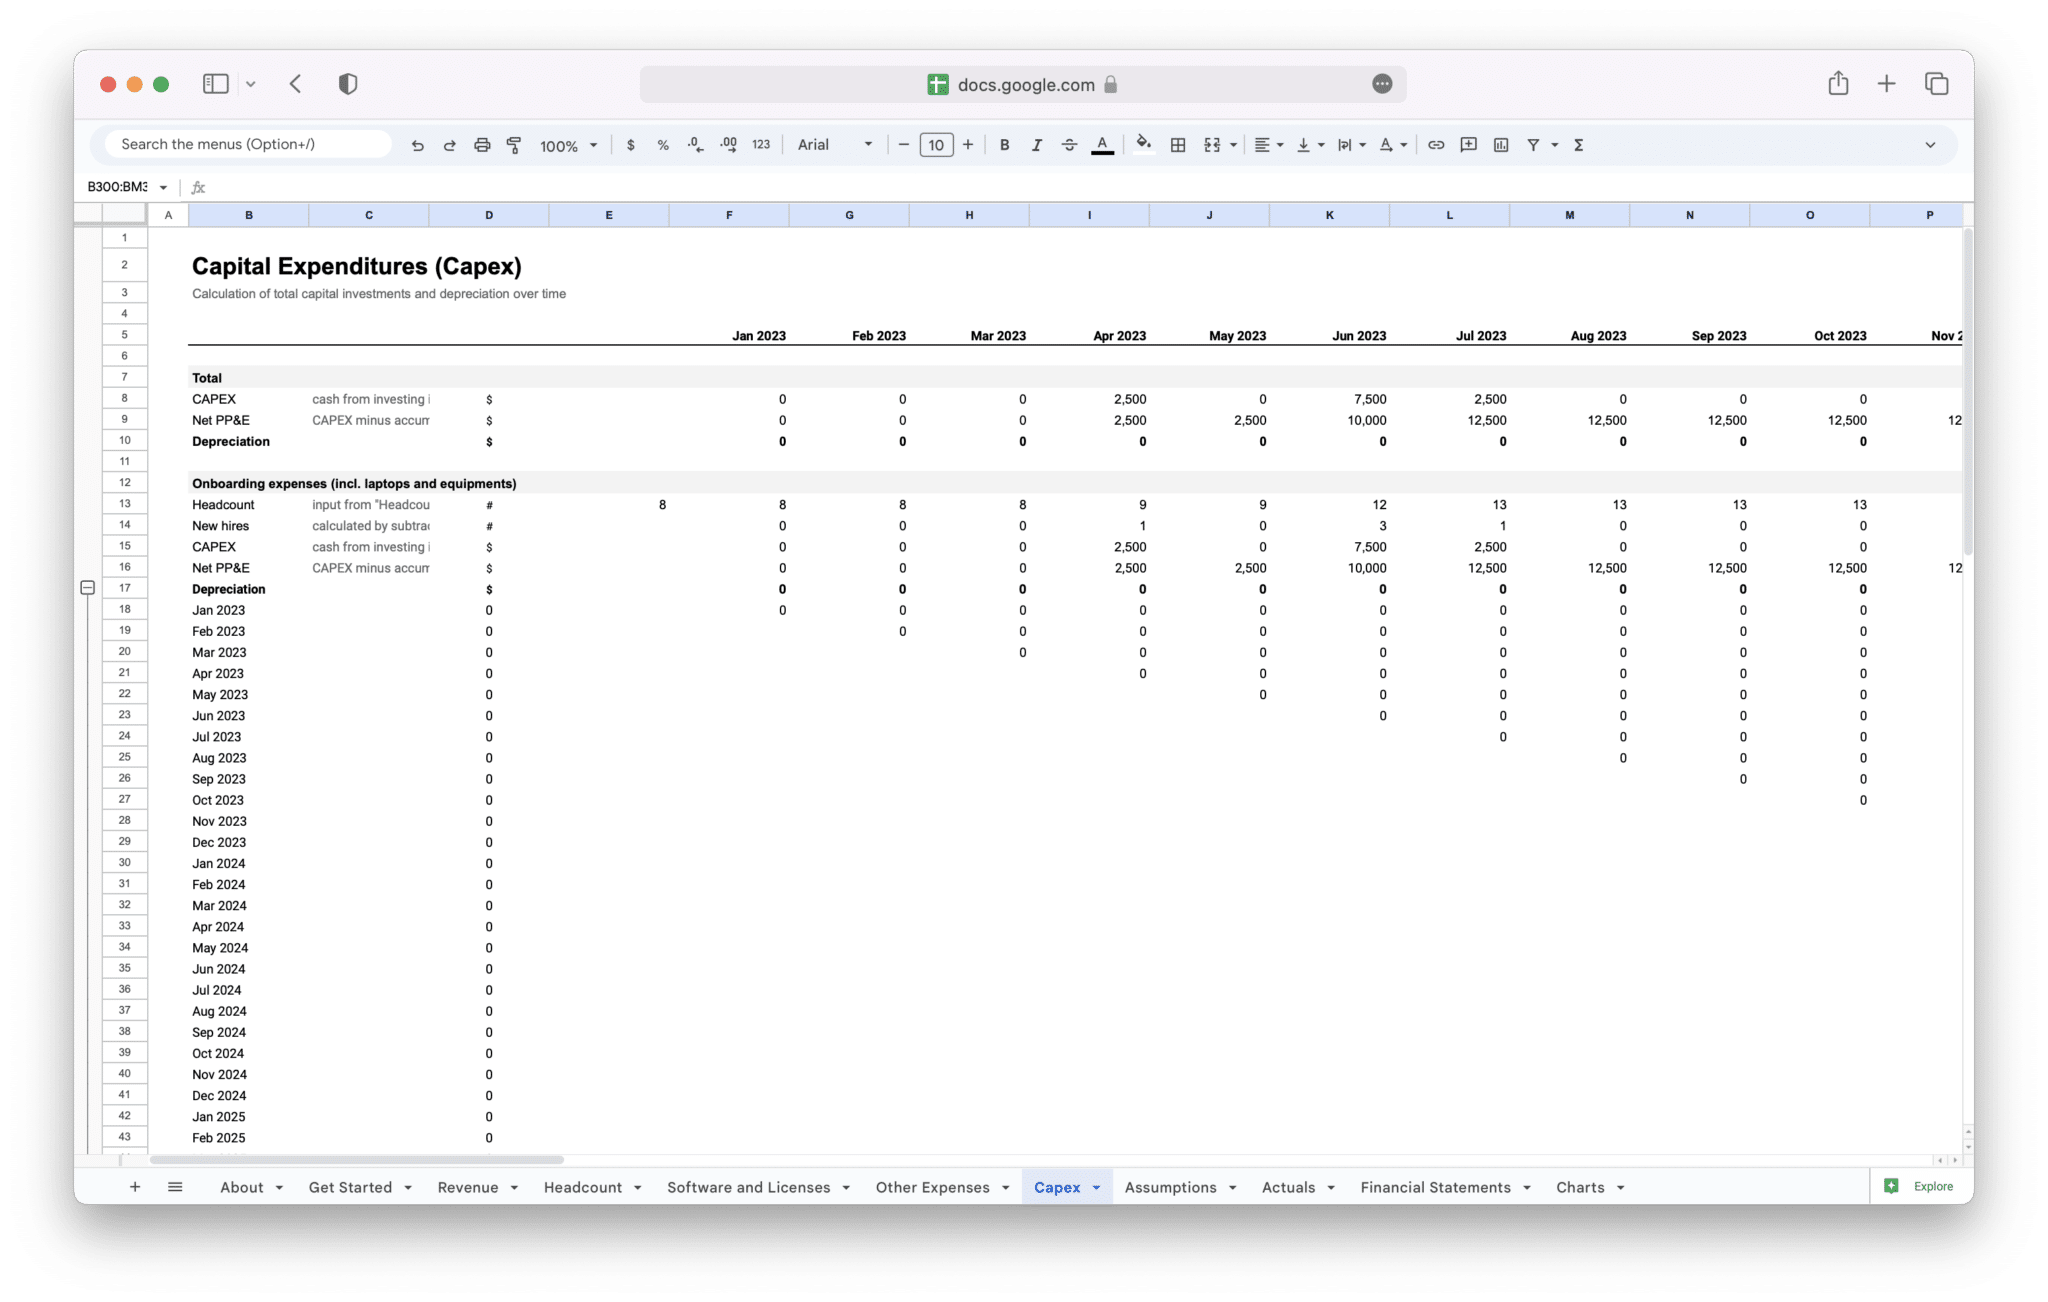
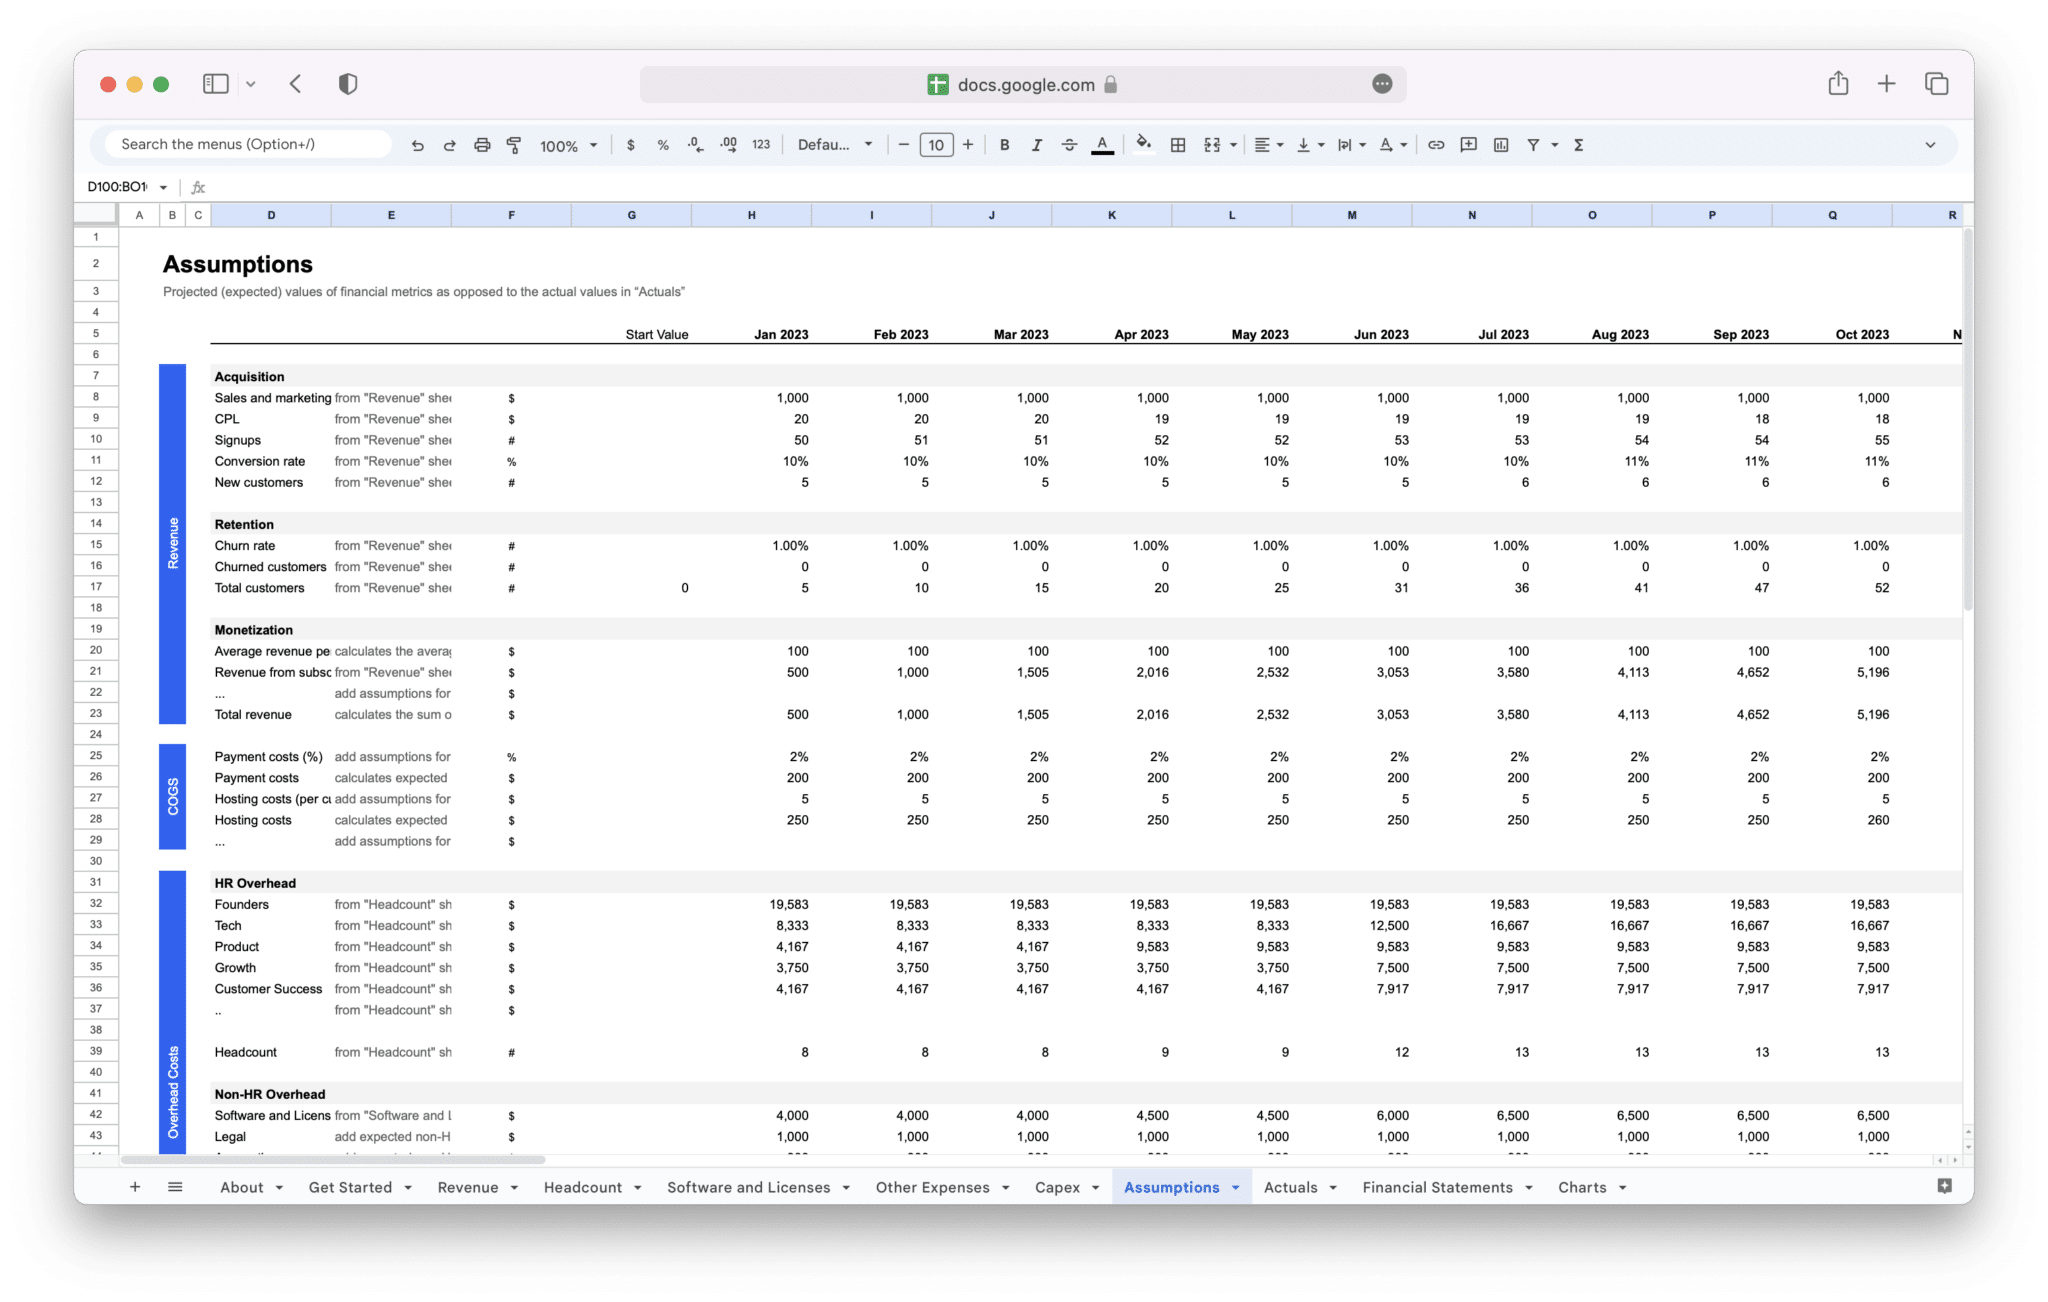
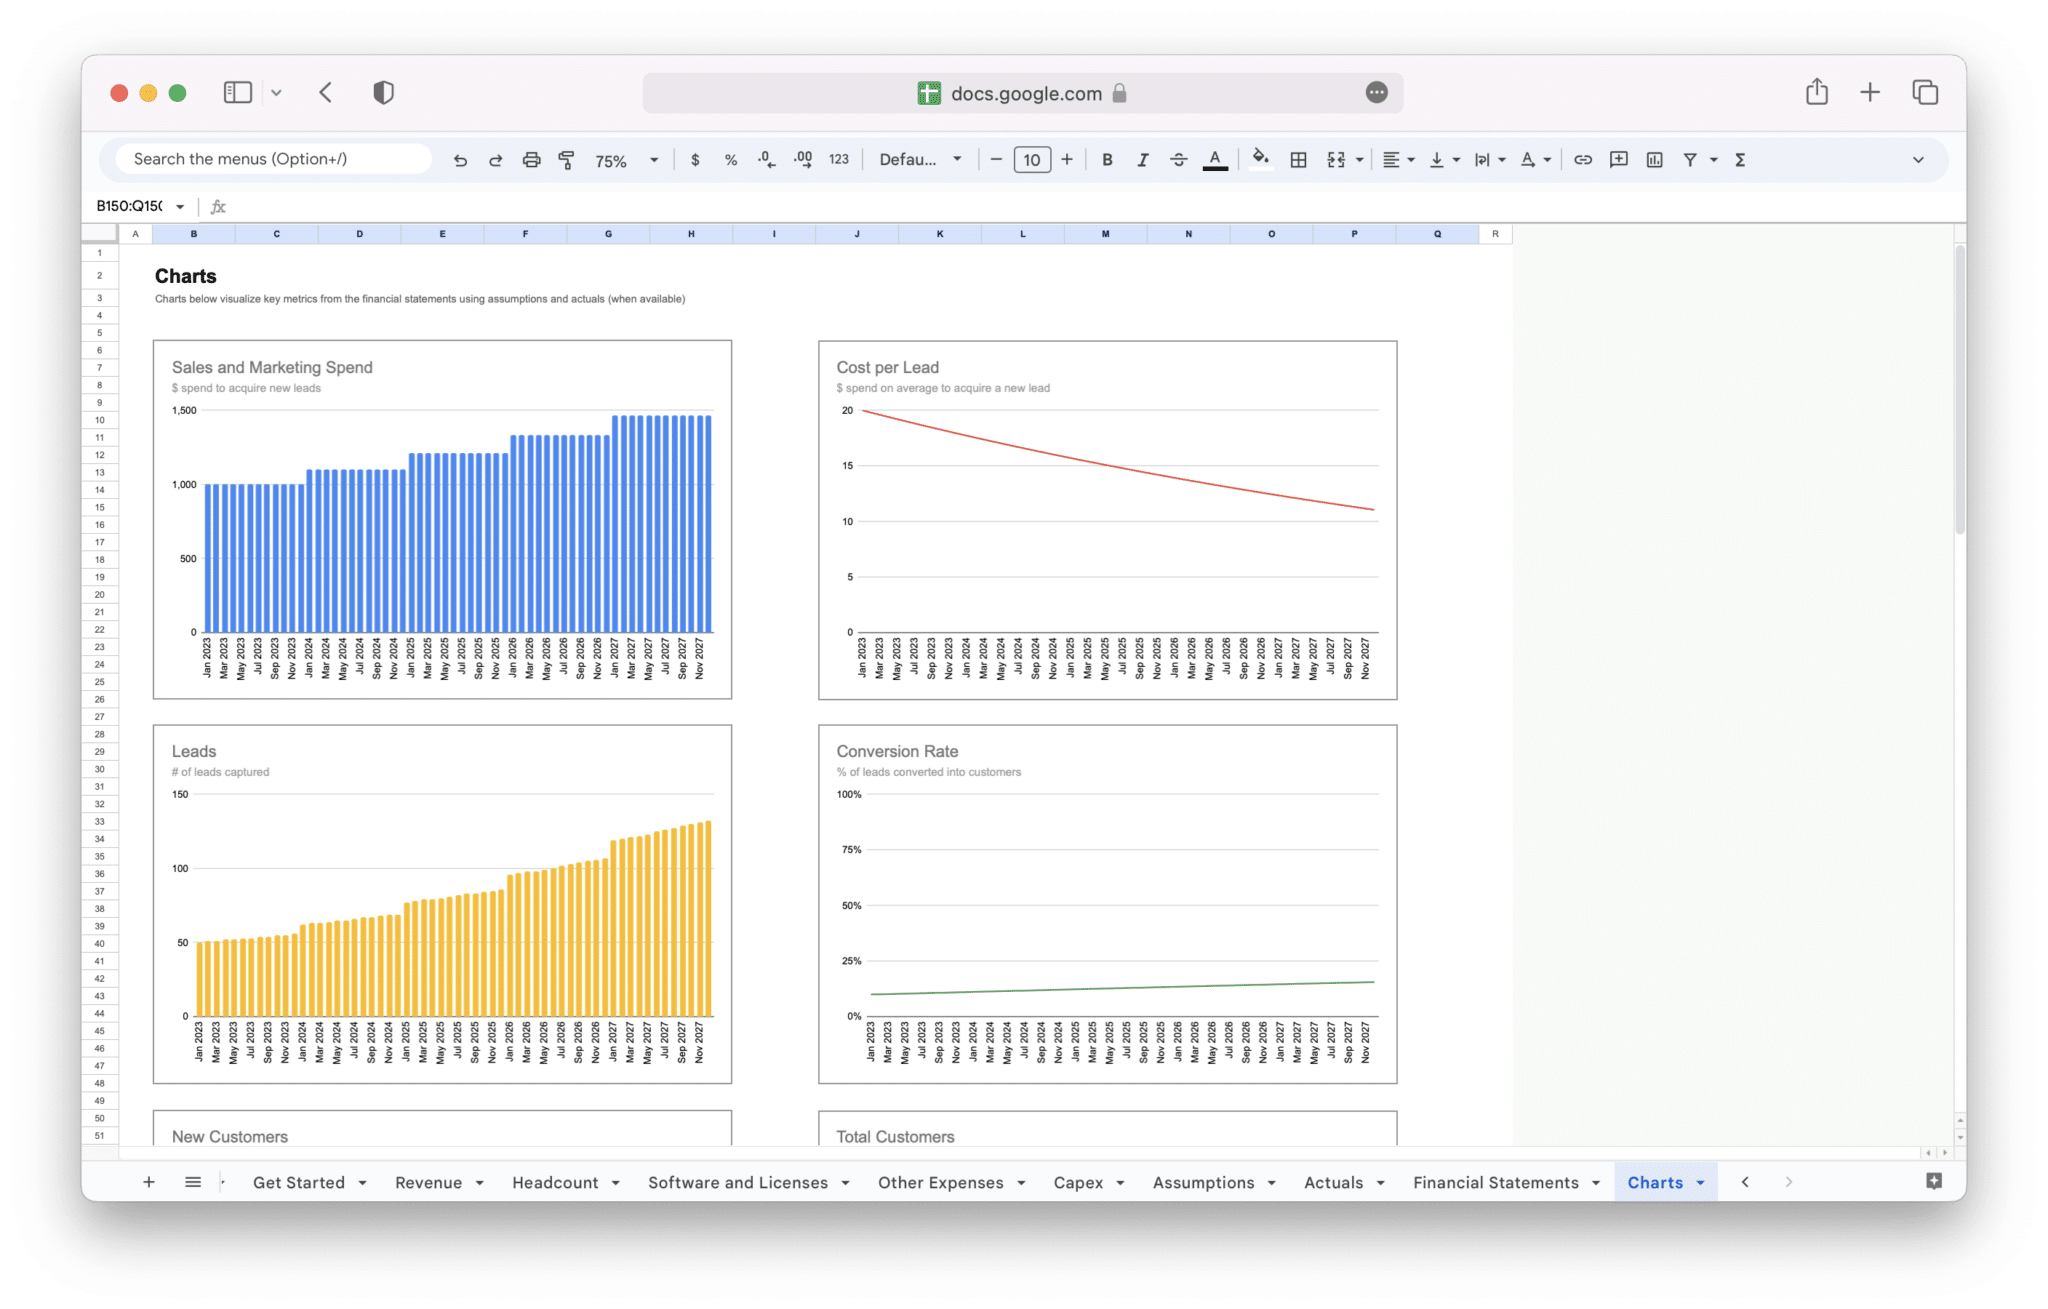
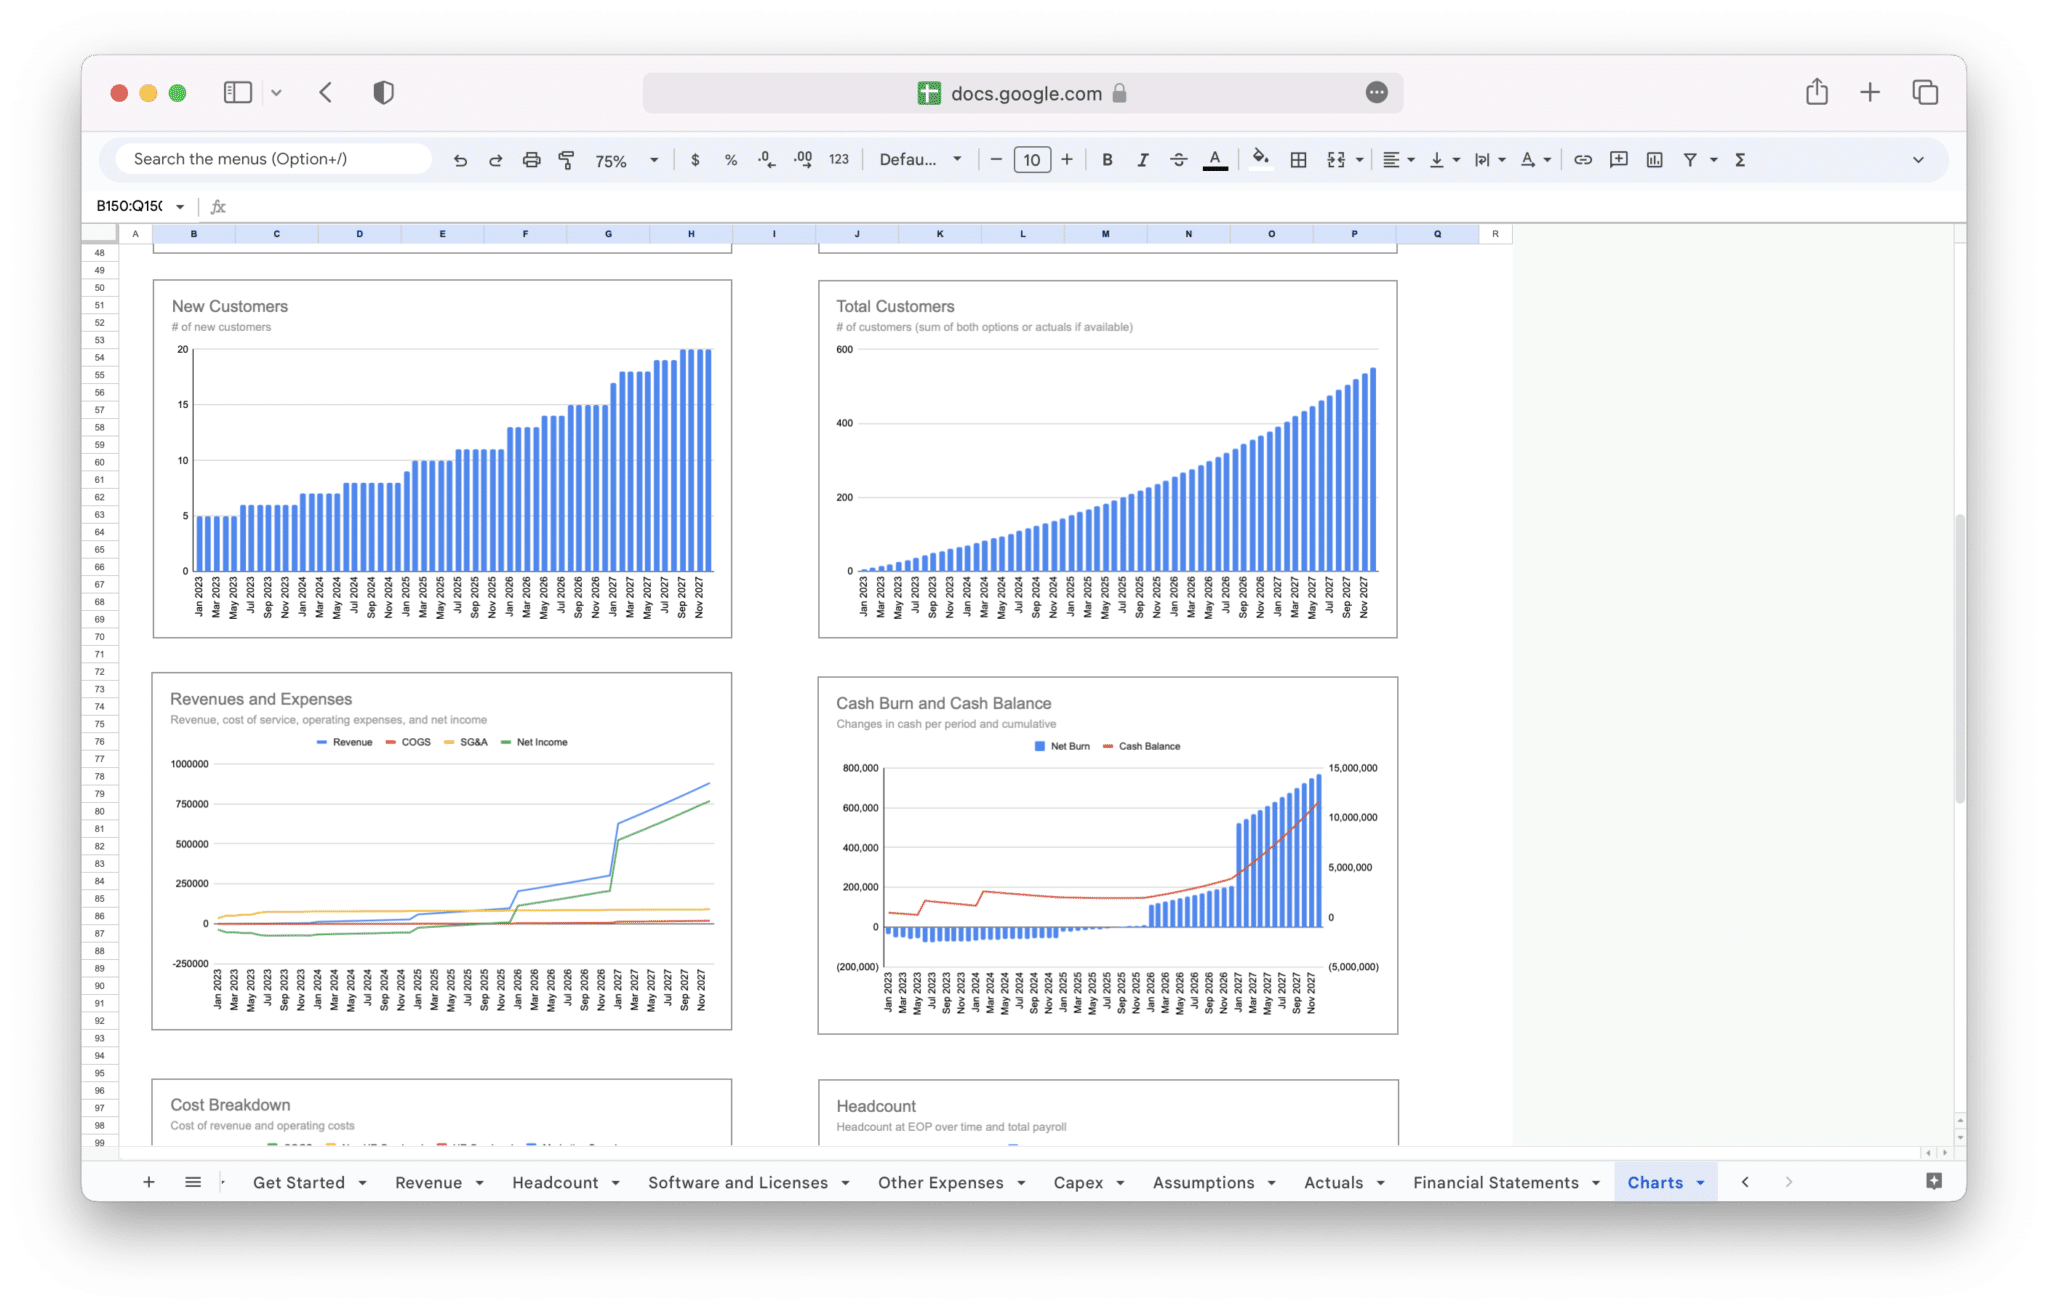
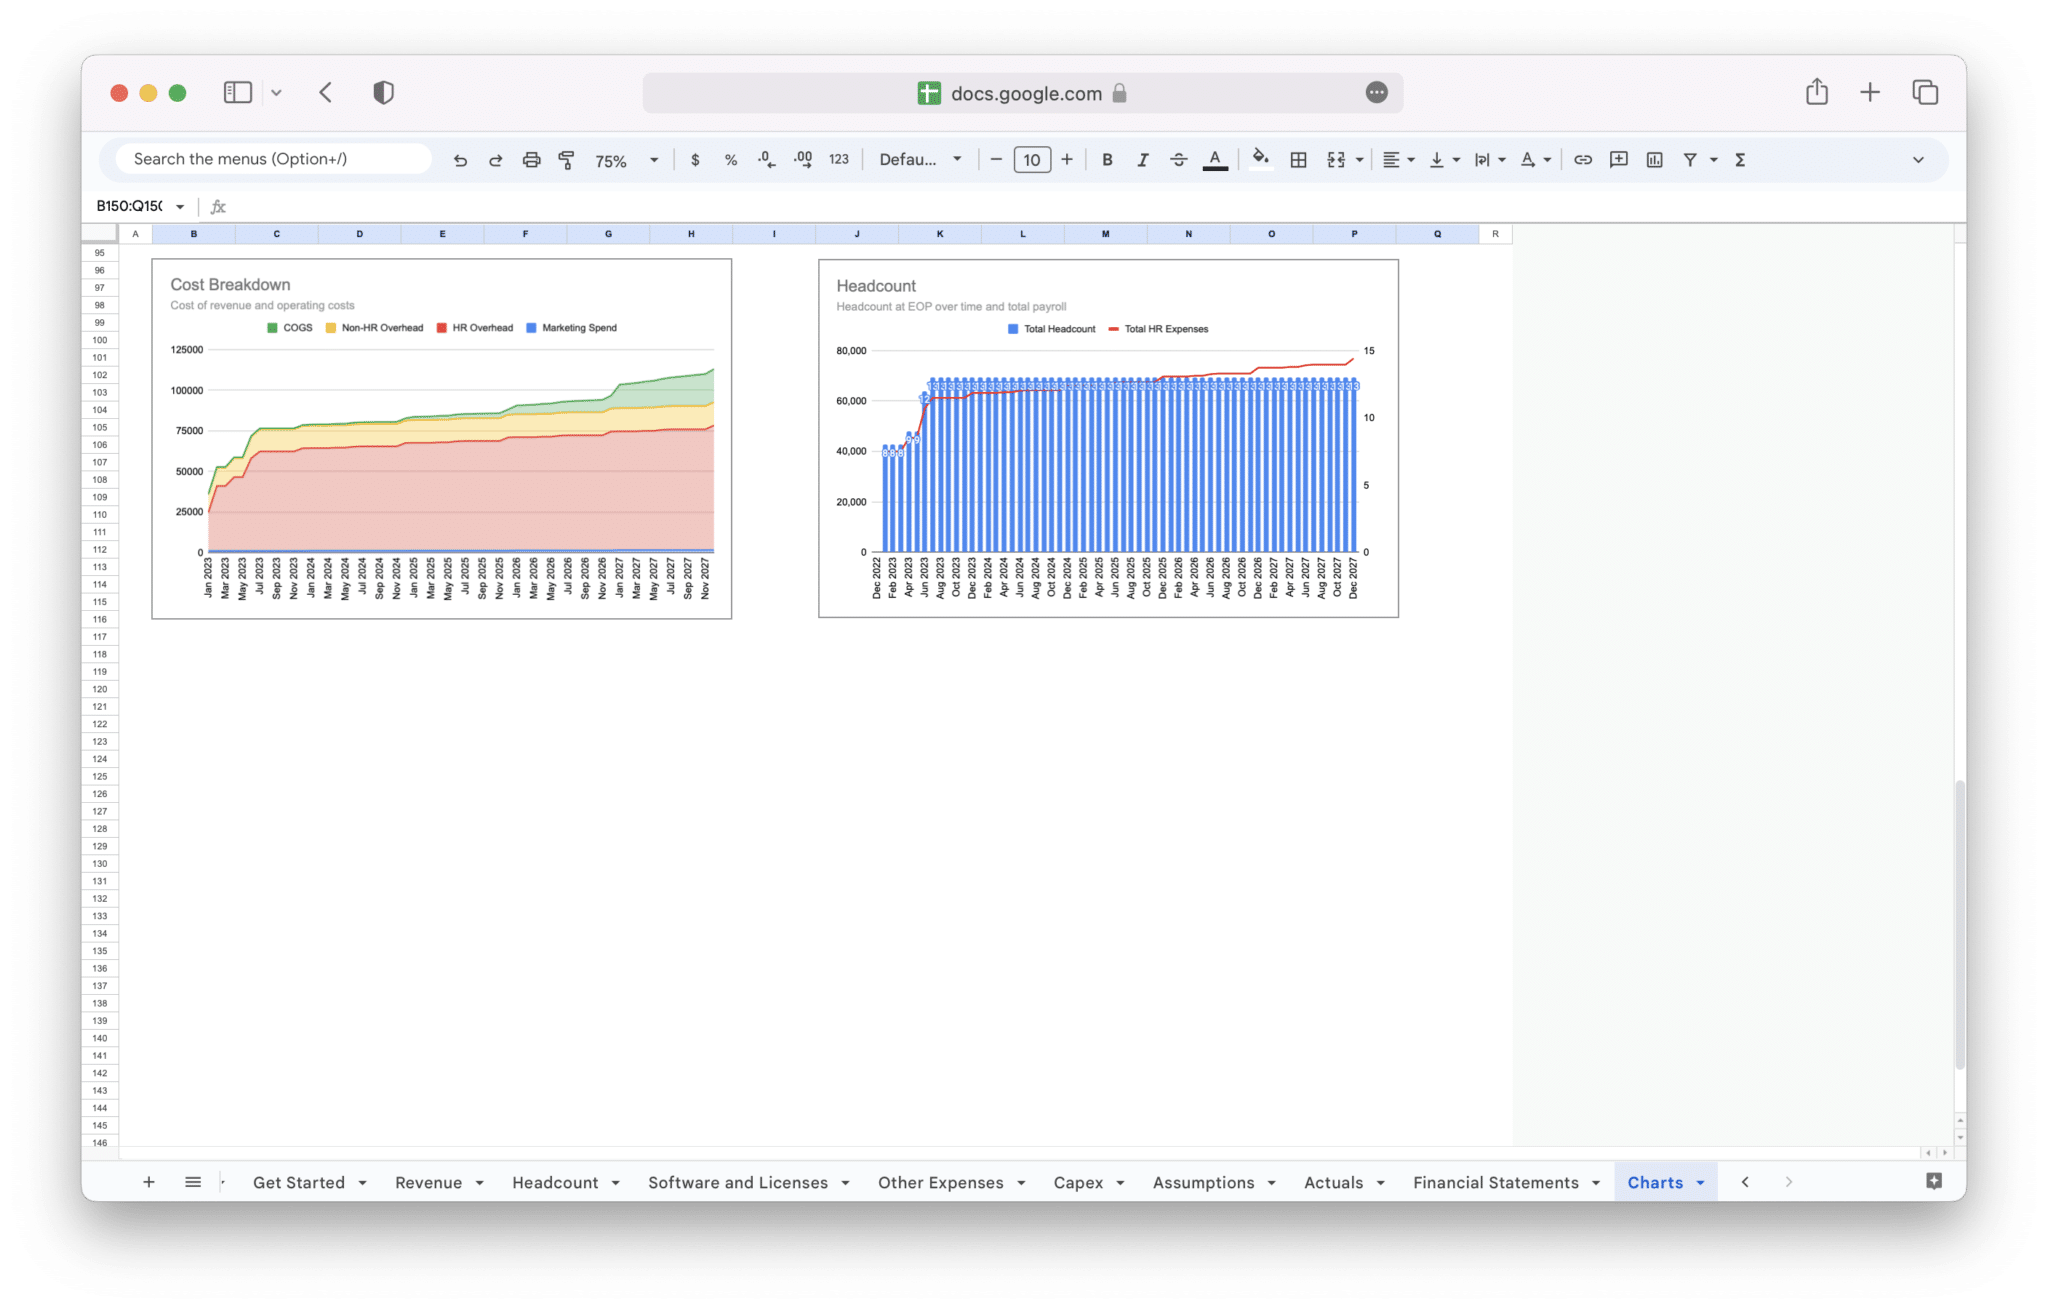
Maximize your SaaS business success with our Financial Model Template. Forecast revenue, track expenses, and make data-driven decisions. Get started now to automate your P&L, balance sheet, cash flow statement, and financial metrics calculation.
Description
Managing the finances of a SaaS business can be complex and time-consuming. Between forecasting revenue, tracking costs, and understanding key metrics like customer acquisition and churn rates, it’s easy to feel overwhelmed. Without a clear financial model, it becomes challenging to make informed decisions, plan for growth, or secure investment. As your business scales, the need for accuracy and efficiency in financial planning becomes even more critical.
This is where the SaaS Financial Model Template comes in. Designed to simplify the process, this template provides a ready-made structure for your financial projections. It helps you track recurring revenue, project future growth, manage costs, and measure key performance metrics. With built-in formulas and assumptions, you can easily adjust the model to fit your specific business needs. Whether you’re a startup or an established SaaS company, this template saves you time and ensures you’re always making data-driven decisions that drive profitability and long-term success.
A SaaS financial model is a crucial tool for any Software-as-a-Service (SaaS) company. It helps map out the financial performance of the business, forecasting revenue, costs, and profit over a specified period. The model relies on key assumptions about customer behavior, pricing, and market conditions to generate projections that guide strategic decisions. For SaaS businesses, financial models aren’t just about understanding current performance but also about predicting future outcomes and creating strategies to achieve long-term goals.
SaaS financial models are distinct in that they must account for recurring revenue streams, customer retention, and the scalability of the business. The model should incorporate assumptions about subscription pricing, customer growth, churn rates, and how these elements affect the company’s bottom line. Additionally, the SaaS model needs to integrate operational costs, like cloud infrastructure and customer support, which scale with growth.
The purpose of a SaaS financial model is to help founders, investors, and executives understand the financial health of the business, identify areas for improvement, and forecast how future decisions will impact profitability and growth. Creating and regularly updating this model is essential for guiding business decisions, setting realistic goals, and securing investments.
What is a SaaS Financial Model?
A SaaS financial model is a projection tool designed to outline the revenue and expenses of a SaaS company over a specific period, usually on a monthly or yearly basis. It incorporates the unique dynamics of SaaS businesses, where the focus is on subscription-based revenue, customer acquisition costs, churn rates, and long-term customer lifetime value (CLTV). A well-built model allows a business to forecast income, plan for growth, and understand the cash flow implications of key decisions.
The SaaS financial model typically includes:
- Revenue Projections: Estimating recurring revenue based on customer subscriptions, upsells, and renewals.
- Cost Projections: Accounting for direct costs (COGS) such as cloud infrastructure, customer support, and indirect expenses like marketing and R&D.
- Cash Flow: Estimating the inflows and outflows of cash, including subscription payments, operating costs, and any capital expenditures.
- Key Metrics: Monitoring essential SaaS-specific metrics such as MRR (Monthly Recurring Revenue), churn rate, CAC (Customer Acquisition Cost), and CLTV (Customer Lifetime Value).
The goal of a SaaS financial model is to provide an accurate picture of financial health and to guide business decisions that align with both short-term needs and long-term strategic goals.
Why Do SaaS Companies Need a Financial Model?
SaaS companies operate with unique revenue models and growth dynamics, which require specific financial strategies. Having a financial model in place allows businesses to plan for the future, manage risk, and make informed decisions that lead to growth. These models help businesses prepare for uncertainties, manage cash flow, and scale efficiently. Here’s why SaaS companies need a financial model:
- Helps in Forecasting Future Growth and Revenue: A financial model provides projections for future revenue and growth, helping SaaS companies plan for upcoming challenges and opportunities.
- Improves Decision-Making: By understanding the financial implications of various decisions, a model helps businesses make more informed choices related to pricing, marketing, hiring, and investment.
- Attracts Investors and Stakeholders: A clear, well-structured financial model demonstrates a business’s potential for growth and profitability, making it easier to attract investors and secure funding.
- Facilitates Performance Monitoring: It allows business owners and executives to track key metrics like churn, customer acquisition cost, and profitability against initial forecasts, helping to spot issues early.
- Provides Insights for Strategic Planning: A financial model gives insight into operational efficiency and resource allocation, allowing SaaS businesses to optimize their operations and minimize unnecessary expenses.
- Supports Cash Flow Management: Since SaaS businesses often rely on subscription-based income, managing cash flow effectively is vital. A model helps anticipate when money will be coming in and when expenses need to be covered, ensuring that the business avoids liquidity issues.
Key Benefits of Having a SaaS Financial Model
A strong SaaS financial model offers numerous advantages, especially as a business scales. These benefits provide clarity and direction, ensuring the company is on the right track financially. Here are some of the key benefits of having a well-structured SaaS financial model:
- Clear Roadmap for Growth: A financial model helps identify the most profitable revenue streams and outlines the path to scaling the business. By forecasting key metrics like MRR, churn, and customer acquisition, businesses can plan and execute growth strategies more effectively.
- Risk Management: By analyzing different financial scenarios, a SaaS financial model allows businesses to prepare for uncertainties like fluctuating demand or increased competition. This foresight helps mitigate risks associated with cash flow shortages or unplanned expenses.
- Attracts Investment: Investors want to see that a SaaS business has a solid financial plan and realistic growth projections. A robust financial model not only demonstrates the potential for profitability but also shows the business’s ability to scale efficiently, making it more attractive to investors and stakeholders.
- Optimizes Operational Efficiency: By assessing the costs associated with customer acquisition, retention, and service delivery, a financial model can help businesses identify areas where they can cut unnecessary expenses, streamline operations, and maximize profitability.
- Guides Pricing and Customer Acquisition Strategies: Having a financial model helps determine the most profitable pricing strategies and customer acquisition channels, ensuring the business invests in the right areas for sustainable growth.
- Enhanced Financial Transparency: A detailed financial model offers clarity about how each dollar is spent and where revenue is generated, which increases transparency for both internal and external stakeholders.
- Improved Cash Flow Management: Subscription-based businesses like SaaS can experience variable cash flow, especially during periods of rapid growth. A financial model helps project future income and expenses, allowing businesses to manage cash flow effectively and avoid liquidity issues.
Overall, a SaaS financial model not only provides a snapshot of the business’s financial health but also guides decision-making and strategic planning. Having one in place is essential for SaaS companies aiming to scale effectively while managing risk and optimizing resources.
A SaaS financial model is made up of several crucial components that allow you to map out the financial health and trajectory of your business. These components are interconnected, providing a full picture of your revenue potential, operational expenses, and profitability. When developing a financial model, it’s important to keep these components in mind to ensure you’re building an accurate and functional model that can serve as a strategic tool for growth.
Revenue Streams and Pricing Models
Revenue is the backbone of any business, and for SaaS companies, understanding your revenue streams and setting up the right pricing model is critical. SaaS businesses often rely on recurring revenue from subscriptions, but there are various ways to structure pricing that will impact your revenue model.
For most SaaS businesses, the primary revenue stream comes from subscriptions, which may be paid monthly or annually. However, this doesn’t mean all SaaS companies are the same. There are different pricing strategies you can implement, depending on your market, customer preferences, and the value your product offers.
- Subscription-Based Pricing: This is the most common model for SaaS companies, where customers pay a recurring fee for continued access to your software. It could be monthly or annually, and some companies offer discounts for annual payments to encourage long-term commitments. The key here is to determine the right price point that reflects the value of your product while being competitive in the market.
- Freemium Model: Many SaaS companies offer a free version of their software with limited features or usage. The goal is to attract a wide audience, and once customers see the value of the product, they can upgrade to a paid version with more advanced features. The freemium model allows businesses to scale quickly, but it also requires careful balance to convert free users into paying customers.
- Tiered Pricing: A tiered pricing model offers multiple pricing plans based on different features, service levels, or usage limits. For example, a basic plan may be for startups with minimal features, while an enterprise plan may include advanced analytics, dedicated support, and integrations. Tiered pricing allows businesses to cater to different customer segments and can be an effective way to maximize revenue from various customer profiles.
- Usage-Based Pricing: Some SaaS products are priced based on the amount of usage or volume consumed, such as the number of users, storage, or transactions. This model is common in businesses that deal with cloud storage, API calls, or transaction processing. Usage-based pricing can offer scalability as businesses pay for only what they use, but it may also make it harder to predict revenue.
- Enterprise Custom Pricing: Large businesses often require a customized pricing model that fits their unique needs. These models might involve high-touch sales processes, long contract negotiations, and personalized feature sets. Although enterprise contracts tend to be more complex, they can be highly lucrative, as they usually involve larger commitments.
In all these models, it’s essential to monitor your Average Revenue Per User (ARPU) and Monthly Recurring Revenue (MRR). These metrics help ensure that your pricing strategy aligns with customer value while remaining sustainable for your business.
Cost Structure and Expense Breakdown
SaaS businesses are characterized by their recurring revenue model, but understanding your cost structure is just as important as tracking your income. A successful financial model must consider the different expenses associated with running a SaaS business.
The key costs involved in SaaS businesses generally fall into a few categories:
- Cost of Goods Sold (COGS): This refers to the direct costs incurred in delivering your product to customers. In SaaS, these costs typically include cloud hosting, infrastructure, and licensing fees. You may also have costs related to customer support or any features that require third-party integrations or APIs.
- Sales and Marketing Expenses: Marketing plays a crucial role in growing a SaaS business. These expenses include paid ads (Google Ads, social media ads), content marketing (blogging, SEO), event sponsorships, and sales team commissions. For SaaS, these costs can be substantial, especially if you’re in the customer acquisition phase.
- Research and Development (R&D): SaaS companies are often in a constant cycle of product iteration. To stay competitive, you must invest in continuous improvement, which includes the costs of product development, user interface improvements, and adding new features. These costs are critical for maintaining customer satisfaction and innovation.
- General and Administrative (G&A): These expenses are the overhead costs involved in managing a business, including office rent, utilities, salaries for non-technical staff (HR, finance, legal), and insurance. These costs should not be underestimated as they can grow quickly as your team expands.
- Customer Support and Success: In the SaaS world, customer retention is just as important as acquisition. To ensure customer satisfaction and reduce churn, you will likely need to invest in a customer success team that offers ongoing support and guidance to users. This team can assist in upselling and ensuring users get the most out of your product.
Tracking these costs accurately is essential to understanding your gross margins and unit economics, as they directly impact your overall profitability. It’s important to find a balance where your revenue growth outpaces your expenses, especially as you scale.
Customer Acquisition and Retention Metrics
Customer acquisition and retention are two sides of the same coin. A robust SaaS financial model must include key metrics that measure how effectively you are attracting new customers and keeping them around long-term.
- Customer Acquisition Cost (CAC): CAC is the cost you incur to acquire a new customer. It includes all sales and marketing expenses divided by the number of customers acquired in that period. A high CAC could indicate inefficient marketing or a high sales cycle, which could hurt profitability. Ideally, your CAC should be lower than your Customer Lifetime Value (CLTV), meaning the revenue generated from a customer should exceed what it costs to acquire them.
- Customer Lifetime Value (CLTV): CLTV is the total amount of revenue a customer is expected to generate for your business during their lifetime as a paying customer. This metric is particularly important in SaaS because it helps you understand the long-term value of your customer base. If your CLTV is significantly higher than CAC, it indicates a healthy business model.
- Churn Rate: Churn rate is the percentage of customers who stop paying for your service over a given period. This metric is crucial for SaaS businesses because a high churn rate can signal dissatisfaction with the product or service, and it directly affects revenue stability. Reducing churn through customer success efforts is a priority for most SaaS companies.
- Net Revenue Retention (NRR): NRR is a metric that shows how much revenue you’ve retained from existing customers over a given period, including upsells, renewals, and churn. A higher NRR means that your business is effectively increasing revenue from existing customers, which is more cost-effective than acquiring new customers.
By focusing on these metrics, you can improve your understanding of the lifetime value of your customers and how much you need to spend to acquire and retain them.
Profit and Loss Statement (P&L)
The Profit and Loss Statement (P&L) provides an overview of your company’s revenue and expenses over a specific period, typically monthly or annually. This financial statement is one of the most important tools for tracking your business’s profitability and overall financial health.
A P&L statement will typically include:
- Revenue: This includes all income generated from customers during the period, such as subscription fees, one-time payments, and any other sources of revenue.
- Cost of Goods Sold (COGS): These are the direct costs associated with delivering the product or service. In SaaS, this usually includes hosting fees, software licenses, and customer support.
- Operating Expenses: This includes marketing, sales, R&D, and general administrative costs. These are the ongoing expenses necessary to operate the business.
- Net Profit: After subtracting operating expenses from gross profit, you get the net profit. A positive net profit indicates a healthy business, while a negative figure indicates potential issues.
The P&L statement is a key document for internal decision-making, helping you evaluate profitability, cost-effectiveness, and growth potential. It is also crucial for attracting investors who want to see a clear path to profitability.
Cash Flow Management
Cash flow management is a critical part of running a SaaS business, especially as your company grows and the need for capital becomes more urgent. For SaaS businesses, predicting cash flow can be tricky due to the often unpredictable nature of customer acquisition cycles, payment terms, and billing schedules.
Key aspects of cash flow management include:
- Forecasting Revenue and Expenses: By accurately forecasting how much cash will flow into the business from customer payments and how much will flow out in expenses, you can ensure that you have enough liquidity to cover your operating costs.
- Accounts Receivable and Payable: SaaS businesses typically deal with subscription-based payments, and it’s essential to track when payments are due and when you must pay your suppliers or contractors. Delays in payments from customers can lead to cash flow problems.
- Buffer for Fluctuations: Cash flow can vary, particularly if your customer base is growing quickly or if you rely on large enterprise contracts. You must plan for potential fluctuations in revenue by keeping an adequate cash reserve or securing financing options if necessary.
- Capital Requirements: As your business grows, you may need to raise capital to fund expansion. Understanding your cash flow needs will help you determine how much capital you need and when to seek investment.
Good cash flow management helps prevent financial strain, ensuring that you can pay your employees, vendors, and other obligations on time, which is essential for business longevity.
When building or refining your SaaS financial model, understanding and tracking key metrics is essential. These metrics provide valuable insights into the financial health of your business, your growth potential, and the efficiency of your operations. By measuring and optimizing these key performance indicators (KPIs), you can make better decisions that drive profitability, scalability, and customer satisfaction.
Monthly Recurring Revenue (MRR)
Monthly Recurring Revenue (MRR) is one of the most critical metrics for any SaaS business. MRR represents the predictable and recurring revenue generated each month from your customers’ subscriptions. It offers a reliable forecast of future revenue, which is essential for strategic planning, budgeting, and securing investments.
MRR provides a snapshot of your revenue health, and tracking it regularly is key to understanding how your business is performing. For SaaS companies, MRR is often considered the lifeblood of the business because it is directly tied to customer retention and growth. The more consistent and predictable your MRR, the more stable your business becomes.
To calculate MRR, you simply multiply the number of paying customers by the amount they pay per month. However, there are different ways to track MRR depending on your pricing model. For instance, if you have multiple pricing tiers or seasonal fluctuations, you may need to break down your MRR into different categories, such as new MRR, expansion MRR, and churned MRR. Each of these categories will give you deeper insights into how your revenue is evolving.
- New MRR refers to the additional revenue generated from new customers that month.
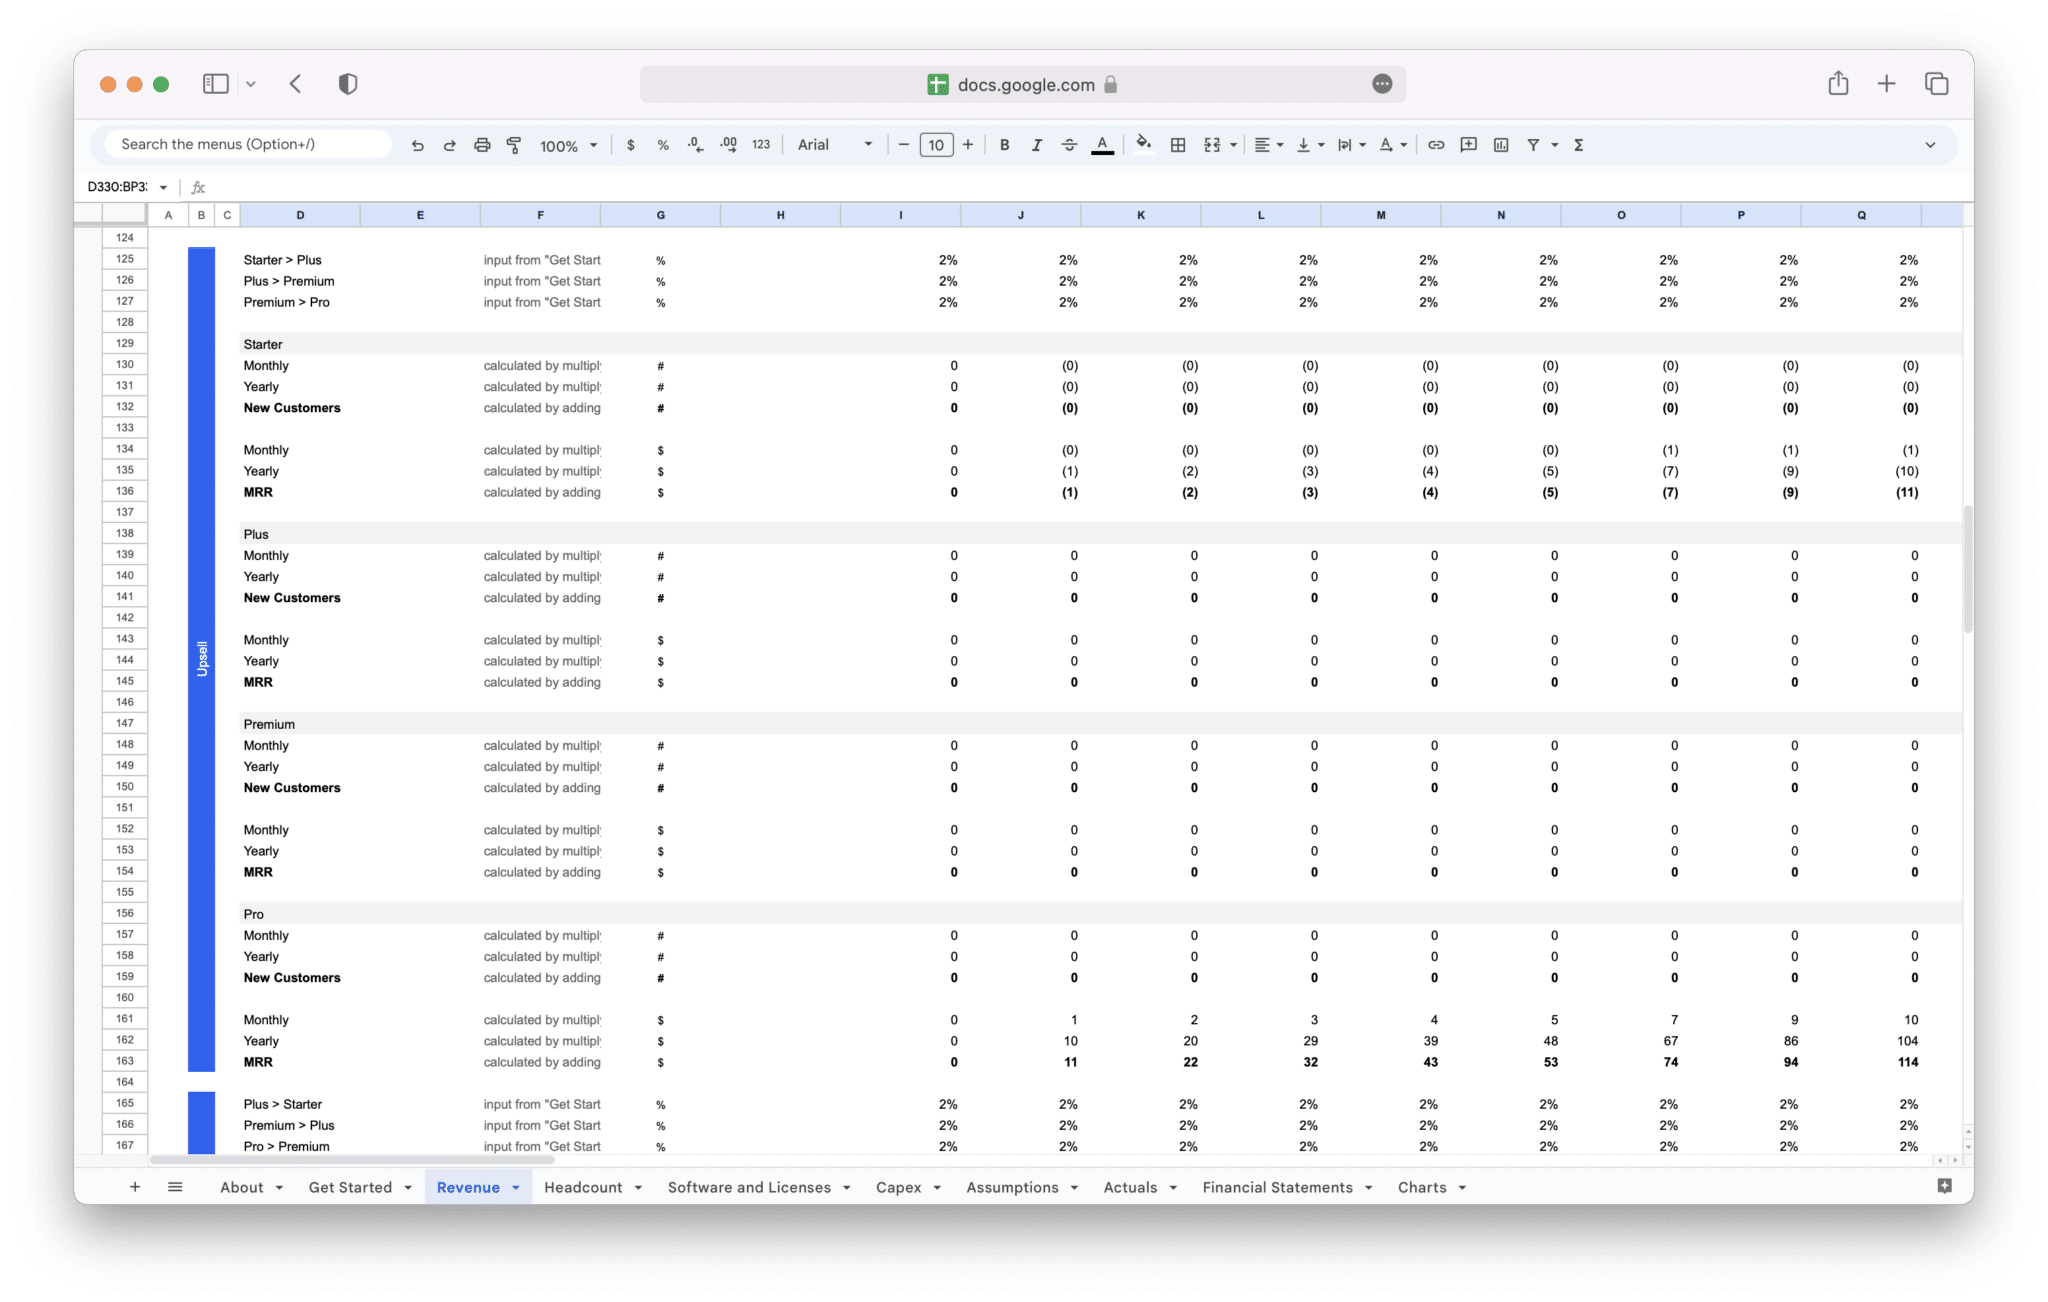
- Expansion MRR accounts for revenue growth from existing customers, such as upsells, cross-sells, or plan upgrades.
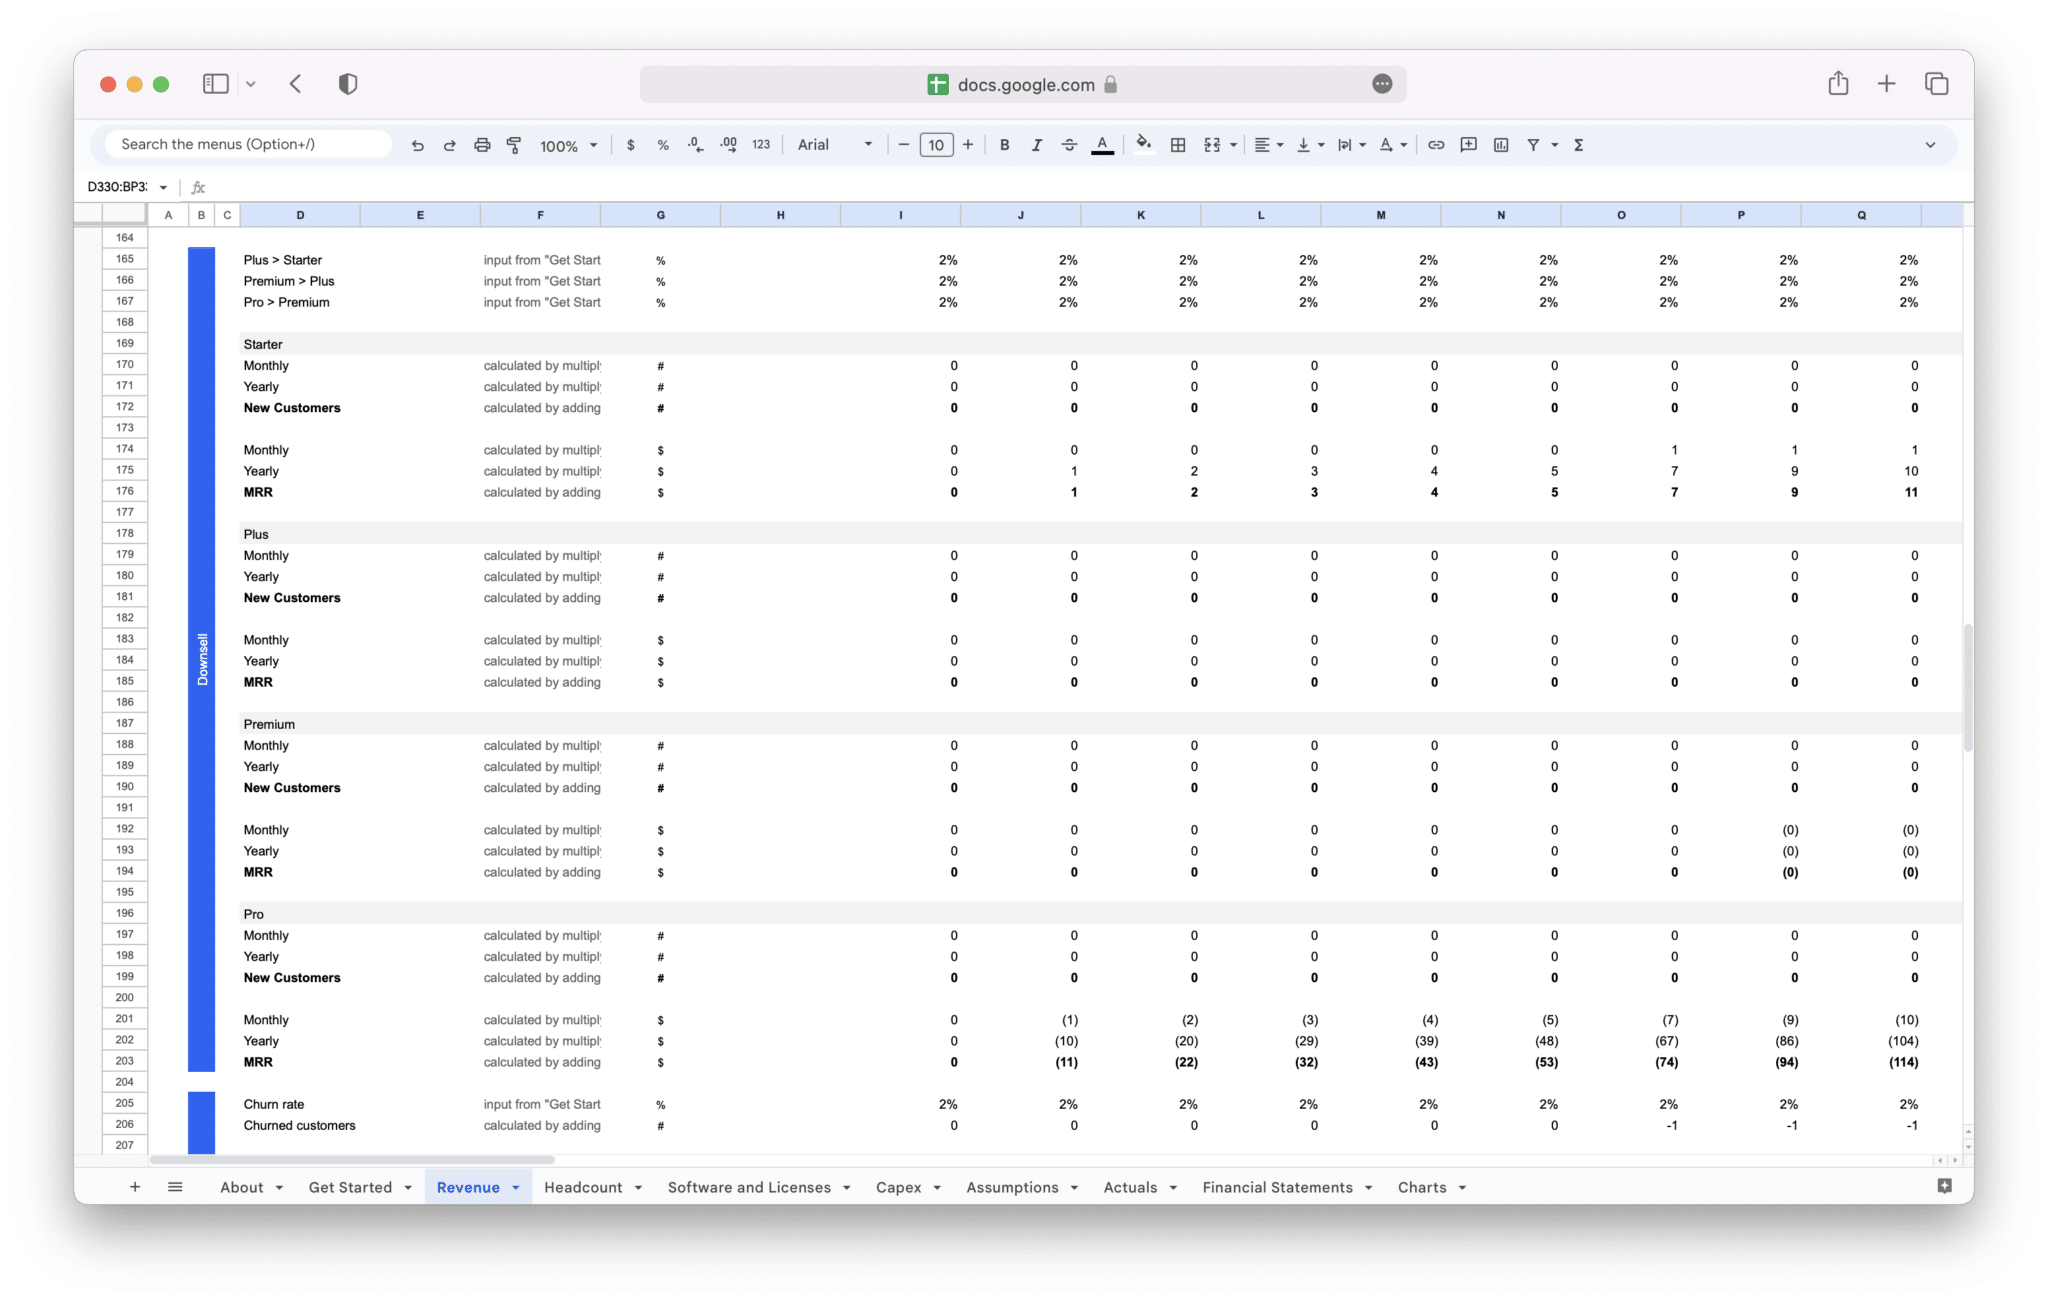
- Churned MRR is the revenue lost due to customer churn or downgrades.
Tracking these components can help you identify opportunities to increase customer retention or find new avenues for expansion, which are critical for driving growth.
Customer Lifetime Value (CLTV)
Customer Lifetime Value (CLTV) is a key metric for understanding how much revenue you can expect from a customer over the entire time they remain subscribed to your service. Unlike MRR, which measures monthly revenue, CLTV reflects the long-term profitability of your customers. This metric helps you determine how much you should be willing to spend on customer acquisition while maintaining healthy margins.
To calculate CLTV, you need to multiply the average revenue per customer (ARPU) by the average customer lifespan. For example, if a customer pays $200/month and stays with you for an average of 24 months, their CLTV would be $4,800.
A high CLTV relative to your Customer Acquisition Cost (CAC) indicates that you’re acquiring customers who are highly valuable in the long term. If your CLTV is lower than your CAC, it signals that your business is spending too much on acquiring customers without generating enough revenue from them over their lifetime.
CLTV can be broken down by customer segment to identify which types of customers bring the most value. This insight helps you focus your marketing efforts on the most profitable customer segments, ensuring that you’re allocating resources efficiently.
Churn Rate
Churn Rate measures the percentage of customers who cancel or do not renew their subscriptions within a given period, usually monthly or annually. Churn is one of the most important metrics in a SaaS financial model because it directly impacts revenue and growth. A high churn rate can be a red flag that indicates dissatisfaction with the product, poor customer support, or an inability to meet customer needs.
Churn rate is calculated by dividing the number of customers lost during a specific period by the total number of customers at the beginning of that period. For example, if you start the month with 1,000 customers and lose 50, your churn rate would be 5%.
It’s important to monitor churn regularly and understand its causes. Reducing churn can be more cost-effective than acquiring new customers, as retaining existing customers generally involves lower marketing and sales expenses. High churn can also affect your MRR growth, making it harder to scale your business effectively.
In addition to tracking the overall churn rate, it’s important to segment your customers by factors like plan type, usage patterns, or length of subscription. This segmentation can help you identify patterns or trends that could inform product improvements or customer success initiatives aimed at reducing churn.
Customer Acquisition Cost (CAC)
Customer Acquisition Cost (CAC) is a measure of how much it costs to acquire a new customer. It includes all the marketing and sales expenses associated with gaining new customers, such as advertising spend, content creation, sales team salaries, and commissions. CAC is crucial for understanding the efficiency of your sales and marketing efforts.
To calculate CAC, you divide the total sales and marketing expenses for a given period by the number of customers acquired during that same period. For example, if you spend $50,000 on marketing and sales and acquire 500 new customers, your CAC would be $100.
CAC should always be compared to CLTV to ensure that your customer acquisition efforts are sustainable. If your CAC is higher than your CLTV, you may need to re-evaluate your sales and marketing strategy. Ideally, your CLTV should be at least three times your CAC to ensure a healthy return on your marketing and sales investments.
Tracking CAC over time can help you identify trends and measure the effectiveness of specific campaigns, channels, or tactics. For example, if you notice that a particular advertising channel has a lower CAC compared to others, it might be worth investing more in that channel.
Average Revenue Per User (ARPU)
Average Revenue Per User (ARPU) is a metric that helps you understand the revenue generated on average from each of your customers. ARPU is particularly useful for tracking the effectiveness of your pricing strategy and understanding the financial contribution of each customer.
To calculate ARPU, divide your total revenue by the number of customers you have. For example, if your SaaS business generates $50,000 in revenue from 1,000 customers, your ARPU would be $50.
ARPU is a valuable metric for businesses that have multiple pricing tiers, as it helps you track how much revenue each customer segment is contributing. It also allows you to compare performance across different customer groups, such as those who subscribe to your most expensive plan versus those on a basic or freemium plan.
Changes in ARPU over time can indicate shifts in customer behavior, such as increased upselling, product adoption, or churn. For example, if you’re seeing an increase in ARPU, it could suggest that customers are purchasing higher-tier plans, upgrading their subscriptions, or adding more users to their accounts. If ARPU is declining, it may signal that customers are downgrading, canceling, or not fully utilizing your product.
Gross Margin and Contribution Margin
Gross Margin and Contribution Margin are two financial metrics that provide insight into the profitability of your SaaS business, especially as it scales. Both metrics are essential for understanding how efficiently you’re delivering your service and how much profit you’re generating from each sale.
- Gross Margin is the difference between your revenue and the cost of goods sold (COGS). In SaaS, COGS typically includes cloud hosting fees, payment processing fees, customer support costs, and software licenses. Gross margin is expressed as a percentage of revenue and indicates how much profit you’re making after direct costs.A high gross margin is one of the benefits of running a SaaS business because the nature of the model allows for low variable costs. Once your product is built, the cost of delivering it to new customers is relatively low. High gross margins (typically above 70%) allow you to reinvest in growth, marketing, and R&D, which is crucial for scaling.
To calculate gross margin, subtract COGS from total revenue, then divide by total revenue and multiply by 100. For example, if your revenue is $500,000 and COGS is $100,000, your gross margin would be 80%.
- Contribution Margin is the amount of revenue remaining after deducting variable costs, and it represents the profitability of individual products or services. Unlike gross margin, contribution margin accounts for both fixed and variable costs, such as marketing and sales expenses. This metric is especially useful when determining how much each additional sale contributes to covering your fixed costs and generating profit.Contribution margin is calculated by subtracting all variable costs from total revenue, then dividing by total revenue. If your contribution margin is high, it means that each customer contributes significantly toward covering your fixed costs and generating profits. A low contribution margin indicates that your variable costs are too high or that you’re not effectively pricing your product.
Together, these margins give you a clear picture of your SaaS business’s ability to scale profitably. If your gross margin is high but your contribution margin is low, it may signal that your fixed costs (like sales and marketing) are too high, and you need to optimize them to improve profitability.
Creating a SaaS financial model can seem like a daunting task, but breaking it down into manageable steps will make it much more achievable. A solid financial model provides clarity and direction for your business, helping you forecast growth, track key metrics, and make data-driven decisions. This step-by-step guide will walk you through the key stages of building a comprehensive SaaS financial model.
Data Collection and Assumptions
The first step in creating your financial model is to gather all the relevant data you’ll need to make accurate projections. Data collection serves as the foundation of your model and ensures that your assumptions are grounded in reality. Without accurate data, your financial model will be based on guesswork, which could lead to poor decisions.
Start by reviewing historical financial data if your business is already operational. This includes revenue, expenses, churn rates, customer acquisition costs, and any other relevant data from the past months or years. The more data you have, the better your projections will be. If you’re a new business without historical data, use industry benchmarks and your best estimates to fill in the gaps.
As you gather your data, it’s important to make key assumptions about your business’s future performance. These assumptions might include:
- Customer Growth Rate: How fast do you expect to acquire new customers each month or year? This can be based on historical growth patterns or your go-to-market strategy.
- Churn Rate: What percentage of your customers do you expect to lose each month? You can use industry averages or your past churn rates if applicable.
- Customer Acquisition Cost (CAC): How much are you spending to acquire each new customer? This includes marketing, sales, and advertising costs.
- Average Revenue Per User (ARPU): What is the average amount of revenue you generate per customer?
Make sure these assumptions are realistic. Overly optimistic projections can lead to inflated forecasts that might not hold up in the long run. It’s better to start conservatively and adjust as you gather more data and insights.
Building the Revenue Model
Now that you’ve gathered data and made your assumptions, it’s time to build your revenue model. Your revenue model will outline how much money your SaaS business will generate over a specified period, and it will be a central piece of your financial model.
Start by deciding how you want to structure your revenue. For most SaaS businesses, revenue comes from subscription fees, but depending on your pricing model, you may also generate income from additional streams, such as:
- One-time setup fees
- Professional services or consulting
- Upselling existing customers to higher-tier plans
- Affiliate programs or partnerships
The goal is to break down your revenue into predictable, recurring components (such as MRR) while accounting for any non-recurring income streams (like one-time setup fees).
Next, incorporate your pricing model. If you have multiple pricing tiers, create revenue projections for each tier based on the number of customers in each group and the average price paid per user. For example, if you have three pricing tiers — Basic, Premium, and Enterprise — calculate the total revenue for each group by multiplying the number of customers in each tier by the price for that tier.
When building your revenue model, it’s essential to include various revenue drivers, such as:
- Customer Acquisition Rate: How many new customers do you plan to acquire each month or quarter?
- Customer Expansion: Do you expect existing customers to upgrade to higher pricing tiers?
- Seasonality or Market Trends: Will there be any seasonal fluctuations in demand for your product?
The revenue model should be flexible enough to accommodate changes, whether those come from new product offerings, shifts in customer behavior, or other market factors.
Forecasting Growth and Scaling Costs
Once you’ve outlined your revenue model, the next step is to forecast growth and scaling costs. This stage is critical for understanding how your business will grow over time and what resources you’ll need to support that growth. Accurate growth forecasts will help you plan for the future and ensure that you’re not caught off guard by unexpected expenses.
Begin by estimating how quickly you expect your business to grow. This will be influenced by factors like market demand, your marketing efforts, and product development. For example, if you’re launching a new product or expanding into a new market, your growth rate might be higher in the first few months or years, but it will likely slow down as the market matures.
As your SaaS business grows, you’ll need to consider how your costs will scale. Costs don’t always grow in a linear fashion — some expenses will increase as your customer base expands, while others might remain relatively fixed. Some of the most important cost categories to track as you scale include:
- Cloud Hosting and Infrastructure: As your customer base grows, so will the demand for server capacity and storage. These costs are generally variable, depending on usage.
- Customer Support: If you’re acquiring more customers, you’ll likely need to expand your customer support team to handle inquiries and troubleshoot issues.
- Sales and Marketing: Your customer acquisition costs (CAC) will scale as you invest more in marketing and sales to attract new customers. However, as your business grows, you may also see economies of scale, where the cost of acquiring customers decreases as you refine your marketing channels and techniques.
- Product Development: To keep your software competitive and meet customer needs, you’ll need to continually invest in product development. This includes building new features, maintaining the platform, and improving security.
Accurately forecasting these scaling costs will allow you to assess whether your business model is sustainable in the long term. It’s also important to track the relationship between your growth rate and scaling costs to ensure that you’re growing profitably. If costs are growing faster than revenue, it may signal inefficiencies that need to be addressed.
Creating Profit & Loss (P&L) Projections
Creating Profit and Loss (P&L) projections is a vital part of building your SaaS financial model. The P&L statement will help you track your revenue and expenses over a specific period, ultimately showing whether your business is profitable. P&L projections give you an overview of your expected income and outgoings, so you can assess whether your business model is financially viable.
To create P&L projections, you need to consider the following components:
- Revenue: Based on your revenue model, this section includes projected monthly or annual income from subscriptions, one-time fees, and other income sources.
- Cost of Goods Sold (COGS): This includes direct costs like cloud hosting, customer support, and any costs related to delivering your product. For SaaS businesses, COGS are often relatively low compared to traditional businesses because software is a digital product.
- Operating Expenses: These are your fixed and variable expenses related to running the business, such as salaries, marketing costs, and office expenses.
- Net Profit: After subtracting COGS and operating expenses from revenue, your net profit is what remains. A positive net profit indicates that your business is financially healthy, while a negative net profit could signal issues that need to be addressed.
You can also include gross profit and EBITDA (Earnings Before Interest, Taxes, Depreciation, and Amortization), which give a clearer picture of your operating performance by excluding non-operating expenses like taxes and interest.
Accurate P&L projections are essential for budgeting, forecasting cash flow, and assessing the overall financial health of your business. These projections should be updated regularly based on actual performance to ensure that your financial model stays current and aligned with reality.
Cash Flow Management and Capital Requirements
Effective cash flow management is crucial for any business, but it’s especially important for SaaS companies due to the recurring nature of revenue and the potential for fluctuating cash inflows and outflows. Cash flow projections help you ensure that you have enough liquidity to cover your expenses, even when there’s a gap between when you earn revenue and when you incur costs.
The first step in managing cash flow is to create projections that account for your cash inflows (e.g., customer payments, loans, or investments) and cash outflows (e.g., operating expenses, salaries, and product development costs). While SaaS businesses typically have predictable revenue streams from subscriptions, other expenses may vary, so it’s important to monitor cash flow regularly.
Consider these factors when forecasting cash flow:
- Subscription Billing Cycles: Many SaaS businesses bill customers annually or quarterly, meaning your revenue might come in large chunks at once. However, your expenses will likely be more evenly distributed, so it’s important to plan for these timing discrepancies.
- Payment Terms: If you offer longer payment terms to your customers (e.g., net-30 or net-60), this could delay cash inflows, so make sure to factor that into your cash flow projections.
- Capital Expenditures: As your business grows, you may need to invest in new equipment, software, or office space. These one-time capital expenditures can impact your cash flow in the short term, even if they provide long-term benefits.
Finally, assess your capital requirements. If you’re forecasting that you’ll need more working capital to support growth, you may need to raise funds through debt or equity. Knowing how much capital you’ll need, and when you’ll need it, is vital for ensuring that your business can continue to grow without running into financial difficulties.
By managing your cash flow and understanding your capital requirements, you’ll be in a stronger position to scale your SaaS business while maintaining financial stability.
A SaaS financial model template is a pre-built structure designed to help you map out the financial aspects of your Software-as-a-Service business. These templates save you time, reduce the complexity of creating a model from scratch, and ensure that you’re capturing all the essential elements needed for accurate financial planning. Using a template allows you to focus on the unique aspects of your business while relying on a proven framework that has been refined over time. Whether you’re a startup or an established SaaS company, the right financial model template is an invaluable tool for managing your finances and making data-driven decisions.
Benefits of Using a Template
Using a SaaS financial model template offers several distinct advantages, especially if you’re new to financial modeling or want to streamline your financial planning process. A well-constructed template can provide a clear structure and ensure you’re considering all the critical metrics and components necessary for success.
- Time-Saving: The most obvious benefit of using a template is the amount of time you save. Instead of creating a model from scratch, you’re able to leverage a framework that already includes essential categories like revenue forecasts, cost projections, and key metrics. This allows you to quickly input your own data, rather than spending time on complex calculations and structuring.
- Accuracy: Financial modeling can be tricky, especially when it comes to predicting customer growth, churn rates, and profitability. Templates typically come with built-in formulas and calculations, reducing the risk of human error. The templates are also designed based on industry standards, so you know you’re using a model that aligns with best practices.
- Comprehensive Structure: SaaS financial model templates typically cover all the key elements of a SaaS business’s financials. They include sections for Revenue (like MRR, ARPU, etc.), Expenses (like hosting, R&D, marketing), and Profit & Loss (P&L) projections. By using a template, you can be confident that you’re covering all your bases and thinking through all the necessary variables.
- Benchmarking and Comparison: Templates often come with industry benchmarks, which can help you compare your business’s financial performance with others in your sector. These benchmarks are based on data from SaaS companies of similar size and stage, helping you assess whether your assumptions are realistic or if you need to adjust your projections.
- Easier Communication with Investors: When you’re presenting your financial model to potential investors, having a clean, professional template can go a long way. Investors are more likely to trust a financial model that adheres to recognized standards, and they will appreciate the clarity that comes from using a template.
How to Use the SaaS Financial Model Template?
Once you’ve selected a SaaS financial model template, using it effectively requires a systematic approach. It’s not just about plugging in numbers; it’s about understanding how the template works and tailoring it to fit your specific business needs.
- Familiarize Yourself with the Template: Before you begin entering data, take the time to understand the template’s structure. Look at all the sections and categories included in the model, including revenue streams, expenses, key metrics, and forecasts. Understanding what each part of the template represents will help you use it more effectively.
- Input Your Historical Data: If your business is already up and running, the first step is to enter your historical data. This could include past revenue, customer acquisition costs, churn rates, and any other financial data that will provide context for your projections. By inputting historical data, you establish a baseline that will inform your future forecasts.
- Adjust Assumptions Based on Your Business: Most templates come with default assumptions, such as average customer acquisition cost (CAC), churn rate, and growth rate. These assumptions are based on industry averages and may not reflect the unique characteristics of your business. It’s essential to review and adjust these assumptions according to your company’s specific situation. For example, if you’re in a high-growth phase, your assumptions for customer growth might be more aggressive than those in the template.
- Update Revenue Projections: The revenue section is usually the most complex in a SaaS financial model. You’ll need to input your pricing model, expected customer growth, and forecasted churn rates. If your model includes multiple pricing tiers, ensure that the projections reflect your customer segmentation. For example, if you expect a higher percentage of customers to upgrade to a premium plan in the next quarter, adjust your revenue forecast accordingly.
- Review Costs and Expenses: Input your operational expenses, including marketing costs, R&D, salaries, and infrastructure expenses. Many templates allow you to adjust these costs depending on your business stage. For example, if you’re still in the early stages of your SaaS business, your marketing costs may be high as you push for customer acquisition. As your business matures, your marketing spend might stabilize, and your focus might shift toward reducing churn.
- Run Scenario Analysis: A good SaaS financial model template allows you to run multiple scenarios based on different assumptions. This feature is crucial for understanding how different factors, like a change in churn rate or CAC, can affect your business’s profitability. Adjusting key inputs (e.g., growth rate, customer acquisition costs) and running different scenarios will help you visualize potential outcomes and make better decisions.
- Analyze Key Metrics: Once you’ve entered your data, review key SaaS metrics like MRR, CLTV, CAC, and Churn Rate. A good template will generate these automatically based on the inputs you provide. By focusing on these metrics, you can assess the overall health of your business and identify areas for improvement. For example, if your CAC is too high compared to CLTV, it might be time to optimize your customer acquisition strategy.
- Monitor and Adjust Regularly: A financial model is not a one-time project. It’s essential to revisit your model regularly to make adjustments based on actual performance. As your business evolves, you’ll gain more accurate data to refine your assumptions and improve your projections. Regularly updating your model ensures that it stays aligned with the reality of your business.
How to Customize a Template for Your Business?
While a SaaS financial model template provides a solid foundation, customization is essential to make it truly reflect your business’s unique characteristics and circumstances. Customizing a template ensures that the model captures the specific nuances of your business and gives you more accurate projections.
- Adjust Assumptions to Match Your Business’s Reality: The default assumptions in a template might be a good starting point, but they won’t necessarily reflect your business’s current situation. Whether it’s customer acquisition cost, churn rate, or growth expectations, you should tailor these assumptions to match your business strategy. If your churn rate is lower than the industry average because of exceptional customer success practices, update the template to reflect this.
- Add New Revenue Streams or Pricing Tiers: If your SaaS business offers additional services or products beyond the core subscription, such as one-time setup fees or consulting, customize the revenue section of the model to reflect these income sources. You may also want to add different pricing tiers or packages if your business uses a tiered pricing model. Adjusting for these nuances will make your financial model more accurate and reflective of your actual revenue generation strategies.
- Reflect Seasonal Fluctuations or Market Changes: Many SaaS businesses experience seasonality — for example, higher demand during certain months or quarters. Customize the template to reflect these fluctuations in customer acquisition or product usage. Additionally, consider market trends or external factors (like new competitors or economic shifts) that might impact your business’s financial performance.
- Incorporate Custom Key Metrics: While templates typically focus on standard metrics like MRR and CAC, your business may have unique metrics that you want to track. For example, if your SaaS business is focused on enterprise clients, you might want to track the Average Contract Value (ACV) or Enterprise Renewal Rates. Customizing the template to include these specialized metrics will help you track the most relevant indicators for your specific business.
- Set Up for Regular Updates: As your SaaS business evolves, your financial model should evolve with it. Customize the template to make it easy for you to update projections as you gather more data. This can include adding rows for each month, quarter, or year, and ensuring that calculations for MRR, churn, and other key metrics automatically update as you input new data. Automating these updates can save time and make your model more dynamic.
- Tailor the Model to Different Stakeholders: If you’re using the financial model to communicate with investors, you might need to customize it further to emphasize aspects like valuation, ROI, or investment needs. On the other hand, if the model is for internal use, you might prioritize operational metrics like customer acquisition costs, lifetime value, and churn rate.
Customizing a SaaS financial model template ensures that it reflects your unique business situation and helps you make the most accurate financial decisions. Whether you’re building a model from scratch or modifying a template, the key is to adjust the assumptions, metrics, and structure to align with your goals and reality. The more tailored your financial model is to your business, the more powerful it will be in helping you plan for the future and make data-driven decisions.
A SaaS financial model isn’t just a tool for forecasting; it’s a powerful resource for decision-making. By using this model effectively, you can allocate resources wisely, identify areas for profitability, and make strategic moves that support sustainable growth. A well-constructed model serves as a roadmap for the future, helping you navigate the complexities of scaling, managing cash flow, and attracting investors.
Budget Allocation and Planning
Budget allocation and planning are at the heart of managing your SaaS business’s financial health. Your financial model provides a clear view of your projected revenue, expenses, and cash flow, which helps you prioritize and allocate funds where they are needed most.
When creating a budget based on your financial model, the goal is to balance growth with efficiency. For SaaS businesses, this often means finding the right mix between sales and marketing spend, product development investment, and maintaining operational stability. To allocate your budget effectively, consider the following:
- Revenue Projections: Start by understanding your expected revenue for the coming periods. This will help you set realistic targets for spending and ensure that you don’t overextend your financial resources. Look at your Monthly Recurring Revenue (MRR) and expected customer growth to guide these projections.
- Fixed vs. Variable Costs: Divide your expenses into fixed and variable categories. Fixed costs are stable expenses like salaries, rent, and software subscriptions, while variable costs may fluctuate based on customer growth, product usage, or marketing campaigns. Your financial model helps you predict both, which is essential for managing cash flow.
- Growth vs. Sustainability: SaaS businesses often face the dilemma of wanting to scale rapidly while ensuring long-term sustainability. Budget allocation should reflect this balance. For example, in the early stages of growth, you might allocate a larger portion of your budget to sales and marketing to drive customer acquisition. However, as you scale, the focus should shift towards customer retention, product development, and optimizing operational efficiency.
By planning your budget with the insights from your financial model, you ensure that every dollar spent is contributing to the long-term success of the business. Regularly revisiting and adjusting your budget as actual performance deviates from projections will keep your company on track and help you make informed decisions on where to invest for maximum impact.
Identifying Profitability Opportunities
One of the most valuable uses of a SaaS financial model is identifying profitability opportunities. Since SaaS businesses often operate with relatively high margins, optimizing profitability is key to achieving long-term success. The financial model allows you to dig into the numbers and identify specific areas where you can improve your bottom line.
To uncover profitability opportunities, focus on the following:
- Revenue Growth: Review your revenue streams and identify areas where you can increase sales or monetize new customer segments. Look for opportunities to upsell or cross-sell to existing customers, as this often carries higher margins than acquiring new customers. Additionally, expanding your product offerings or entering new markets can increase overall revenue.
- Reducing Churn: Churn is one of the biggest challenges SaaS businesses face, and reducing it can directly improve profitability. If your financial model shows high churn rates, investigate why customers are leaving. Are they dissatisfied with the product? Are there gaps in your customer support? Addressing these issues will help retain customers and increase their lifetime value, thus improving overall profitability.
- Optimizing Customer Acquisition Costs (CAC): Another key area to examine is your customer acquisition cost. If your CAC is high relative to customer lifetime value (CLTV), your business may be spending too much on marketing or sales to acquire new customers. Your financial model will reveal if this imbalance exists, allowing you to refine your acquisition strategies to make them more cost-effective.
- Operational Efficiency: Review your operational costs to identify inefficiencies. For example, are you spending too much on cloud hosting or data storage as you scale? Could automation in customer service or sales operations reduce costs and improve margins? By optimizing these areas, you can increase profitability without sacrificing growth potential.
By consistently reviewing your financial model and identifying areas for profitability improvement, you ensure that every decision you make moves the needle toward maximizing your SaaS business’s profit.
Evaluating New Investment or Funding Opportunities
SaaS companies often need to secure external funding to scale, develop new products, or enter new markets. Your financial model is the key to evaluating investment or funding opportunities because it provides potential investors or lenders with a clear view of your business’s current financial health and future growth potential.
When evaluating investment opportunities, your financial model can help you assess:
- Valuation and Funding Needs: A well-constructed financial model can help you determine how much capital you need to meet your growth targets. By projecting revenue, expenses, and cash flow, you can determine how much funding is necessary to sustain your growth. Additionally, the model helps establish your company’s valuation, making it easier to negotiate with investors or lenders.
- Break-Even Analysis: Investors want to understand when your SaaS business will become profitable. The financial model allows you to conduct a break-even analysis, which tells you at what point your revenues will exceed your costs. This is a crucial piece of information for potential investors, as it provides insight into when they can expect a return on their investment.
- Return on Investment (ROI): If you are looking for funding to invest in a new project, marketing campaign, or product development, your financial model helps you estimate the expected return on investment. It’s important to use the model to project how much additional revenue the investment will generate and compare it to the costs. This will help you make data-driven decisions on whether or not to proceed with the investment.
- Investor Confidence: A detailed financial model helps build investor confidence by demonstrating that you’ve carefully thought through your financial projections and understand your business’s financial health. Investors are more likely to back businesses that provide a comprehensive, realistic view of their financial future.
By evaluating funding opportunities through the lens of your financial model, you can make more informed decisions about how much capital to raise, how to use that capital, and whether the opportunity aligns with your long-term business strategy.
Scenario Analysis and Sensitivity Testing
Scenario analysis and sensitivity testing are crucial techniques for understanding how different variables will impact your financial projections. These tools help you account for uncertainty and prepare for various business conditions, such as changes in market trends, customer behavior, or unforeseen expenses. Using your SaaS financial model to conduct these analyses provides greater flexibility in decision-making and helps you make more robust business plans.
Scenario analysis involves creating different scenarios to see how they affect your financial outcomes. For example, you might create:
- Best-case scenarios, where customer acquisition grows faster than expected and churn is lower than projected.
- Worst-case scenarios, where market conditions become more challenging, leading to higher churn and slower growth.
- Base-case scenarios, based on your current assumptions and projections.
By comparing these scenarios, you can understand the range of possible outcomes and develop strategies for managing risks. This approach helps you make more informed decisions about hiring, product development, and other strategic initiatives.
Sensitivity testing goes a step further by examining how sensitive your financial projections are to changes in specific assumptions. For example, you can test how changes in your churn rate or CAC will impact profitability. If small changes in these variables lead to significant differences in your bottom line, it indicates that these factors are critical to the business’s success. Sensitivity testing helps identify which variables have the most significant impact on your financial performance, allowing you to focus your efforts on managing those factors effectively.
For example, if your sensitivity test reveals that a 5% increase in churn could reduce your profitability by 30%, you know that reducing churn is a high priority. On the other hand, if the same test shows that small variations in CAC have little effect on overall profitability, it suggests that CAC is less critical and may not require as much attention.
Both scenario analysis and sensitivity testing help you anticipate potential challenges and better understand how your business model behaves under different conditions. These analyses allow you to prepare for both optimistic and pessimistic market conditions, so you’re always ready to adjust your strategy and stay on course.
By using scenario analysis and sensitivity testing, you can build a more resilient business model that can withstand fluctuations in market conditions and ensure your company stays on track to achieve long-term success.
Building a SaaS financial model presents several challenges that require careful consideration and attention to detail. These challenges stem from the unique characteristics of the SaaS business model, such as recurring revenue streams, variable customer behavior, and the complexity of scaling. Addressing these challenges early in the modeling process will help ensure that the model is both accurate and adaptable.
-
Accurately Predicting Customer Behavior: In a SaaS model, customer acquisition, retention, and churn rates are crucial factors that directly affect revenue projections. Predicting these behaviors can be difficult due to market fluctuations, changes in customer needs, and the impact of product updates or competition. Assumptions around churn rate and customer lifetime value (CLTV) must be based on accurate data and realistic forecasts, but these numbers can be highly variable, especially in the early stages.
-
Scaling Costs and Resources: As SaaS businesses grow, the cost structure can change significantly. Scaling often involves increasing customer support resources, expanding infrastructure (e.g., servers and cloud services), and investing more in marketing and sales to acquire new customers. Predicting how costs will scale with revenue and ensuring the model reflects this growth trajectory is a common challenge.
-
Managing Seasonality and Market Changes: Many SaaS businesses experience fluctuations in demand, especially if they serve industries that are sensitive to seasonality. Incorporating these seasonal variations into a financial model requires a deep understanding of the market and the customer base. Additionally, external factors, such as economic shifts, regulatory changes, or competitive movements, can alter revenue expectations and introduce uncertainty into projections.
-
Forecasting Long-Term Growth with Limited Data: For early-stage SaaS businesses, predicting long-term growth can be especially challenging due to limited historical data. It can be difficult to create reliable projections when you don’t have years of performance data to base your assumptions on. Entrepreneurs must lean on industry benchmarks, realistic growth expectations, and customer feedback to make informed guesses.
-
Balancing Growth and Profitability: SaaS businesses often face the delicate balance of growing quickly while maintaining profitability. High customer acquisition costs (CAC) and heavy investment in sales and marketing can initially lead to negative cash flow, which can be difficult to manage. A key challenge is building a financial model that accounts for both short-term losses and long-term growth.
Once you have a basic understanding of how to build and manage your SaaS financial model, there are several advanced techniques you can employ to refine your model, improve accuracy, and gain deeper insights into your business’s financial performance. These advanced tips will help take your financial modeling to the next level, making it a more powerful tool for strategic planning and decision-making.
- Incorporating Predictive Analytics: Instead of relying solely on historical data or fixed assumptions, consider using predictive analytics to forecast key metrics like customer lifetime value (CLTV), churn, and revenue. Predictive models can leverage machine learning algorithms and customer behavior patterns to provide more accurate predictions, especially for businesses with a growing customer base.
- Segmenting Your Customer Base for Better Insights: SaaS businesses often serve a wide range of customers with different needs, behaviors, and spending patterns. Segmenting your customer base into different groups (e.g., by industry, company size, or usage patterns) can provide more granular insights into revenue potential, churn risk, and pricing strategies. Tailoring your financial model to account for these customer segments can improve the accuracy of your projections.
- Running Multiple Scenarios Simultaneously: Rather than relying on just one set of assumptions, consider creating multiple versions of your financial model based on different scenarios. For example, you could have a best-case scenario, a worst-case scenario, and a base-case scenario. This approach will help you anticipate different outcomes and better prepare for potential challenges or opportunities in the future.
- Integrating SaaS Metrics with Financial Projections: A sophisticated SaaS financial model should integrate key SaaS metrics (such as MRR, CAC, CLTV, churn, and net revenue retention) with your financial projections. This integration provides a more holistic view of the business’s performance and allows you to make better-informed decisions about pricing, customer acquisition, and retention strategies.
- Building Flexibility into Your Model: As your SaaS business grows, your model will need to evolve. Building flexibility into your financial model is crucial so that it can easily adapt to new pricing strategies, changes in customer behavior, or shifts in market conditions. A flexible model allows you to quickly update assumptions and forecast different scenarios without having to rebuild the entire model from scratch.
- Tracking Cohort Performance Over Time: Cohort analysis is a powerful technique that groups customers based on shared characteristics, such as the month they signed up or the plan they chose. By tracking the performance of these cohorts over time, you can identify trends in customer behavior, such as how long they stay with your service, when they churn, and what factors drive their decisions. Incorporating cohort analysis into your financial model helps you make more precise revenue and retention projections.
- Creating Dynamic Dashboards for Real-Time Insights: Visualizing your financial model through dynamic dashboards can provide real-time insights into your business’s performance. These dashboards can track key metrics like cash flow, revenue, and profitability, and they allow you to monitor your progress against financial goals. Real-time insights give you the flexibility to make quick adjustments to your strategy and keep your business on track.
SaaS financial models are highly valuable tools, but they can also be prone to mistakes that can lead to incorrect assumptions and poor decision-making. Understanding the common pitfalls of financial modeling can help you avoid costly errors and create a more reliable and actionable financial model.
-
Overestimating Growth Projections: It’s easy to get carried away with ambitious growth targets, especially if you’re experiencing early success. Overestimating your customer acquisition rate or sales growth can lead to inflated revenue forecasts, which may ultimately disappoint investors or misguide strategic decisions. Instead, it’s important to base projections on realistic assumptions, especially if you’re a new business with limited data.
-
Neglecting Customer Churn Impact: Churn rate is one of the most critical factors in a SaaS business’s financial health, yet it’s often overlooked or underestimated in financial models. A higher-than-expected churn rate can drastically impact long-term revenue, especially if you have high customer acquisition costs. Accurately modeling churn and factoring it into revenue projections is essential for a realistic SaaS financial model.
-
Underestimating Operational Costs: Many SaaS businesses focus too heavily on revenue growth and fail to account for the increasing operational costs that come with scaling. As your business grows, you’ll need to invest more in cloud hosting, customer support, product development, and other infrastructure. Overlooking these expenses can result in overly optimistic profit projections and cash flow shortages.
-
Ignoring Market and Industry Trends: Financial models should account for shifts in the market and industry trends, such as increased competition, changing customer needs, or emerging technologies. Ignoring these trends can lead to unrealistic assumptions, particularly when projecting revenue or customer acquisition. Continuously monitoring your industry and updating your financial model accordingly is crucial for staying ahead.
-
Using Inaccurate or Outdated Data: A financial model is only as accurate as the data that goes into it. Using outdated financial data, incorrect assumptions, or industry averages that don’t apply to your business can skew your results. It’s important to continually update your model with real-time data and adjust your assumptions as your business and market conditions evolve.
Make a one-time payment and
enjoy your template forever.
No extra costs, no strings attached,
more savings for you.
Keep your templates up-to-date
with free access to regular updates.
Related products
-
Sale!
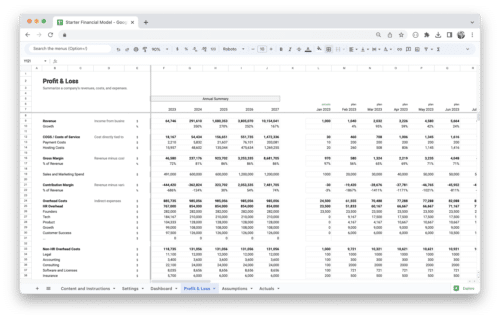
Startup Financial Model Template
100,00 €Original price was: 100,00 €.66,39 €Current price is: 66,39 €.Value added tax is not collected, as small businesses according to §19 (1) UStG.
Add to cart Details -
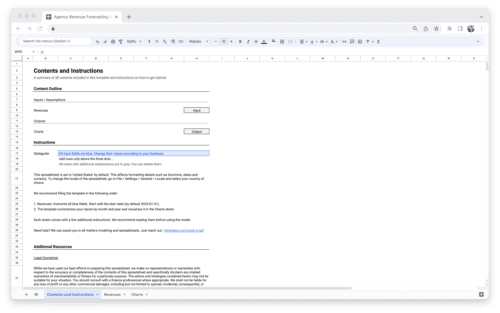
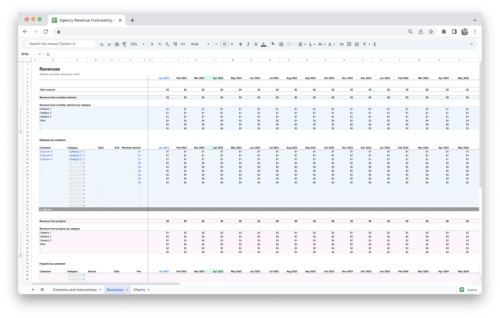
Agency Revenue Forecasting Tool
41,18 €Value added tax is not collected, as small businesses according to §19 (1) UStG.
Add to cart Details -
Sale!
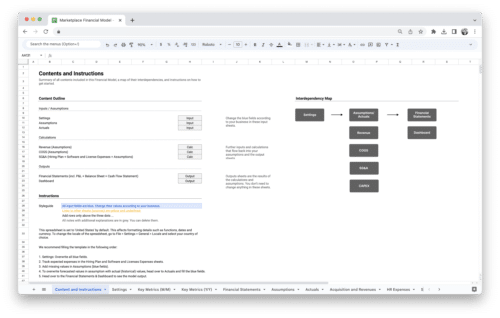
Marketplace Financial Model Template
184,03 €Original price was: 184,03 €.125,21 €Current price is: 125,21 €.Value added tax is not collected, as small businesses according to §19 (1) UStG.
Add to cart Details -
SaaS Revenue Forecasting Tool
41,18 €Value added tax is not collected, as small businesses according to §19 (1) UStG.
Add to cart Details

