Spreadsheet templates and financial models for founders and finance teams
Google Sheets and Excel templates for forecasting, budgeting, P&L, and investor-ready models—customize a maintained workbook for your business.
Not sure where to start? Open the standard financial model or SaaS financial model, then use Browse by category on this page to compare the rest.
Browse by category
Skip the scroll—open the section you need on this page.
Premium Financial Models
Integrated workbooks with linked statements, dashboards, and valuation blocks when you need a full model—not a single-sheet sketch.
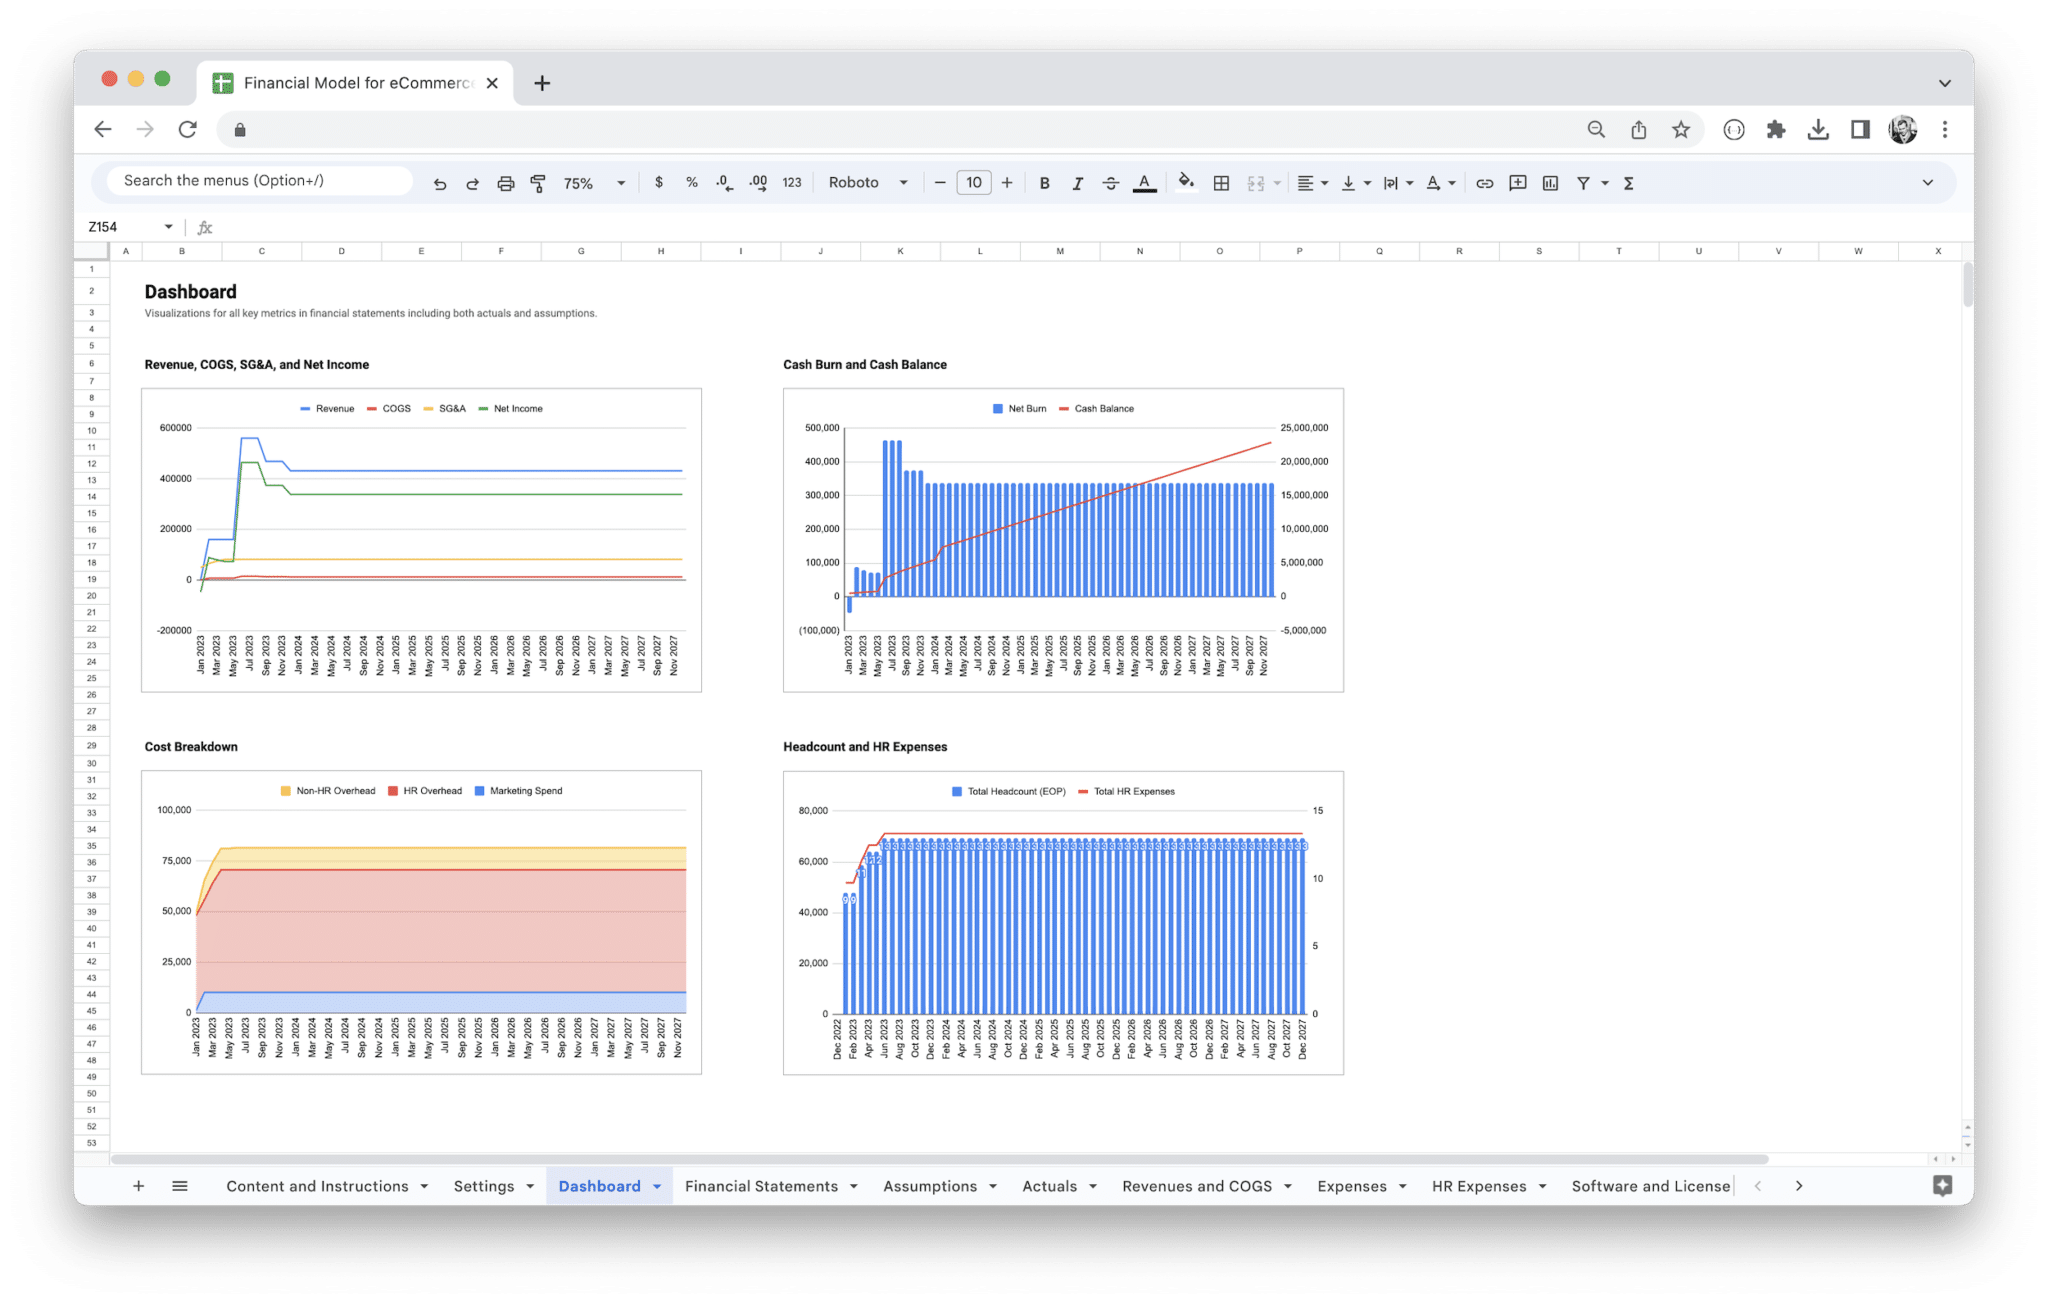
E-Commerce Financial Model
Forecast your store with a Google Sheets financial model template built for online retail, DTC, and omnichannel brands: capture revenues, people and software costs, and assumptions where the sheet documents them, then read consolidated financial statements and monthly and annual charts for budgets, peak-season planning, and investor-ready readouts. We ship it as a paid, maintained product with clear tab logic—not a one-off download you re-wire every quarter.
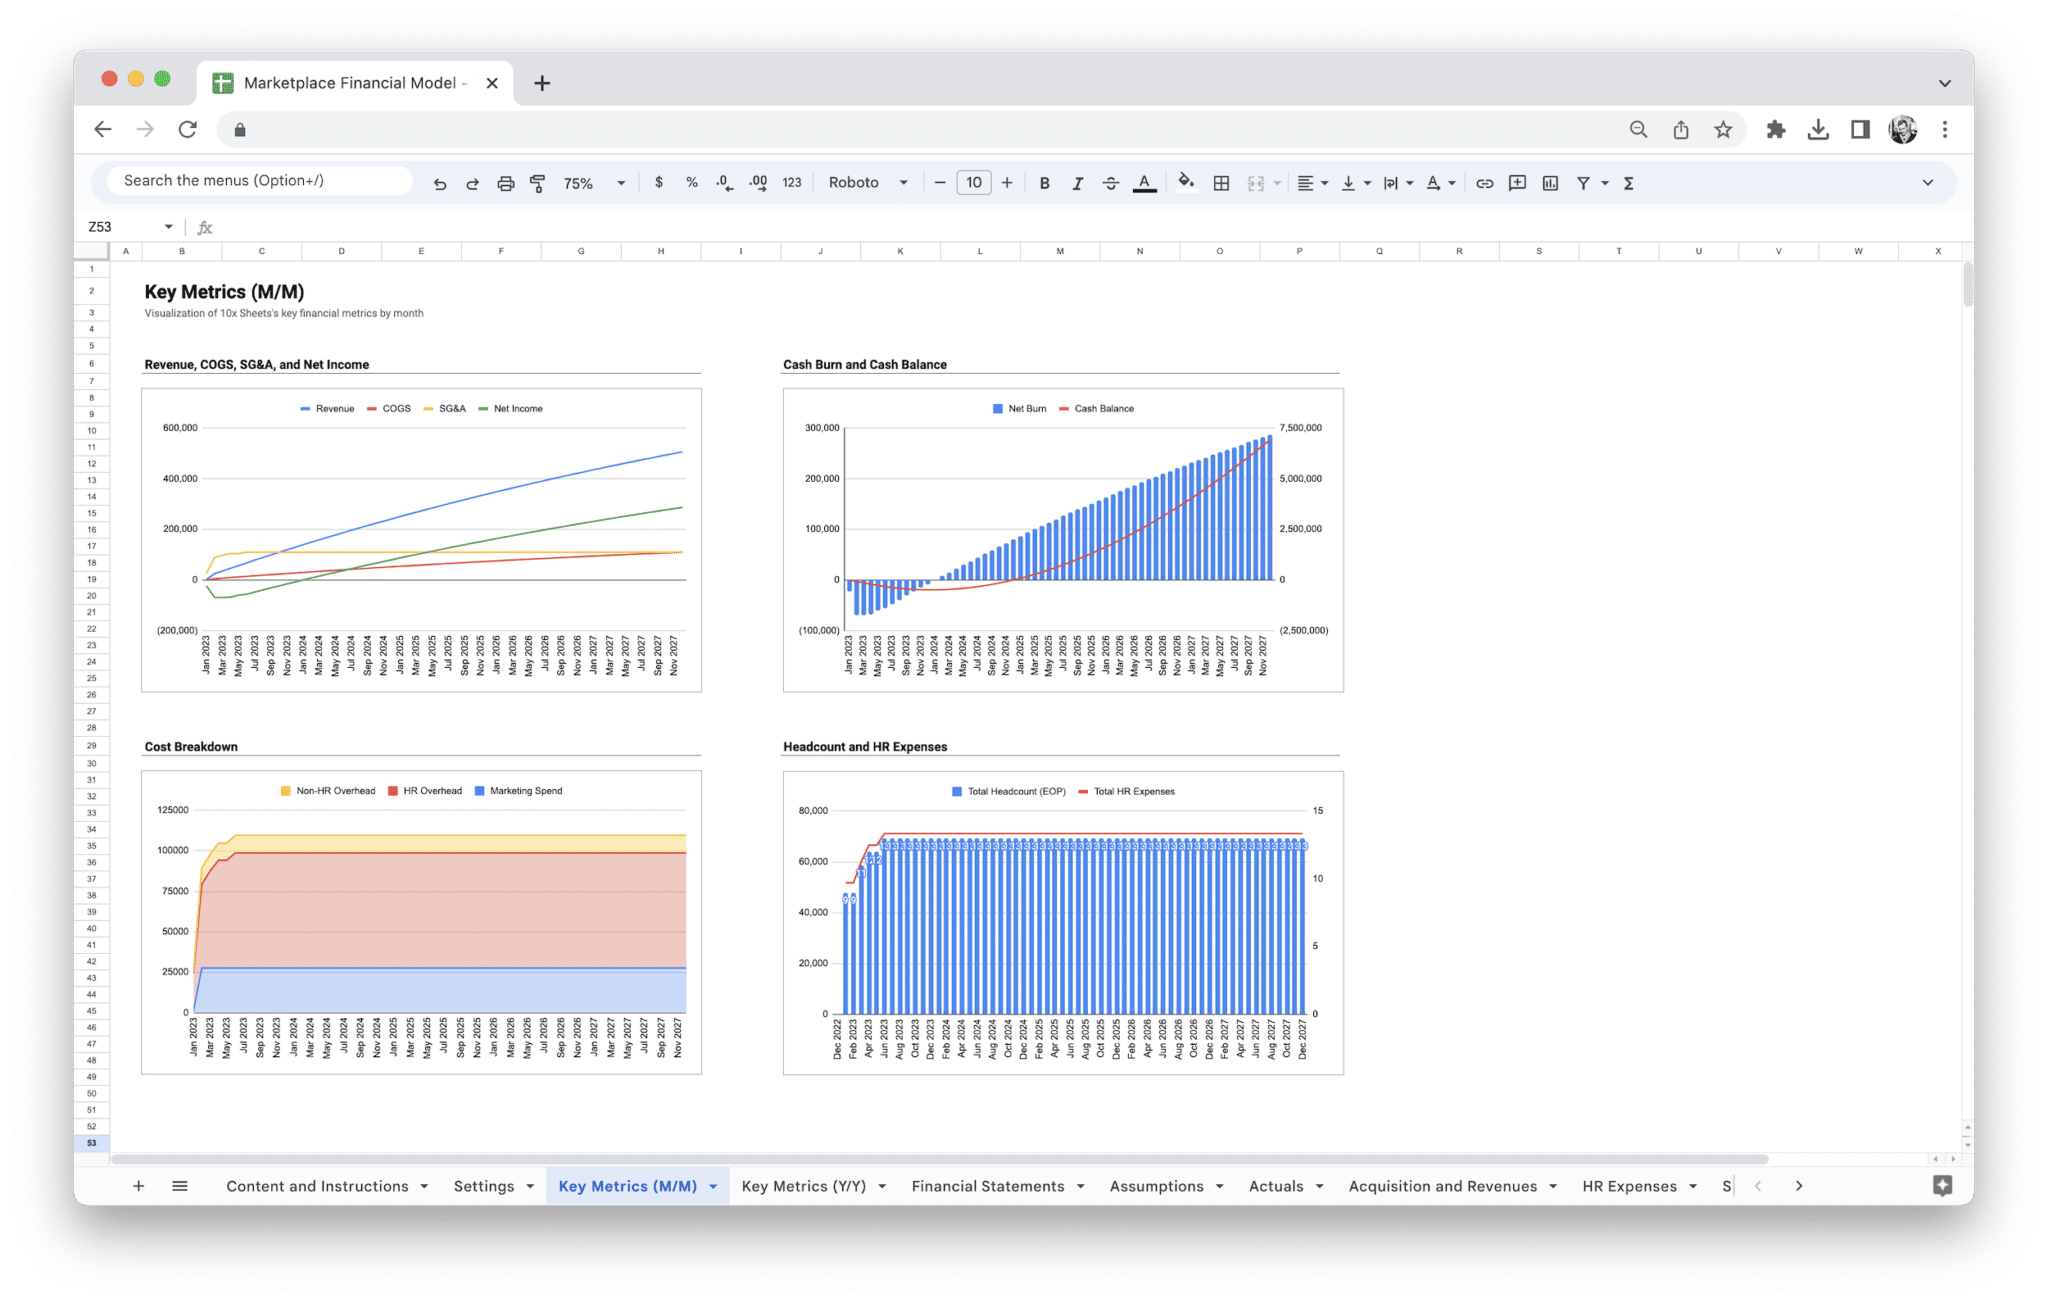
Marketplace Financial Model
Google Sheets financial model for two-sided marketplaces: Revenues for supply- and demand-side growth and monetization, HR and software cost tabs, Assumptions with optional Actuals, consolidated statements, and monthly and annual charts—one maintained workbook for budgets, fundraising prep, and operating reviews.
SaaS Financial Model Template
Google Sheets workbook for founders, FP&A, and finance leads at B2B or B2C subscription software companies. Use it for multi-year financial projections, budgets, and operating-plan reviews: tiered revenue and MRR/ARR on the Revenue tab, churn- and cohort-aware fields where the instructions label them, and operating reality across Headcount, Software and Licenses, Other Expenses, and Capex. Assumptions and optional Actuals feed one consolidated Financial Statements tab plus Charts—one auditable path from subscription drivers to statements, not a generic operating model with SaaS wording pasted in.
Standard Financial Model Template
Google Sheets financial model for operating companies: five years of monthly linked P&L, balance sheet, and cash flow, plus scenario and breakeven views, DCF and multiple-based valuation blocks, assumptions (with optional actuals), and an executive dashboard—all in one integrated workbook.
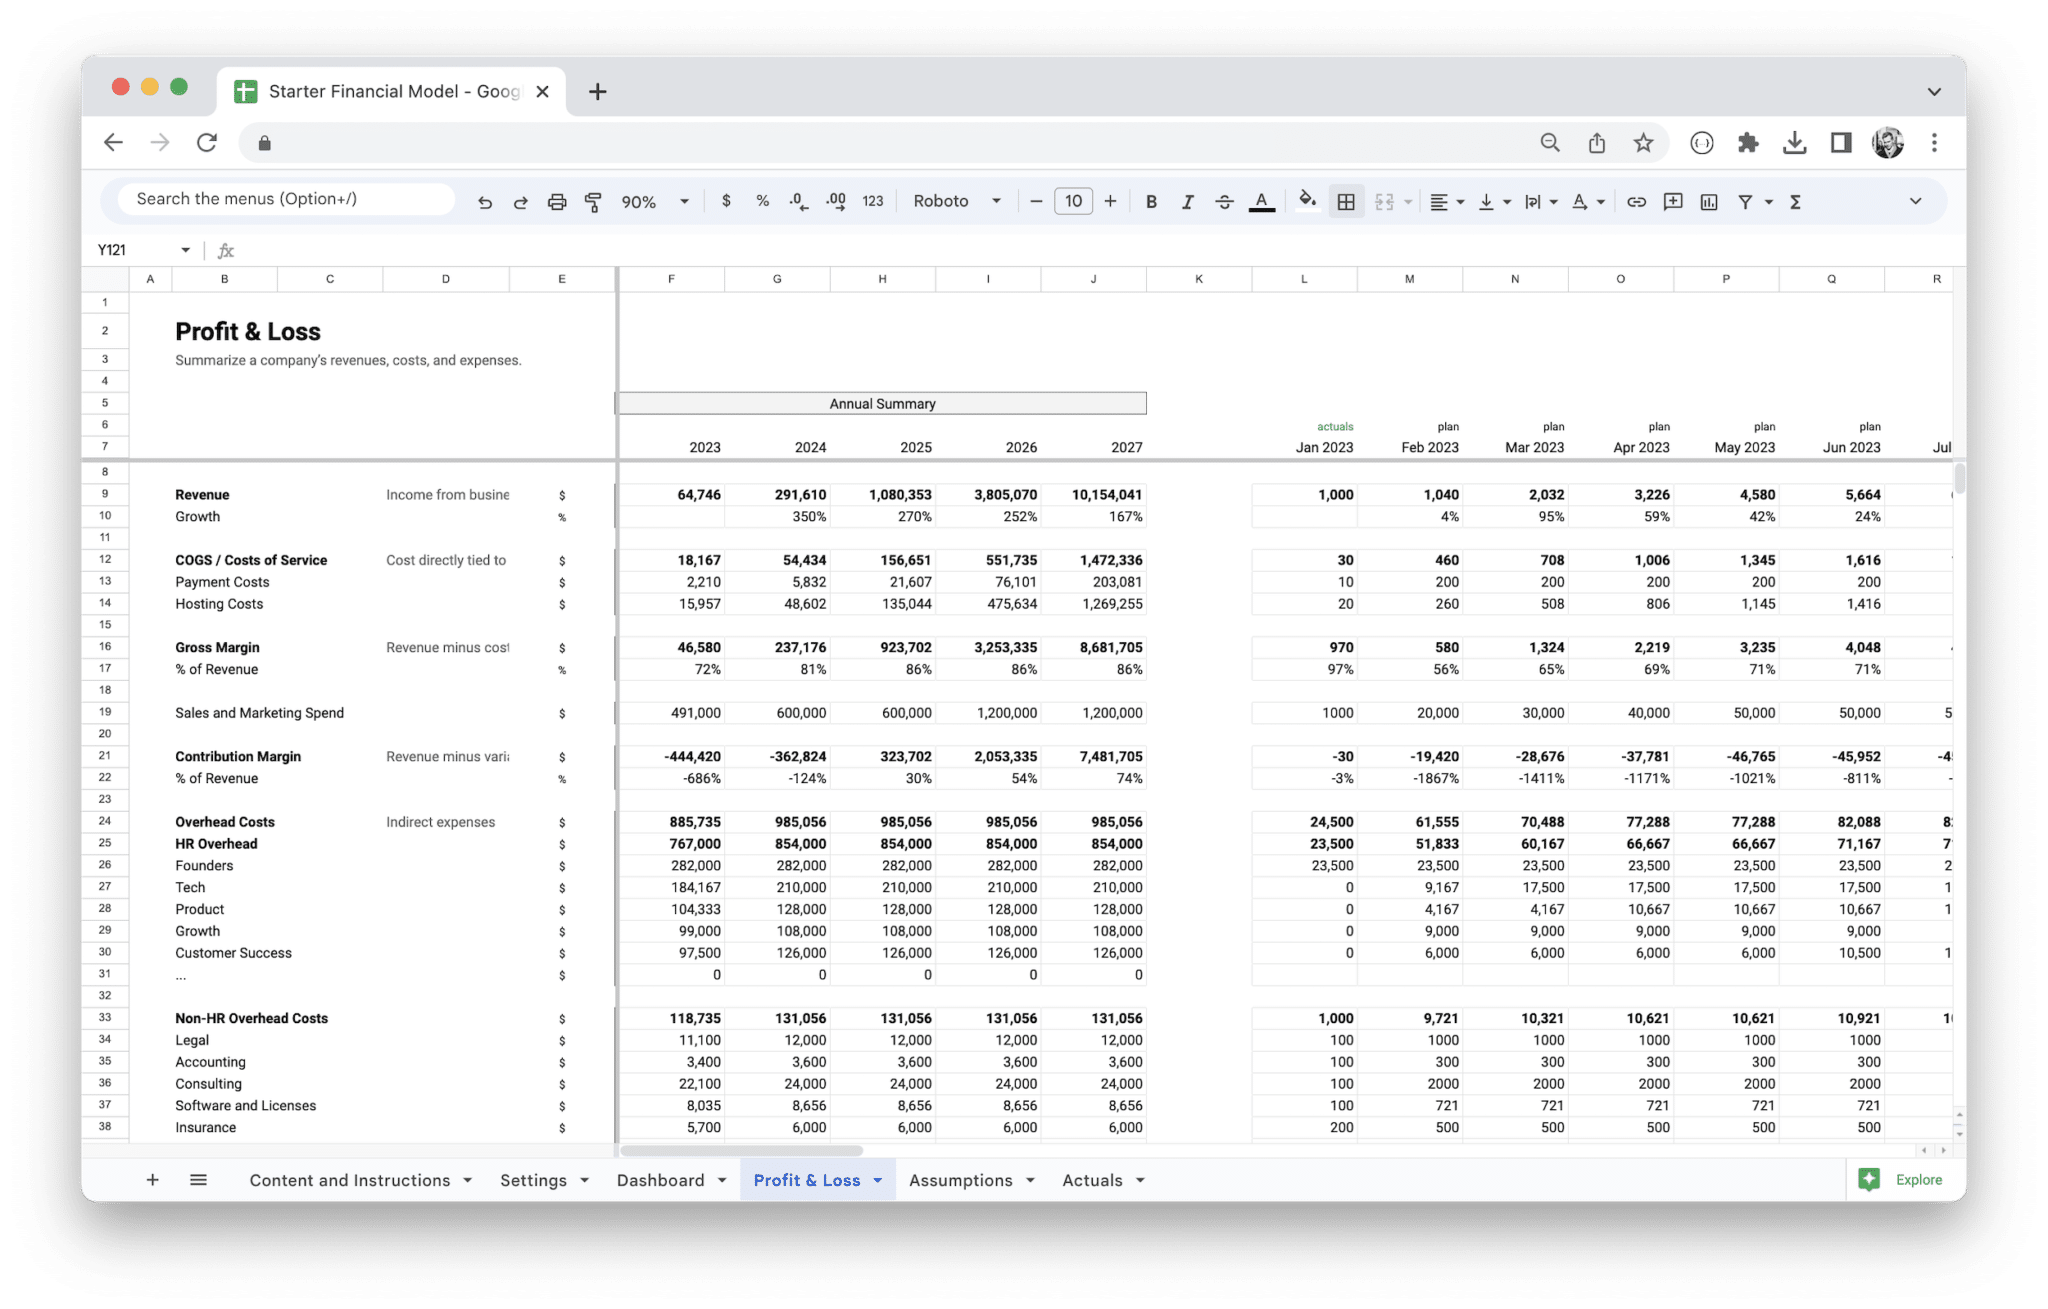
Startup Financial Model Template
Google Sheets workbook for early-stage teams: six integrated tabs turn documented assumptions and optional actuals into five years of monthly profit and loss projections, with a dashboard for leadership readouts. We maintain the file so logic, structure, and on-sheet guidance stay coherent as you iterate.
Profit and Loss Statements
P&L–first workbooks for monthly operating reviews when you are not ready for a full three-statement file.
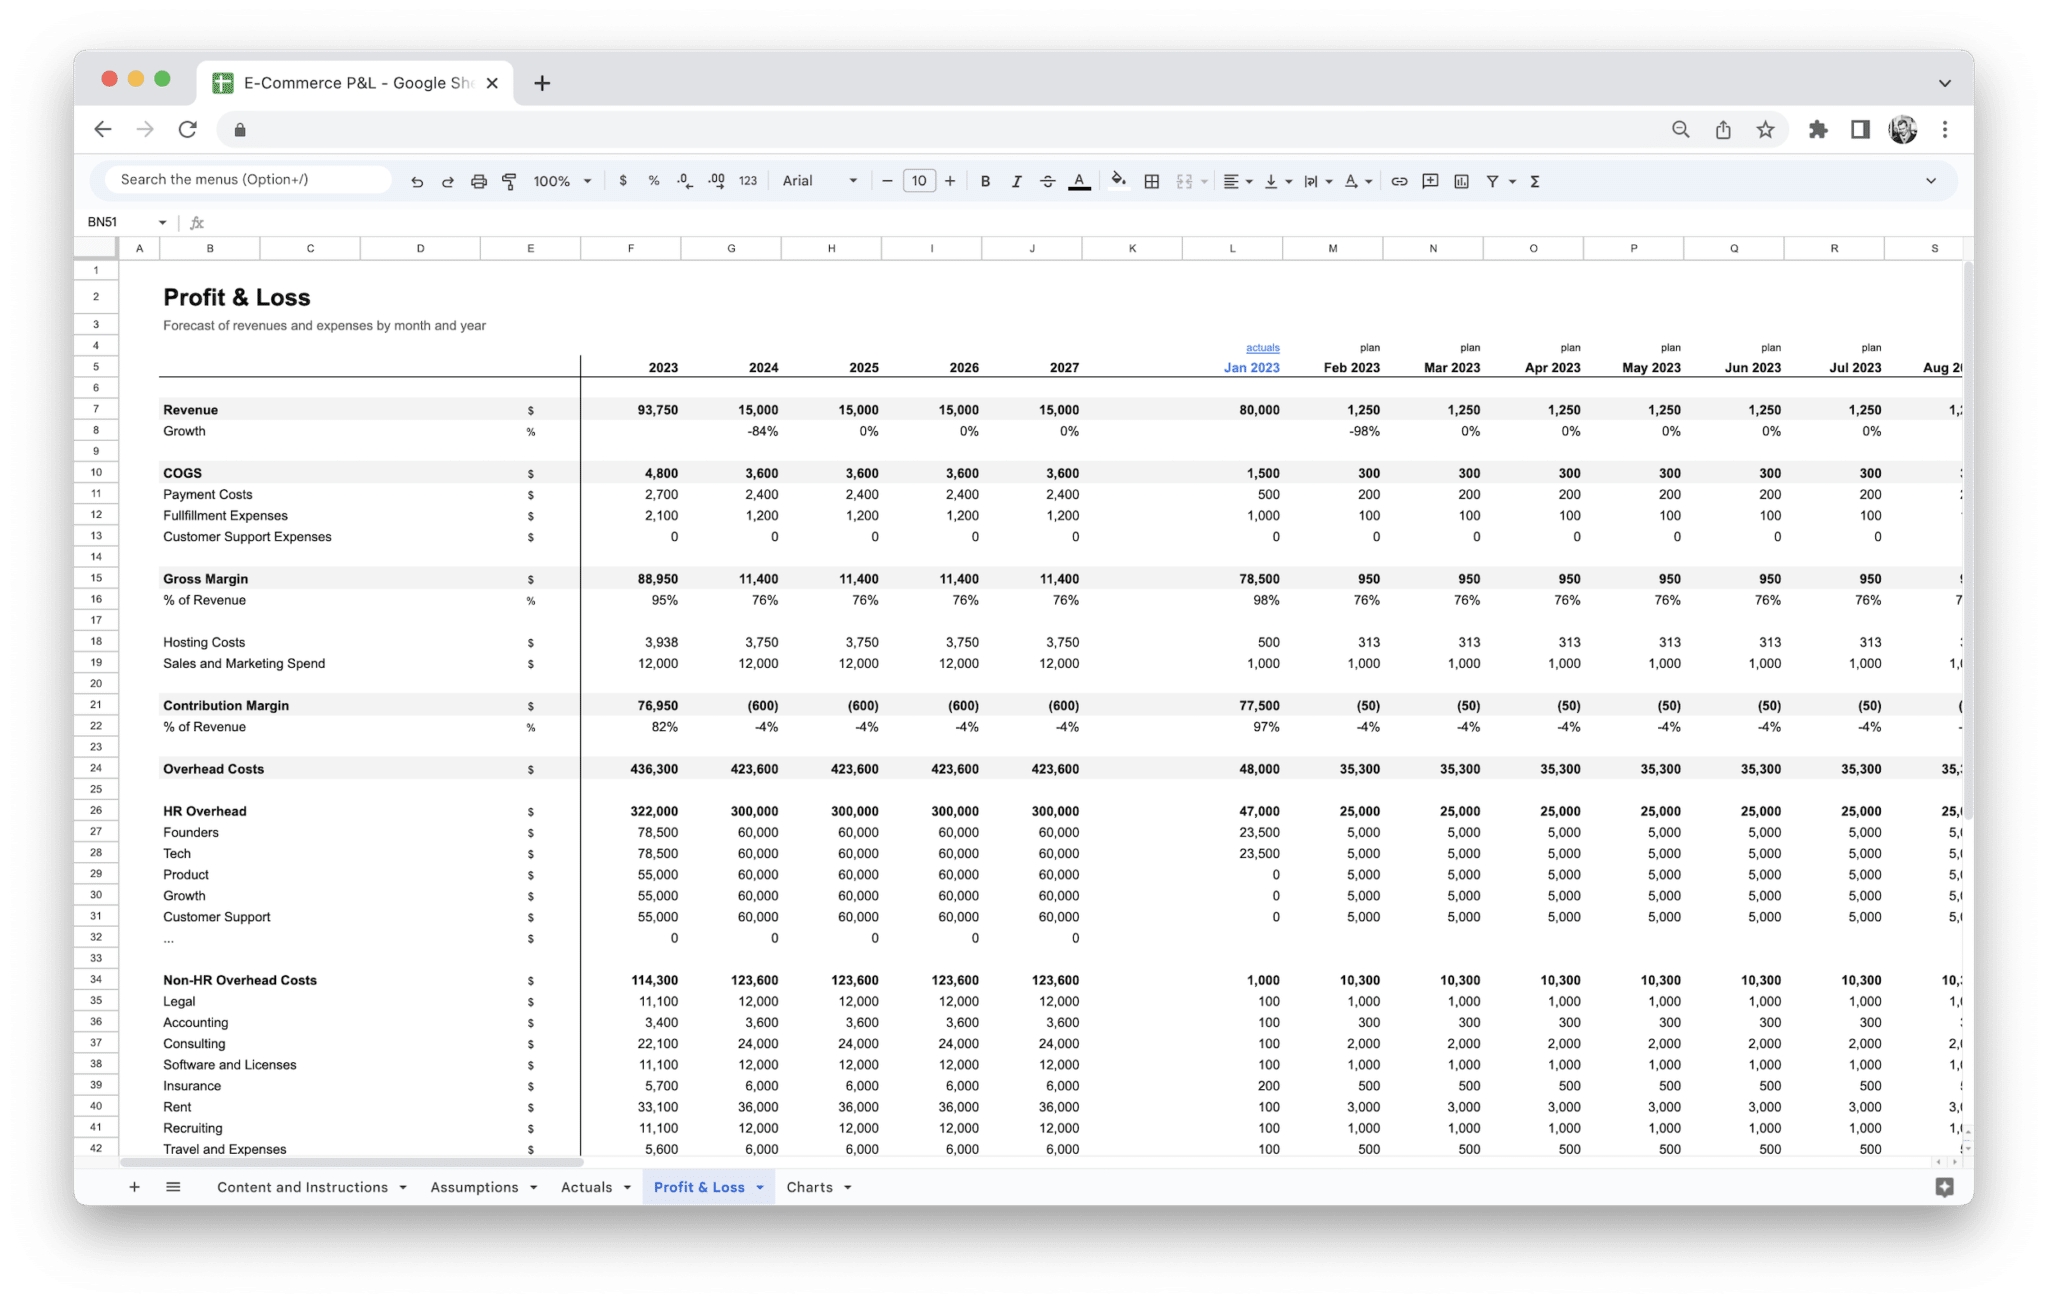
E-Commerce Profit and Loss Statement
Google Sheets P&L workbook for online retail and DTC teams: documented Assumptions, optional Actuals, five years of monthly Profit & Loss, and Charts wired from the same inputs—so GMV, fees, and operating costs tell one story without rebuilding income-statement structure from scratch.
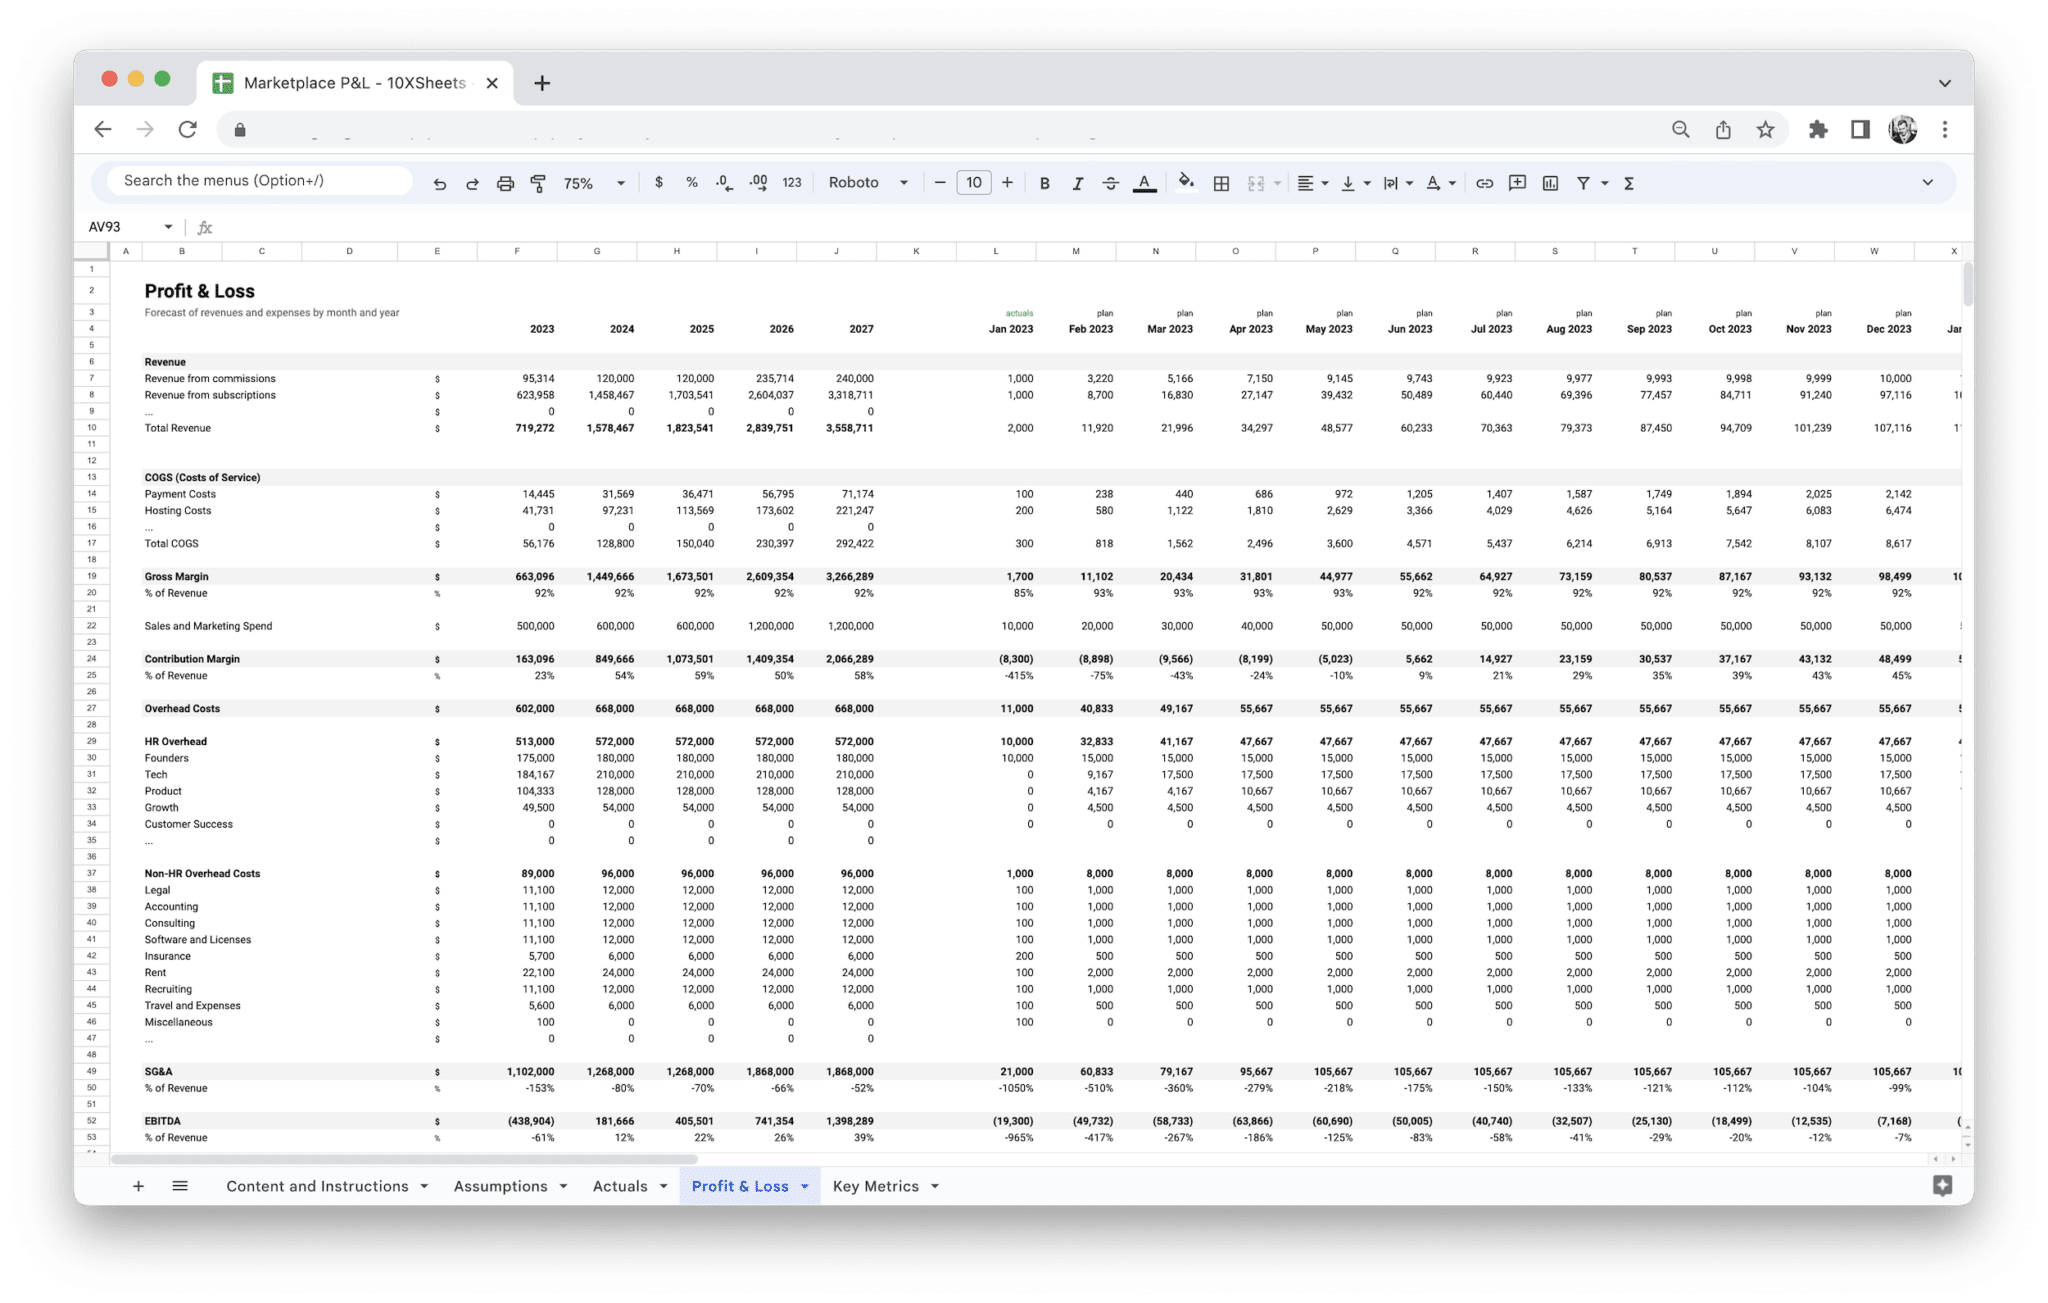
Marketplace Profit and Loss Statement
Paid Google Sheets workbook for two-sided take-rate marketplaces: drivers in Assumptions, optional Actuals, multi-year monthly income-statement outputs, and leadership chart readouts across five connected tabs—vertical marketplace framing without the ten-tab integrated model when a focused P&L is enough.
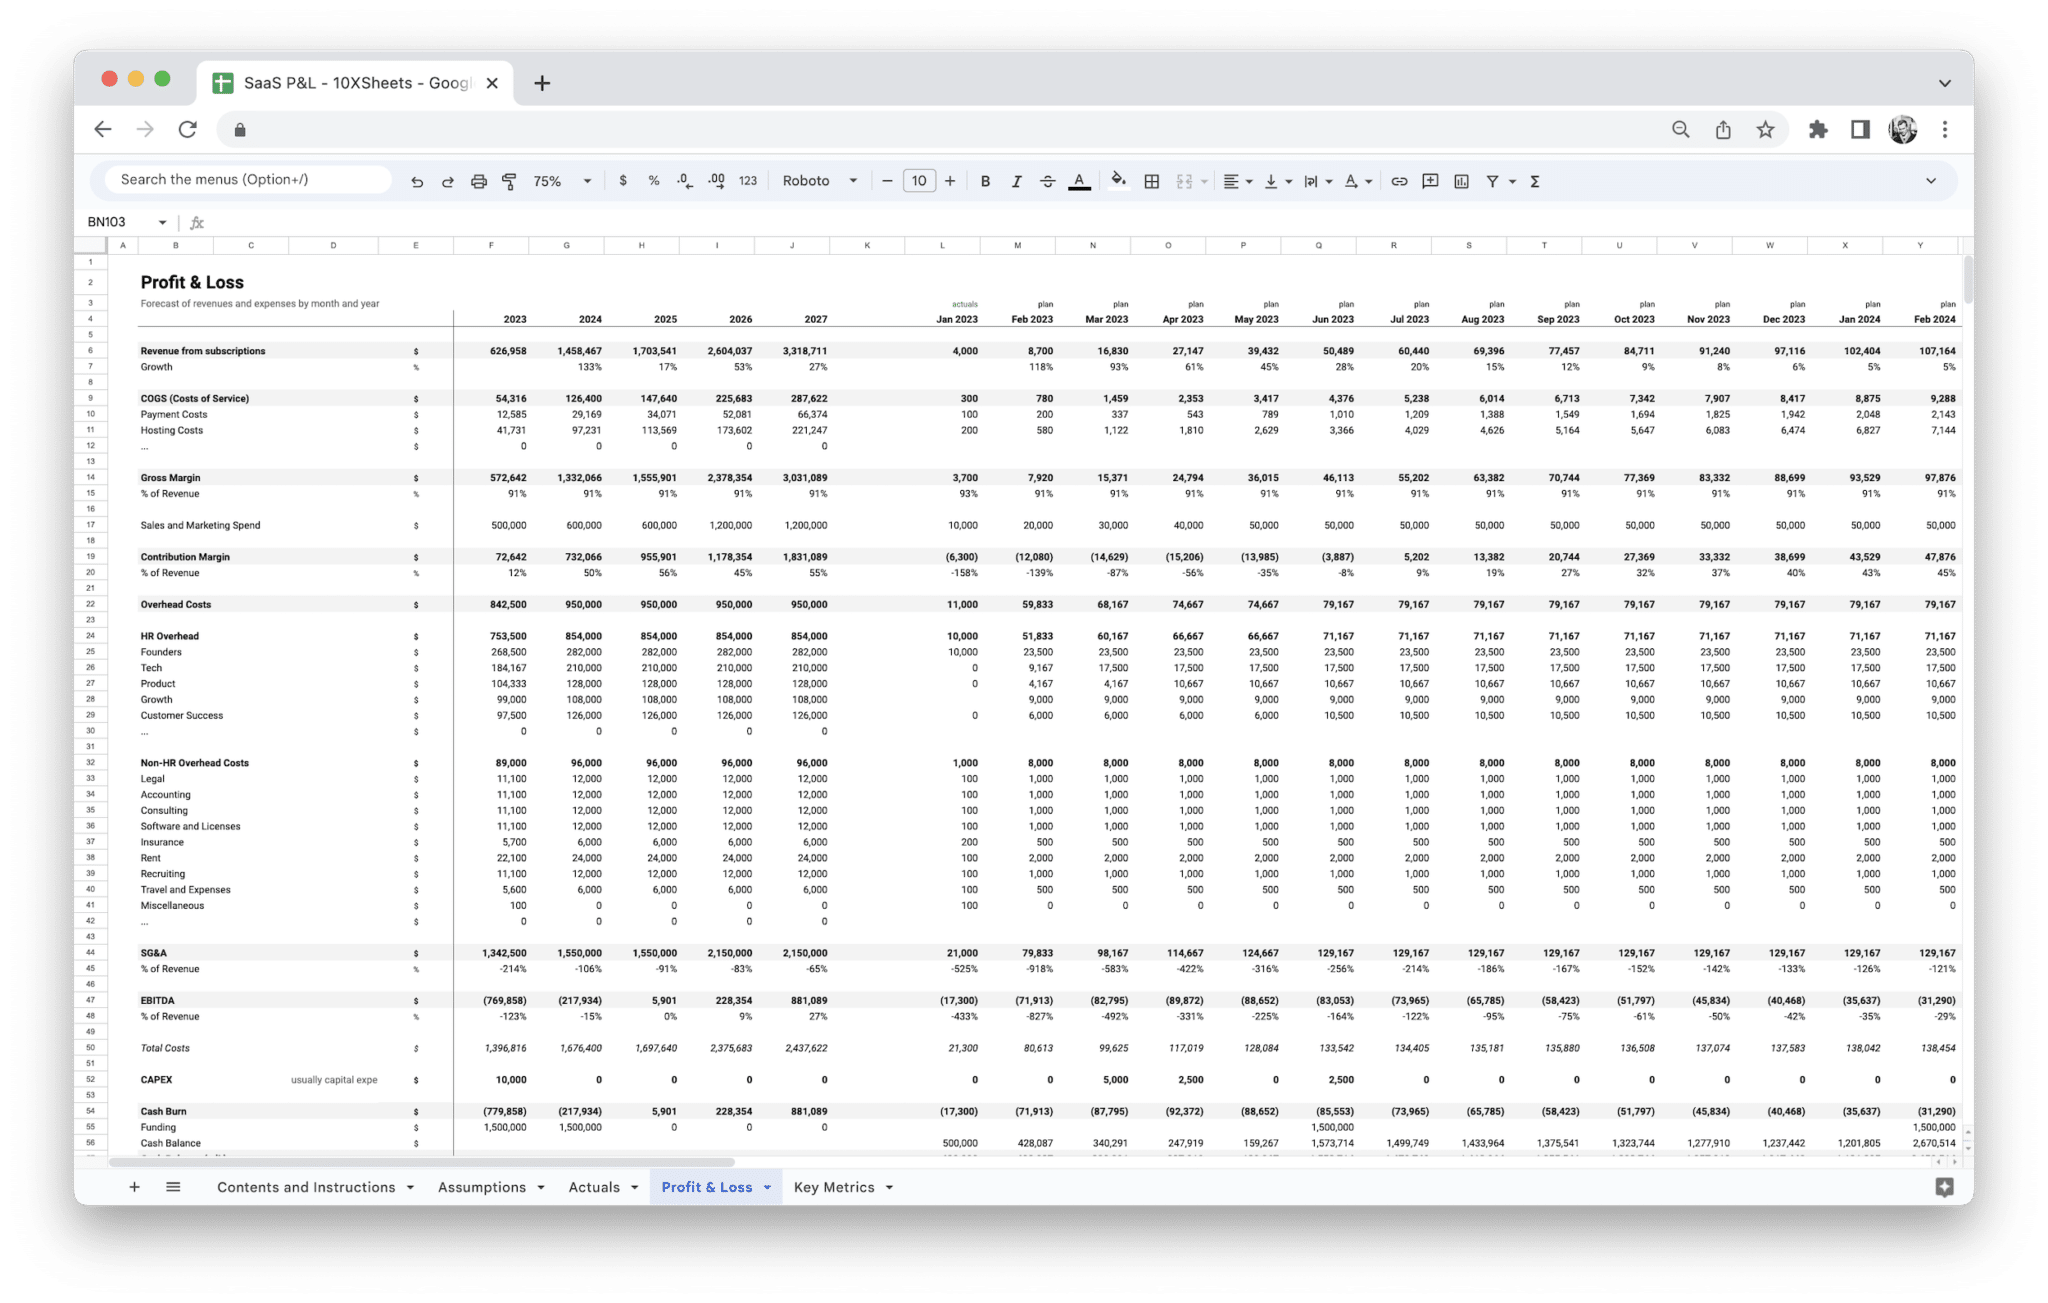
SaaS Profit and Loss Statement
Google Sheets P&L for subscription software teams—B2B or B2C SaaS and similar models: one maintained path from drivers to monthly income statement and Charts so recurring revenue, marketing and operating spend, and net result stay on the same grid. Choose this lighter catalog file when you need a credible SaaS P&L first, not linked balance sheet, cash flow, scenarios, or valuation in one workbook.
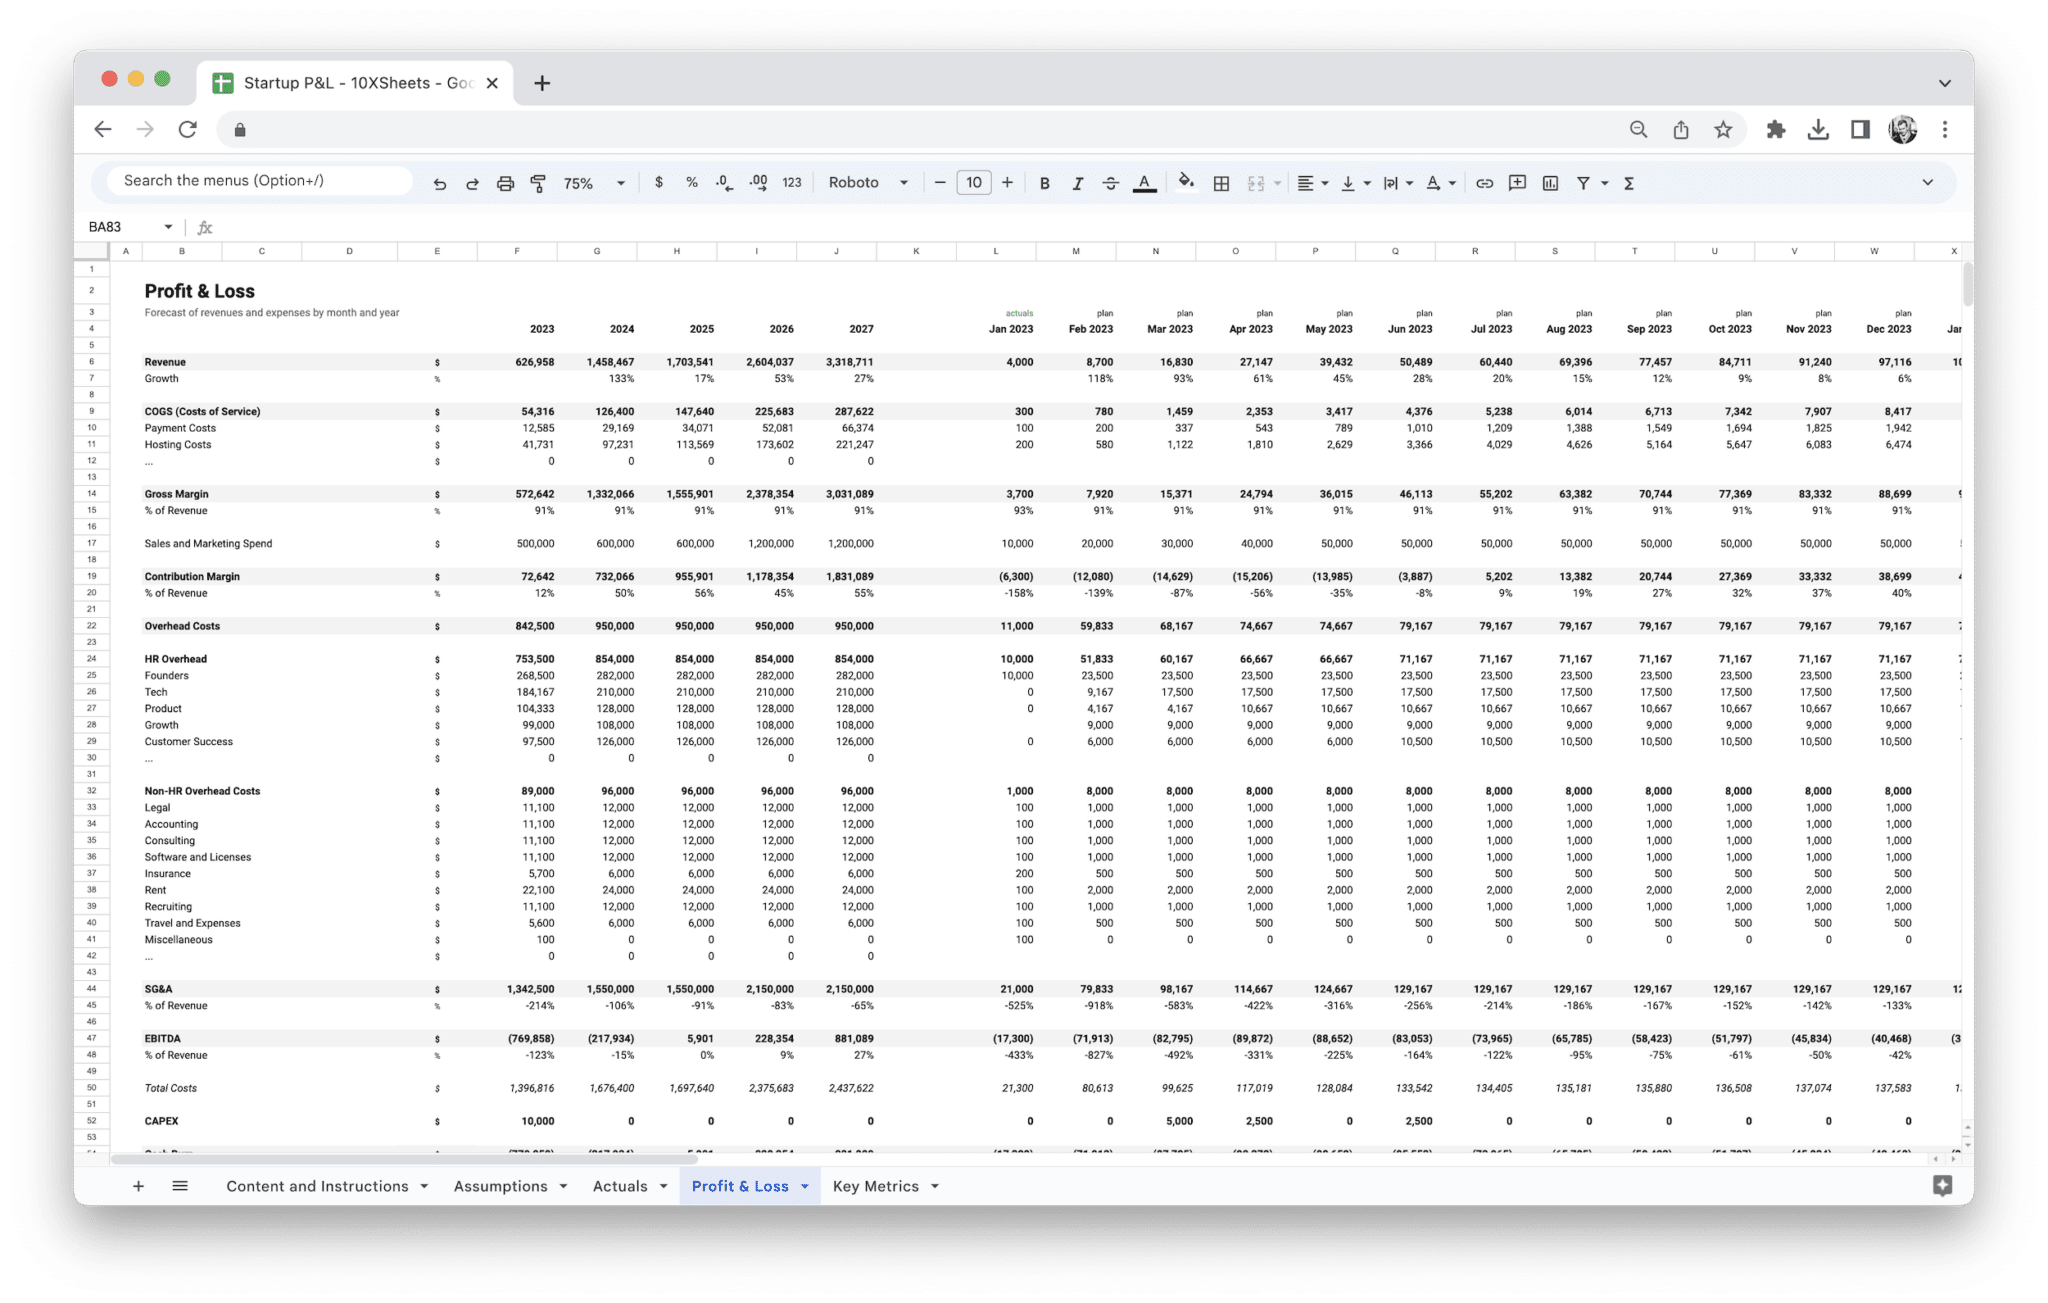
Startup Profit and Loss Statement
Google Sheets workbook for founders and small teams who need a credible startup profit and loss forecast: documented Assumptions, optional Actuals, five years of monthly Profit & Loss, and a Key Metrics readout fed from the same inputs. Five tabs—no separate Settings sheet—so you stay in a lean P&L flow instead of the six-tab Startup Financial Model when that extra surface is more than you need right now.
Revenue Forecasting Tools
Forecasting workbooks tuned to common revenue motions so you can stress-test growth without rebuilding formulas from scratch.
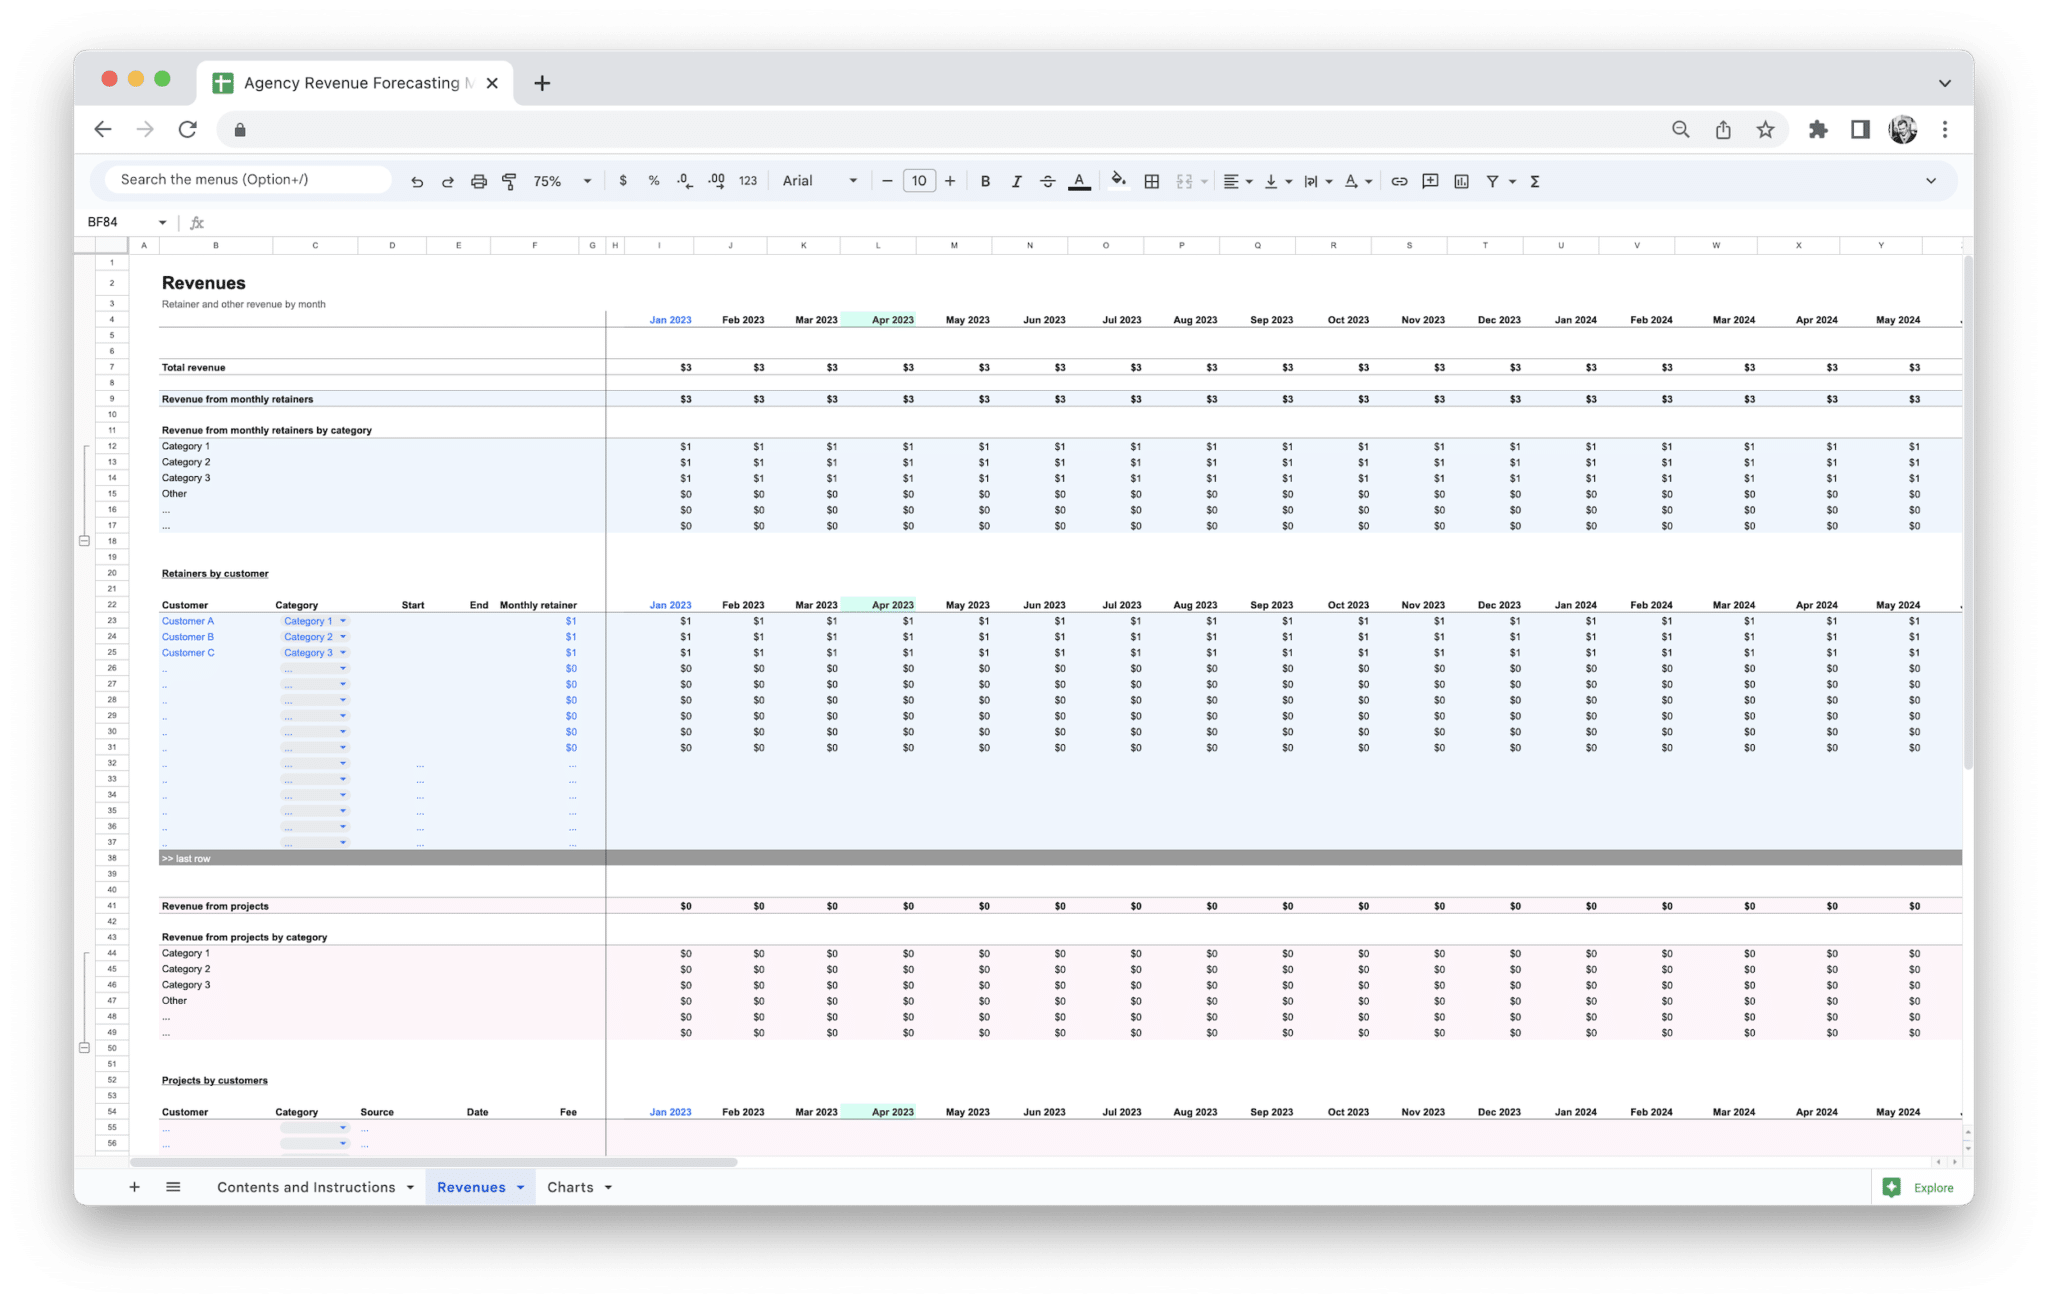
Agency Revenue Forecasting Tool
Google Sheets workbook for agency revenue planning: three tabs (Contents and Instructions, Revenue, Charts). Model retainers by customer, monthly retainer revenue (including by category where labeled), project revenue and projects by customer, other revenue, and retainer-plus-other rollups—then read the same totals in Charts. Revenue-only scope (no bundled P&L, balance sheet, or cash flow).
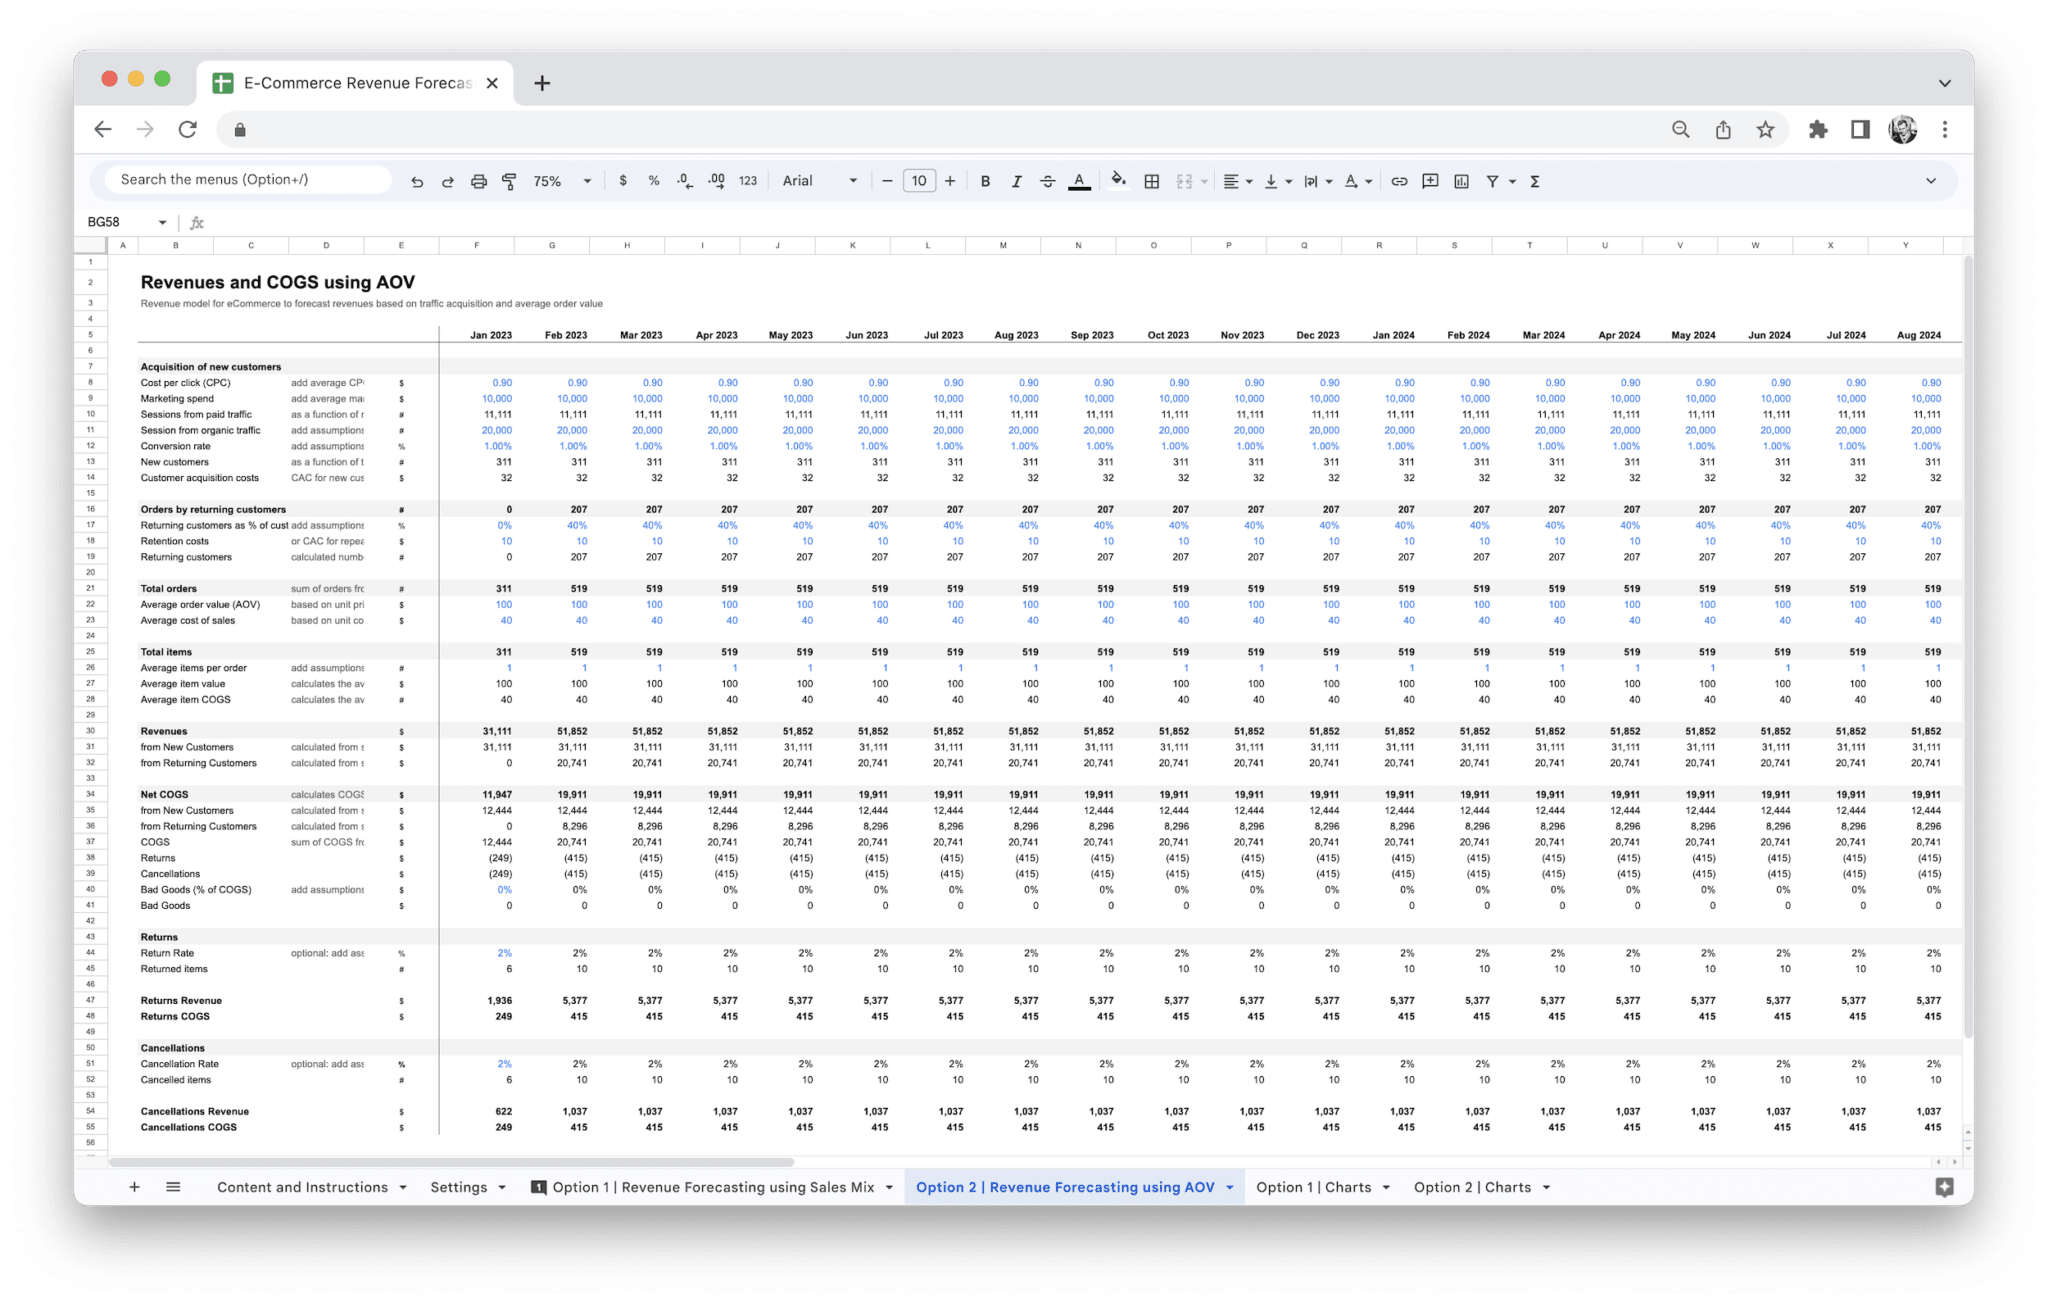
E-Commerce Revenue Forecasting Tool
Google Sheets workbook for online retail and DTC teams: connect traffic and conversion to revenue and cost of sales, pick either a category sales-mix path or an AOV path in Settings, then use the paired Option revenue and Charts tabs so visuals stay on the same wiring—six tabs built for revenue depth, not a full financial model.
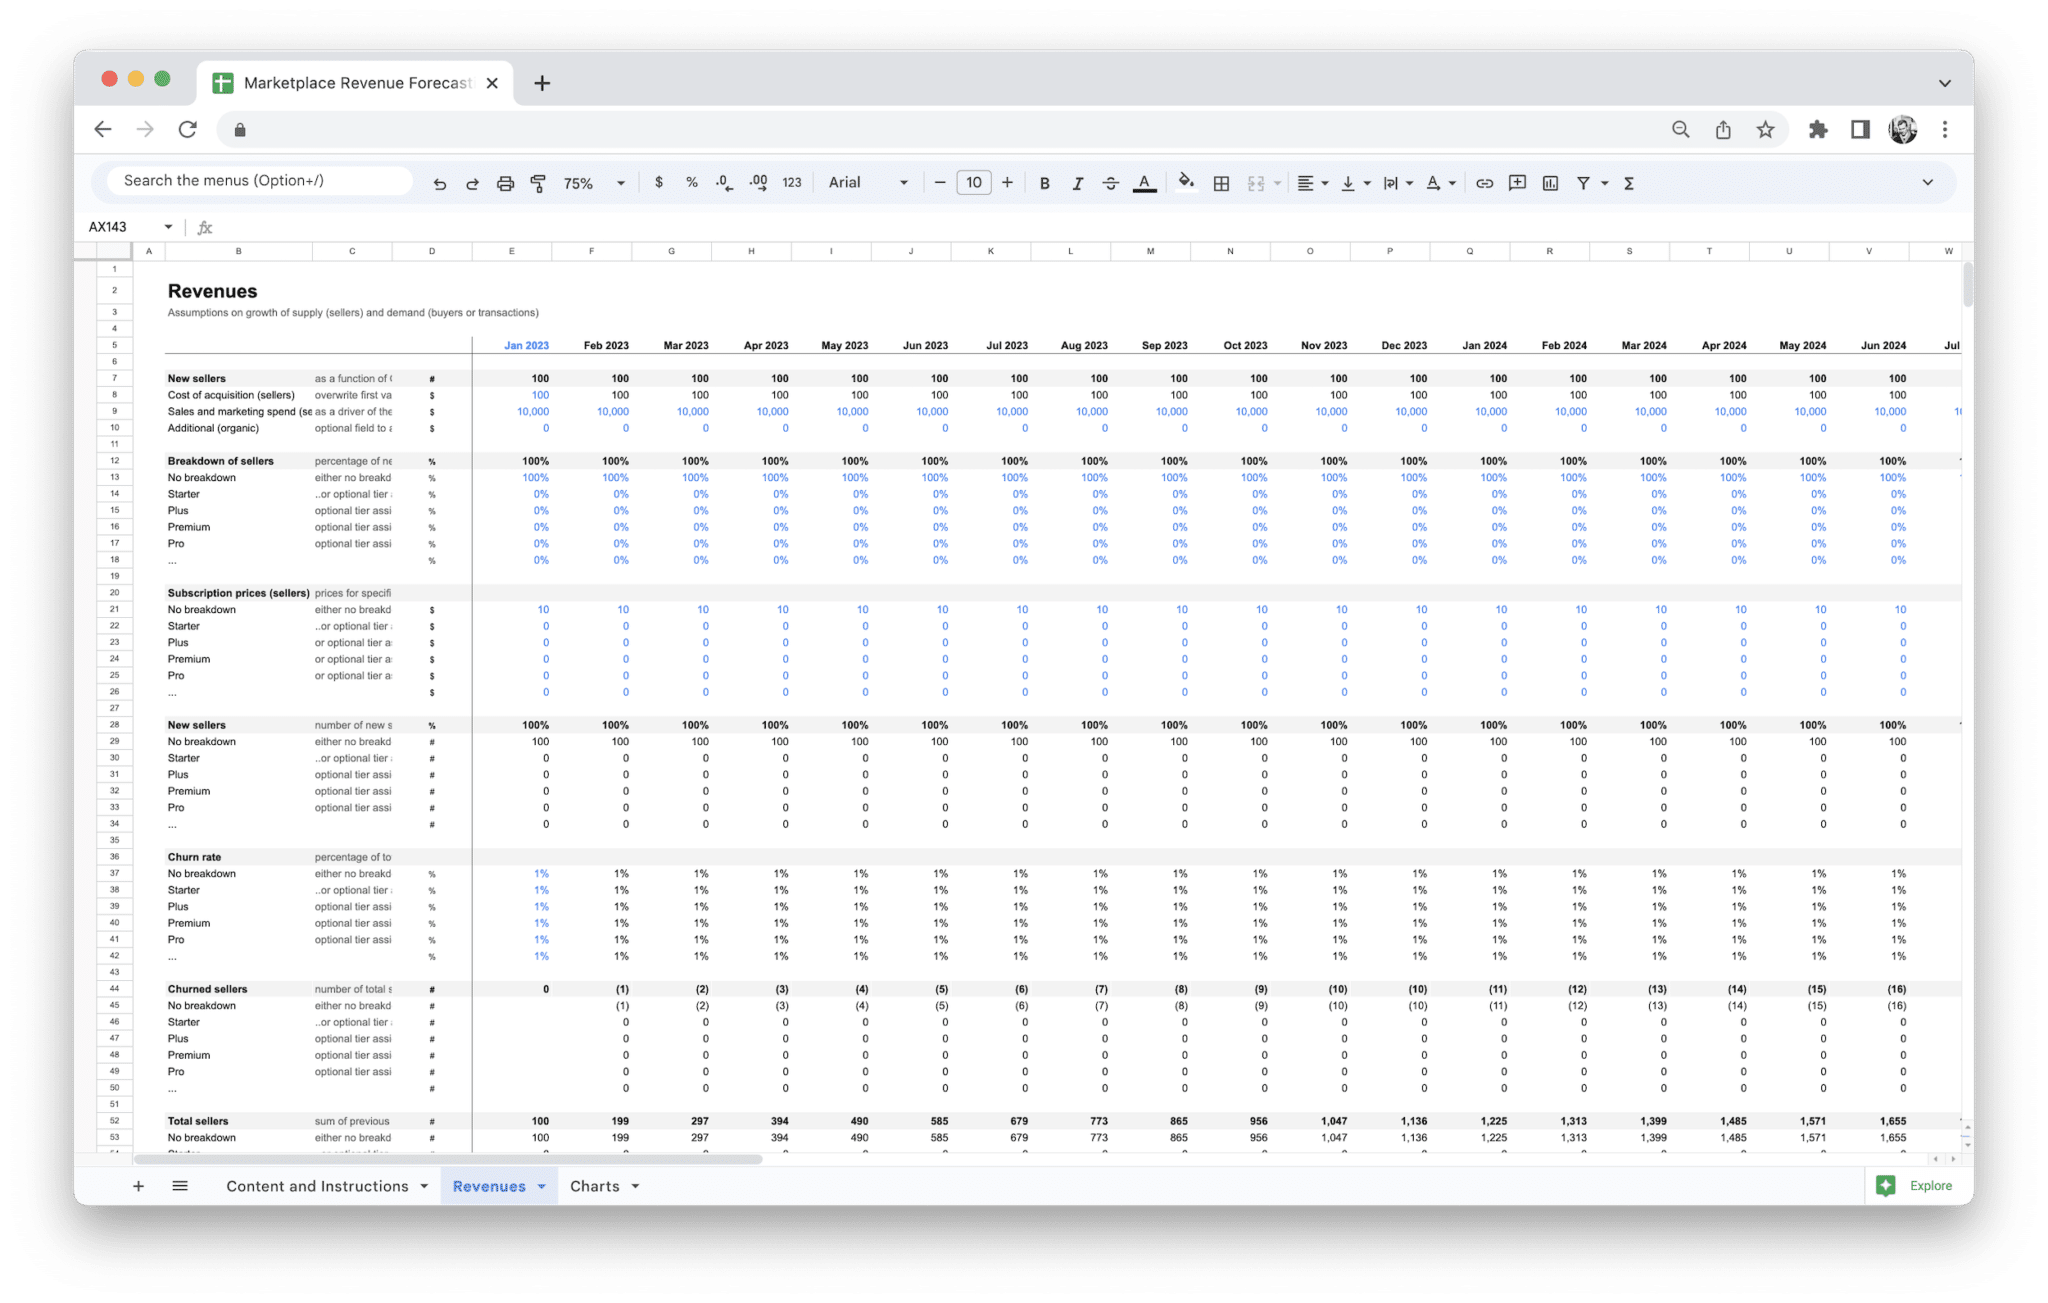
Marketplace Revenue Forecasting Tool
Maintained Google Sheets marketplace revenue model—three tabs (Content and Instructions, Revenue, Charts). Map supply and demand, GMV, and fees into net marketplace revenue on a monthly grid; Charts mirror the same Revenue wiring—not a generic sales spreadsheet or hosted calculator.
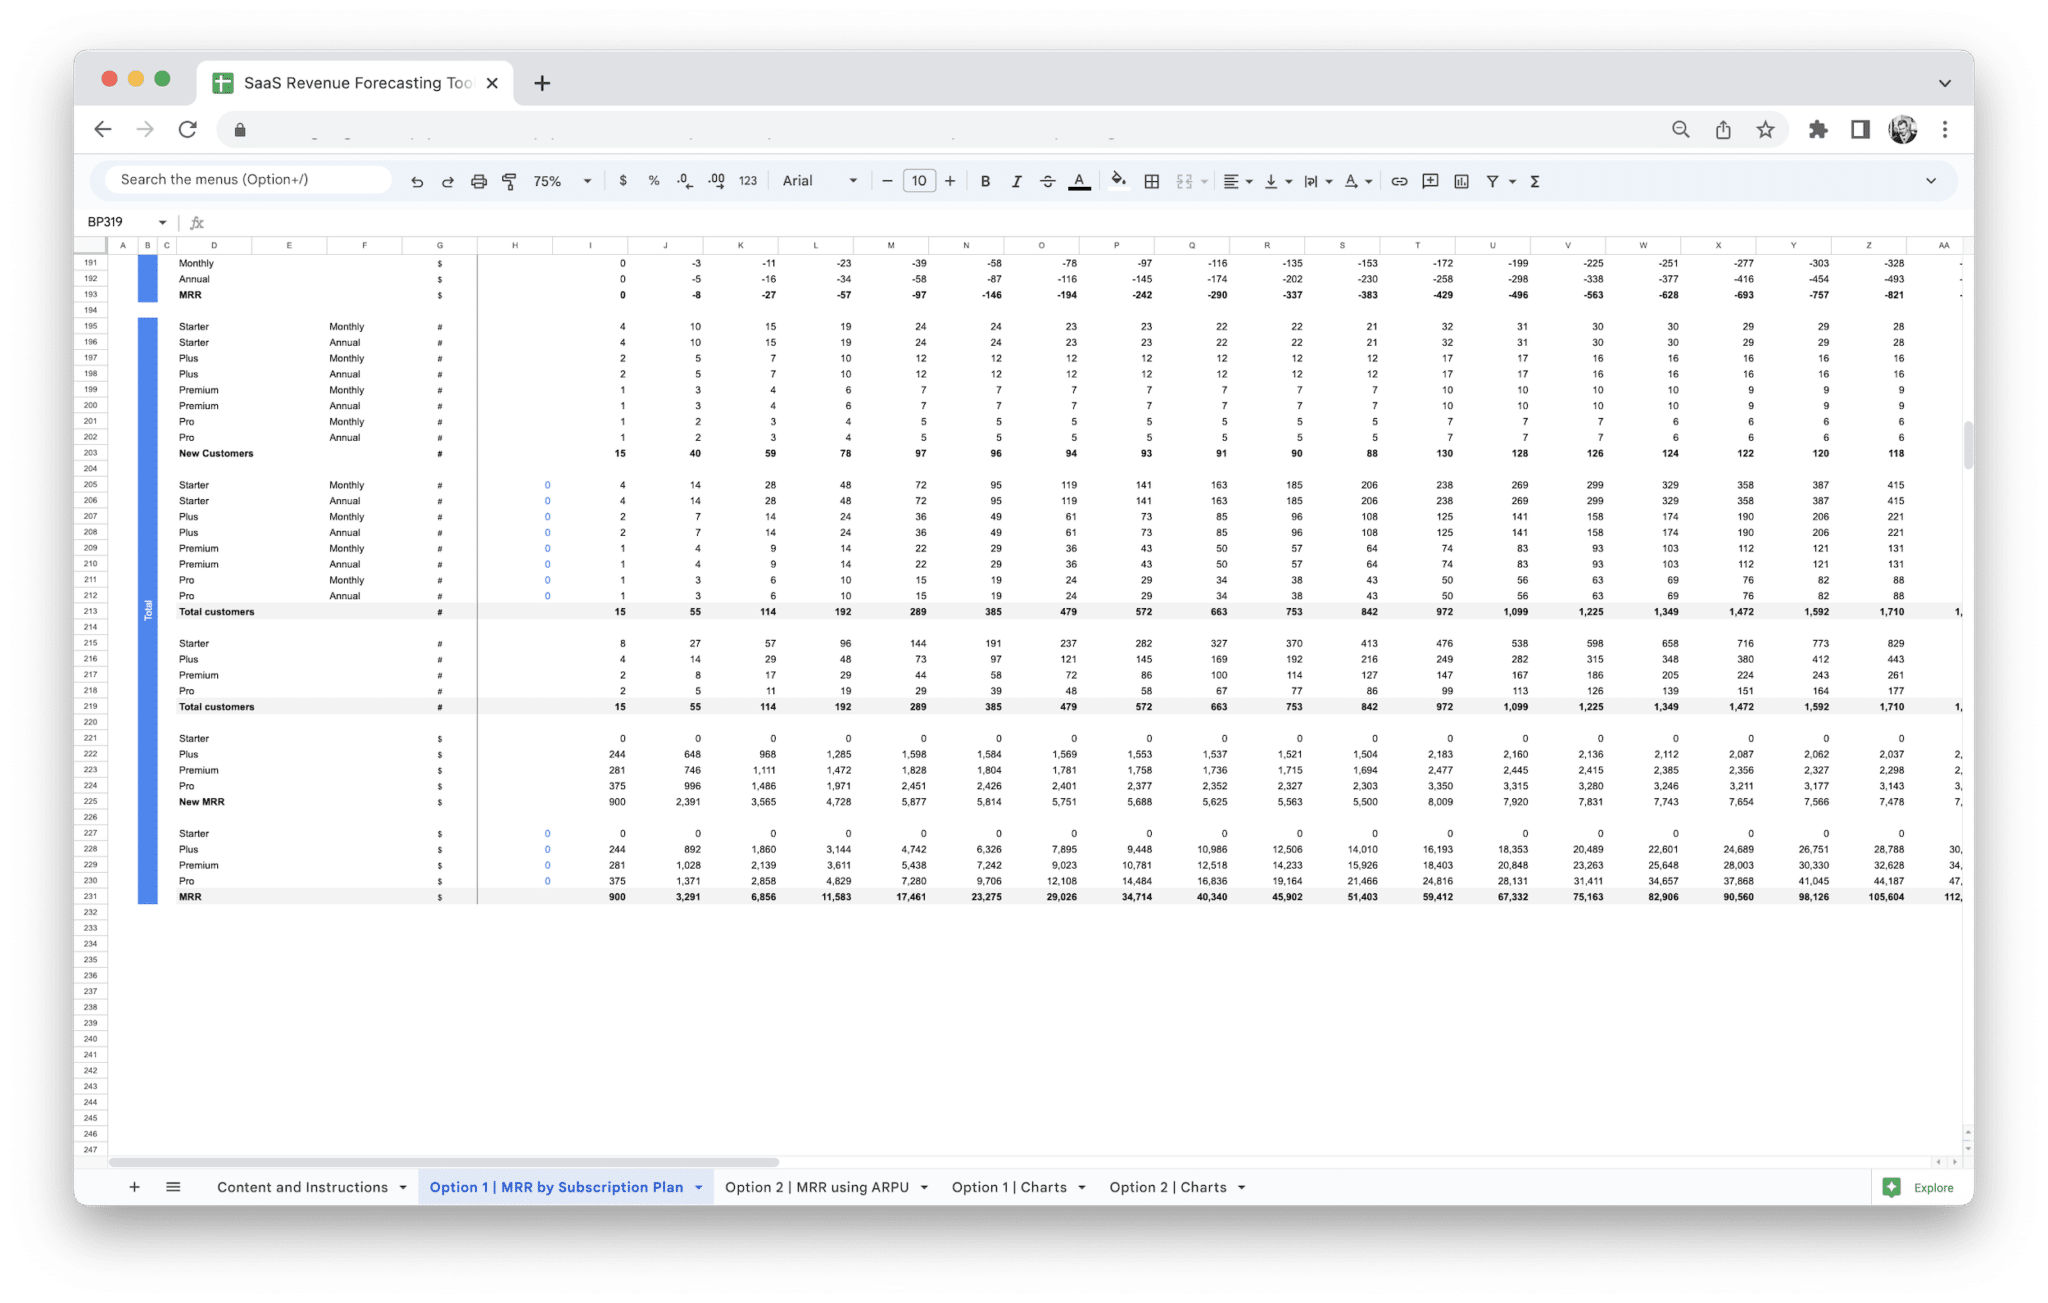
SaaS Revenue Forecasting Tool
Google Sheets workbook for subscription teams: build a monthly MRR forecast using either tier-based pricing with bridge movements (new, upsell, downsell, churn) or an ARPU-led path with acquisition and churn—each engine ships with its own Charts tab wired to the same inputs. Five tabs (Content and Instructions plus two revenue options and two chart readouts). Choose this when revenue and charts are the bottleneck; choose our SaaS Financial Model when you need costs and consolidated statements in the same file.
Planning & utilities
Capex schedules, headcount plans, license renewals, and other focused utilities you can use on their own or next to a full financial model.
 Free
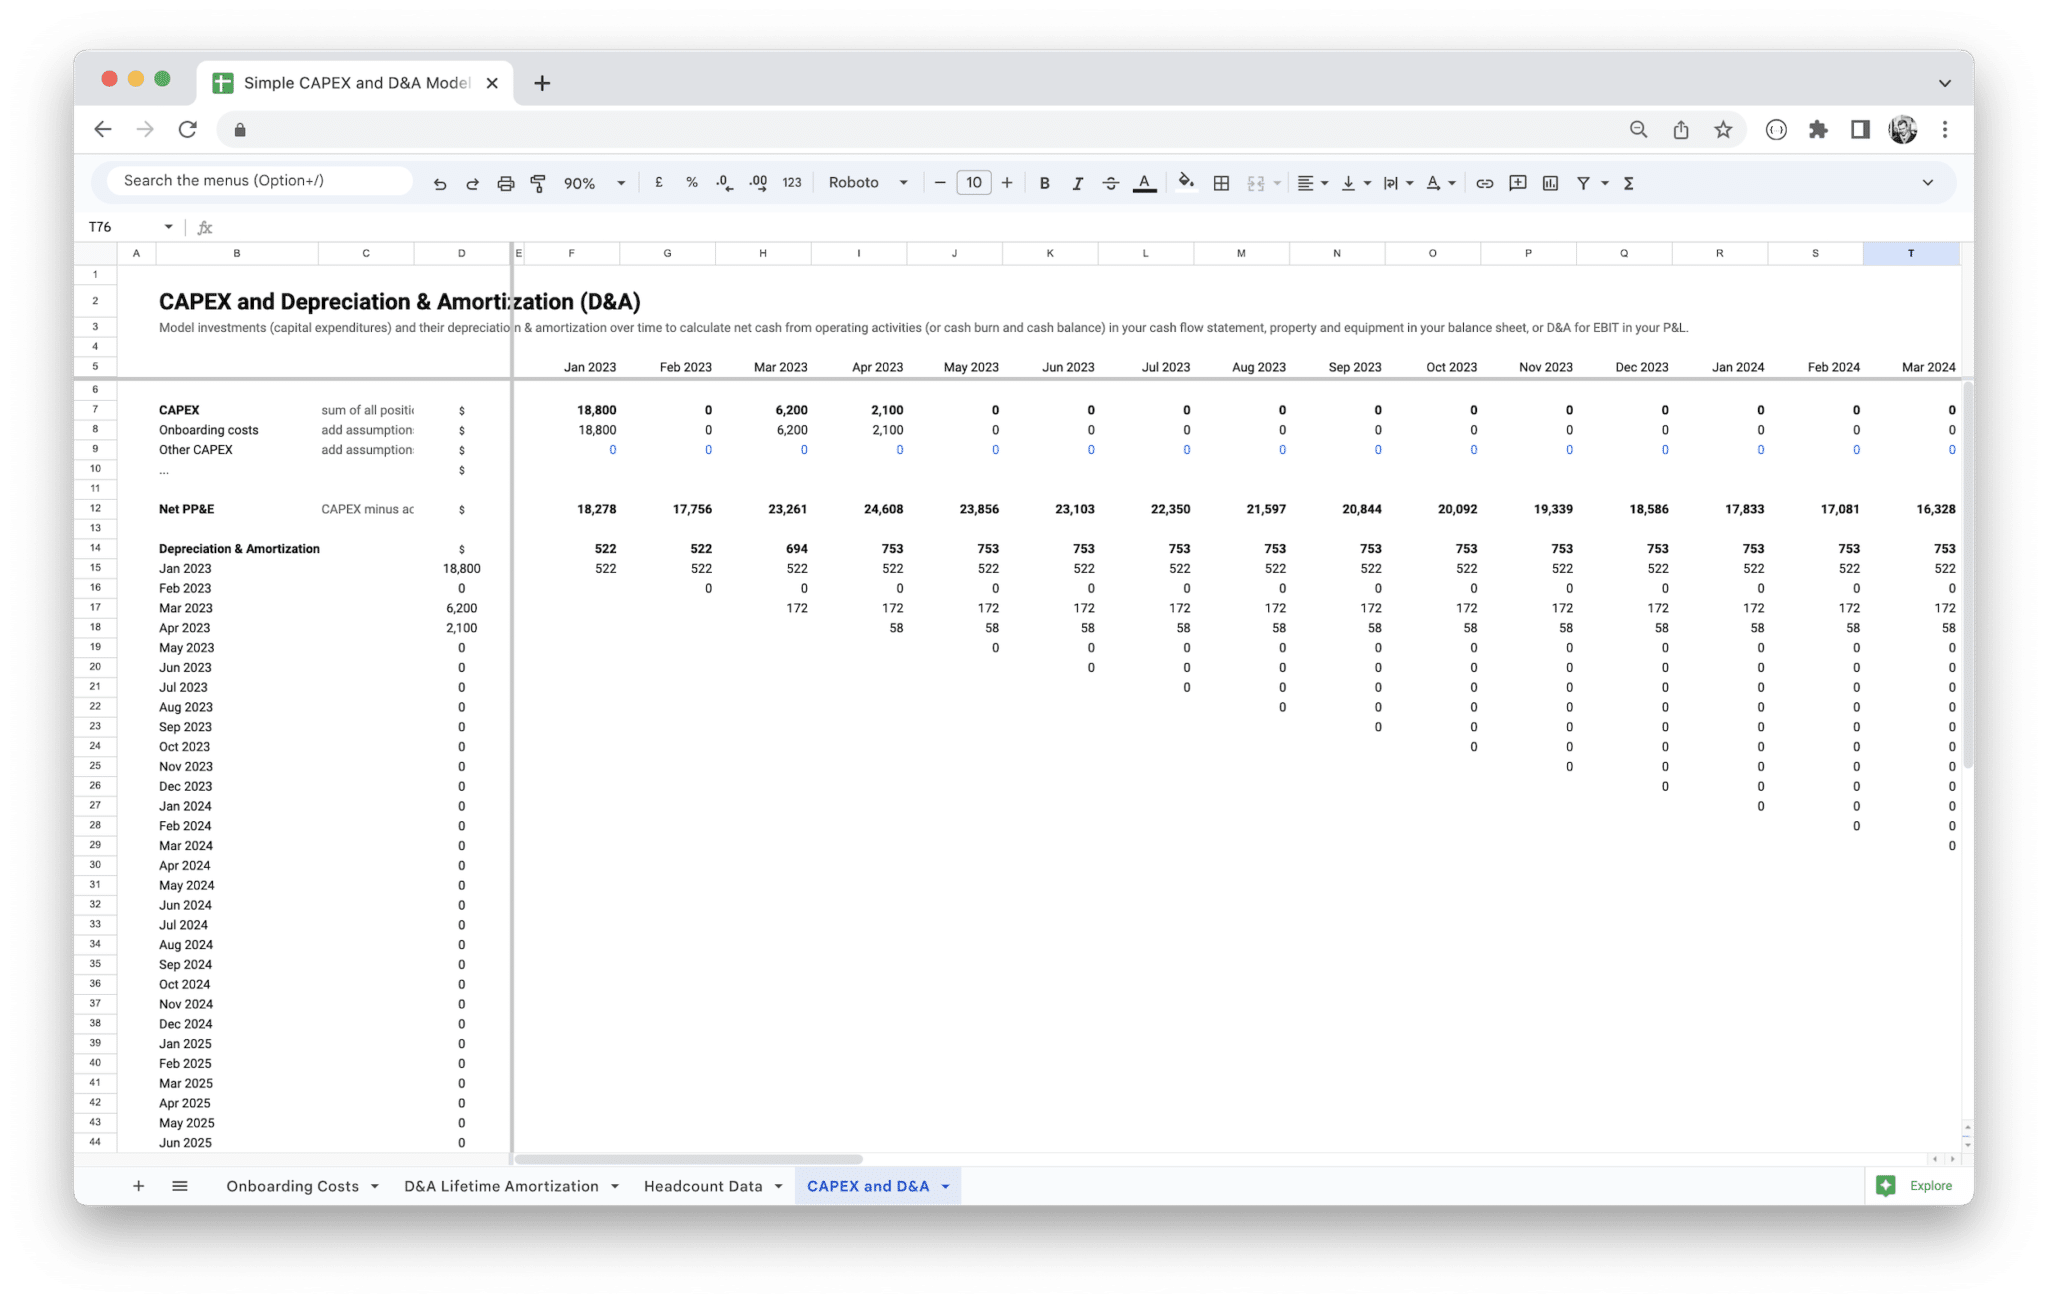
FreeCapital Expenditure Planning
Google Sheets capital expenditure planning workbook—four tabs (CAPEX and D&A, Onboarding Costs, Lifetime Amortization, Headcount Data). Build a coherent capex schedule and net PP&E story when capital planning is the bottleneck; graduate to our Standard or SaaS Financial Model when linked statements must sit on the same graph.
 Free
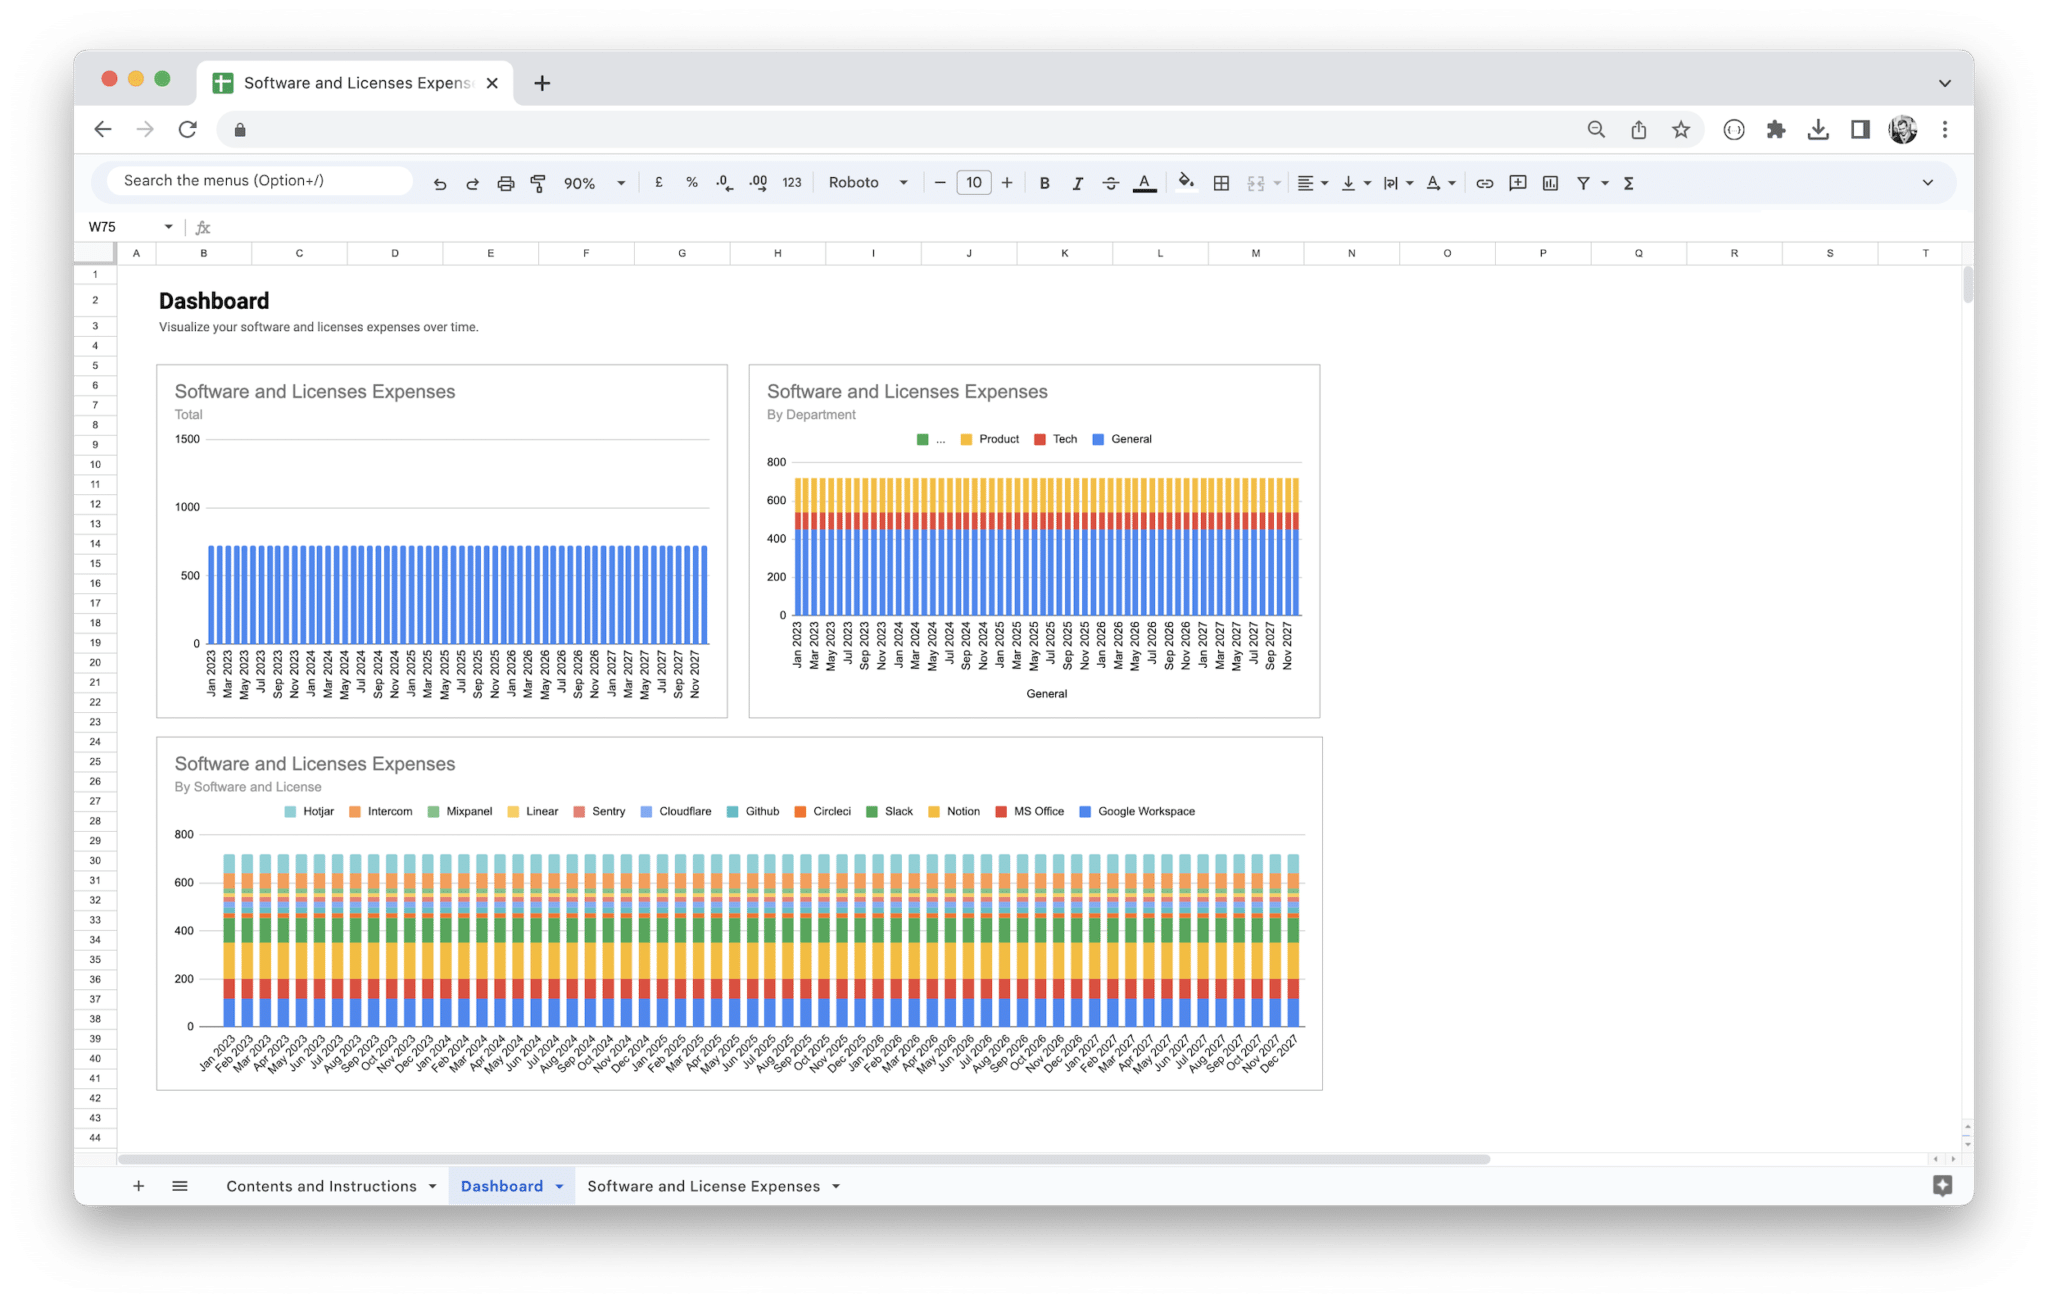
FreeSoftware License Management Tool
Google Sheets template for software license tracking and spend: plan renewals and categories on the Software and License Expenses tab, use headcount where the sheet links it, and review Dashboard charts from the same grid—three tabs, on-sheet instructions, no bundled P&L or balance sheet.
Workforce Planning Tool
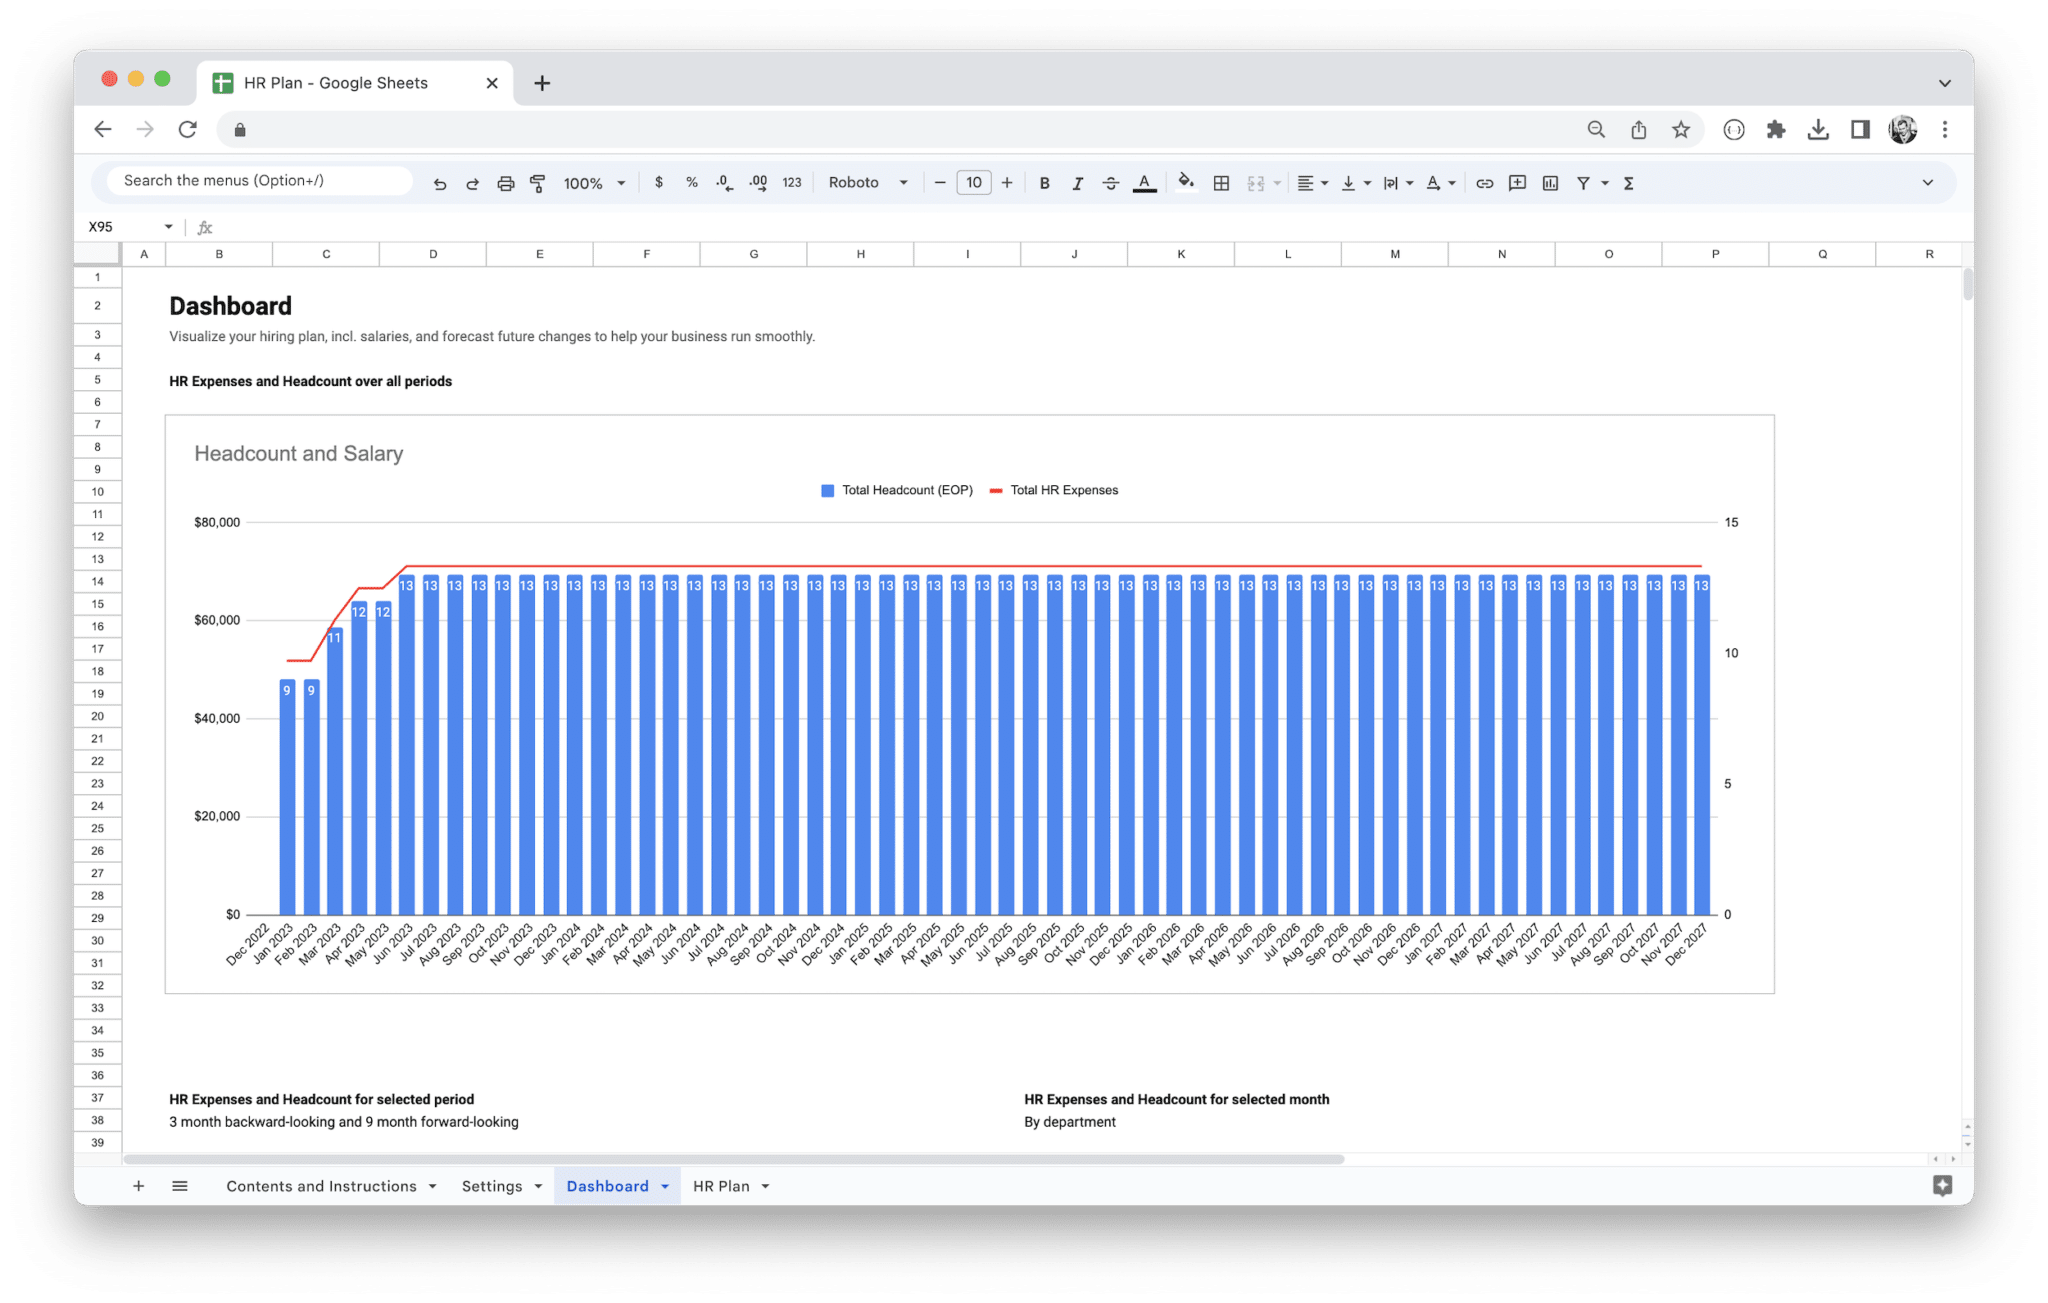
Plan department headcount and HR-style expenses in Google Sheets using two linked tabs: Headcount for team-level rows (for example Sales and Engineering, as labeled on-sheet) with a summary table by team, and Dashboard for charts titled Headcount and Expenses and Headcount or Expenses by Department. The dashboard reads the same monthly series and supports a three-month backward-looking and nine-month forward-looking window around the month you select, with views for HR Expenses and Headcount for selected period and by department—so HR and finance can brief leadership from one file before budgets, board cycles, re-org decisions, or hiring and staffing reviews. We ship a paid, maintained workbook—not a loose download you re-wire every planning cycle.
Analysis
Layouts for cohorts, unit economics, and comparisons—turn inputs into decisions with clear on-sheet structure.
 Free
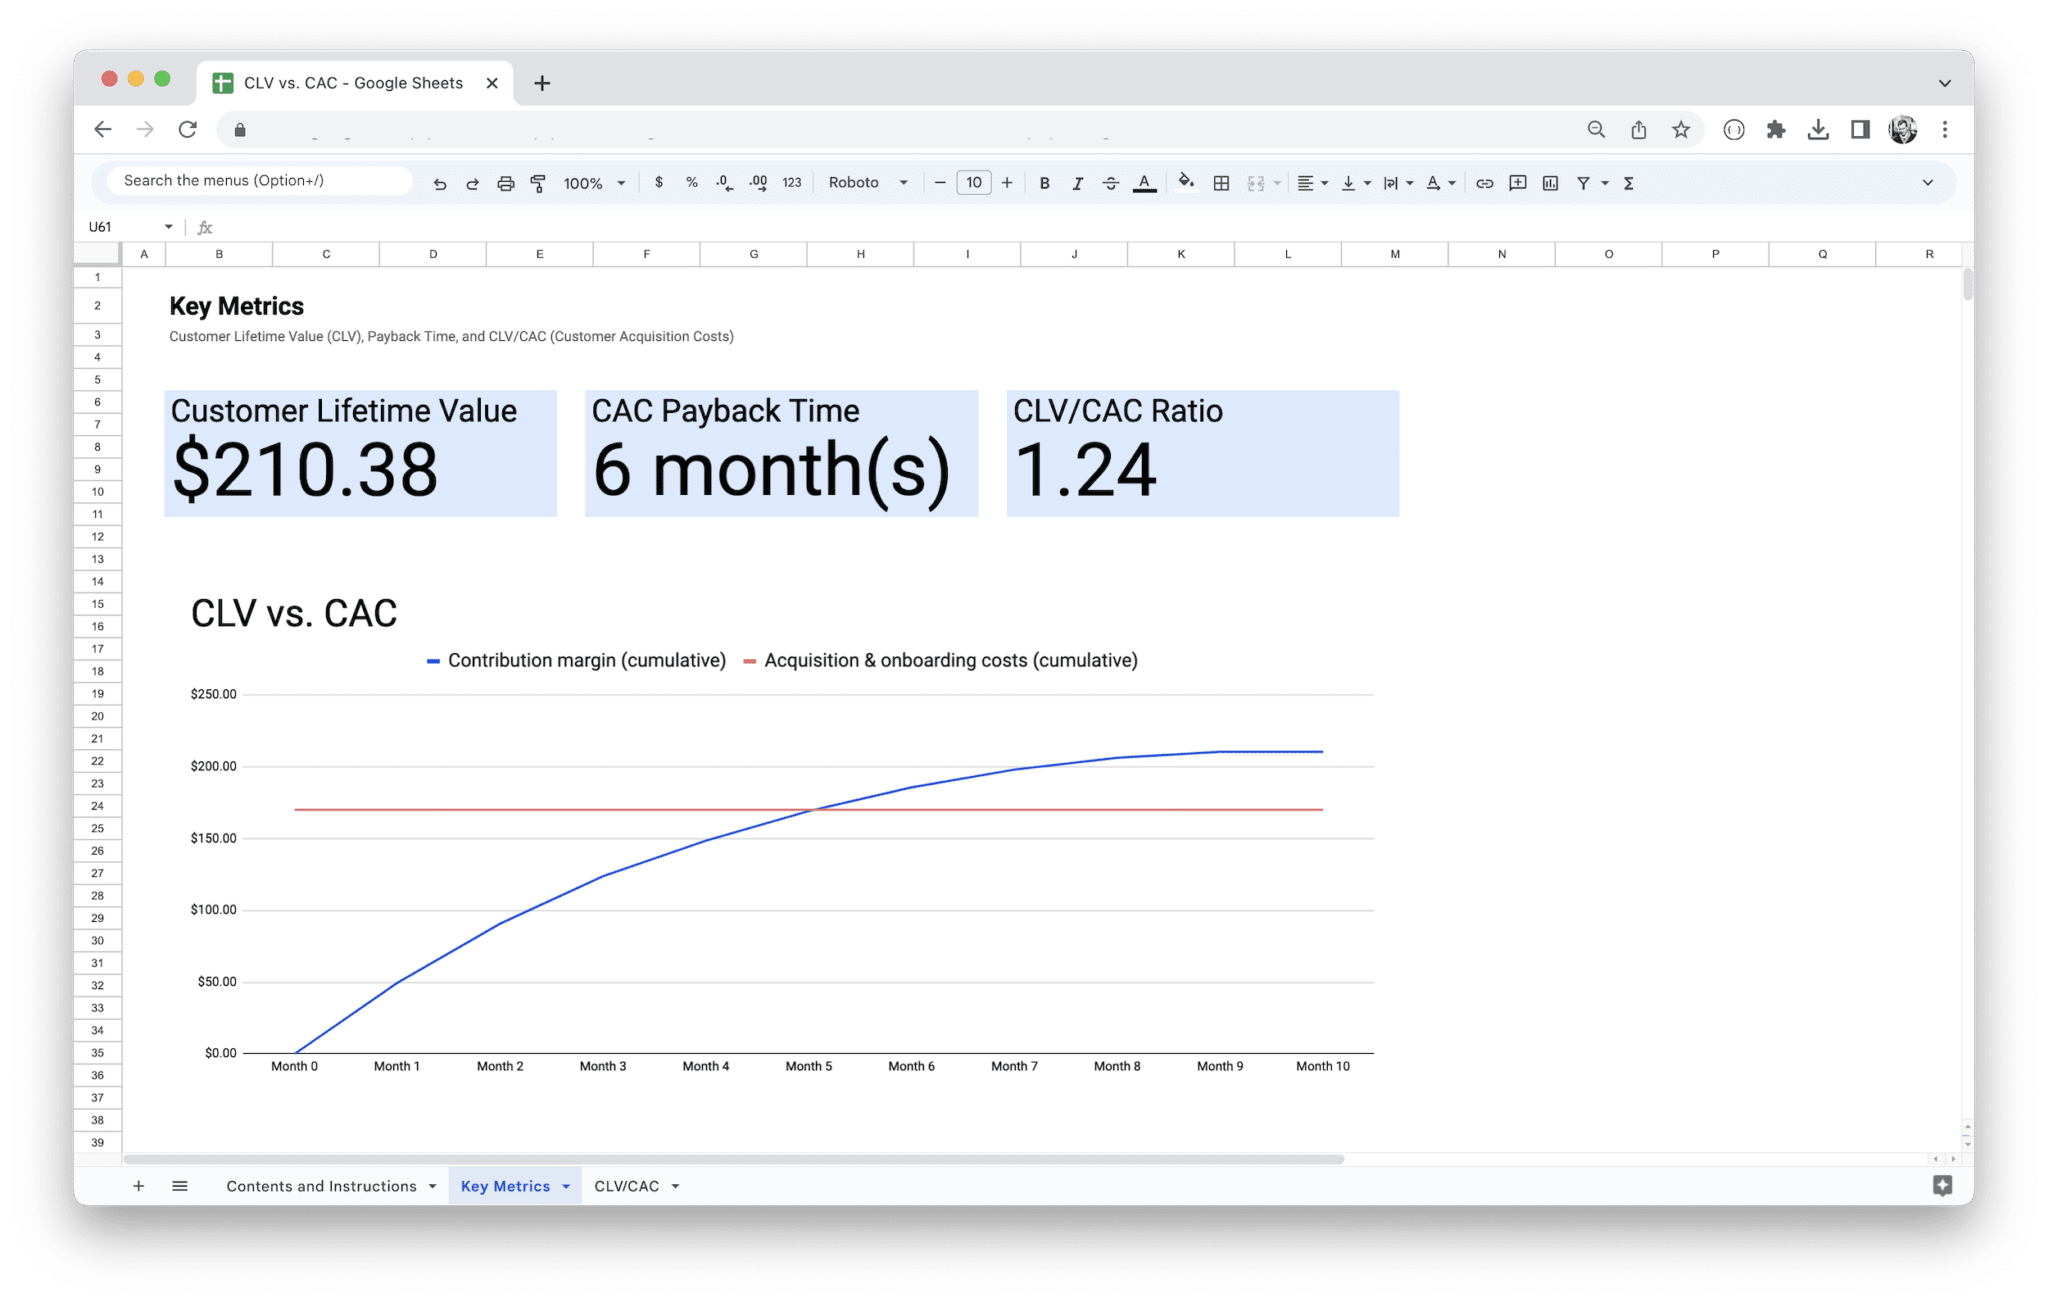
FreeCLV vs CAC Analysis
Boost your SaaS or subscription business profitability. Easily calculate customer lifetime value and acquisition costs to make data-driven decisions for marketing and sales strategies and optimize your ROI.
Cohort Analysis Template
Boost your subscription-based business with our Cohorts, Churn, and Retention Analysis Template. Calculate customer cohort retention and revenue, and track user retention for better insights and to gain a competitive edge!
Dashboards
KPI and subscription-health readouts designed to sit beside the tabs where your numbers are calculated.
 Free
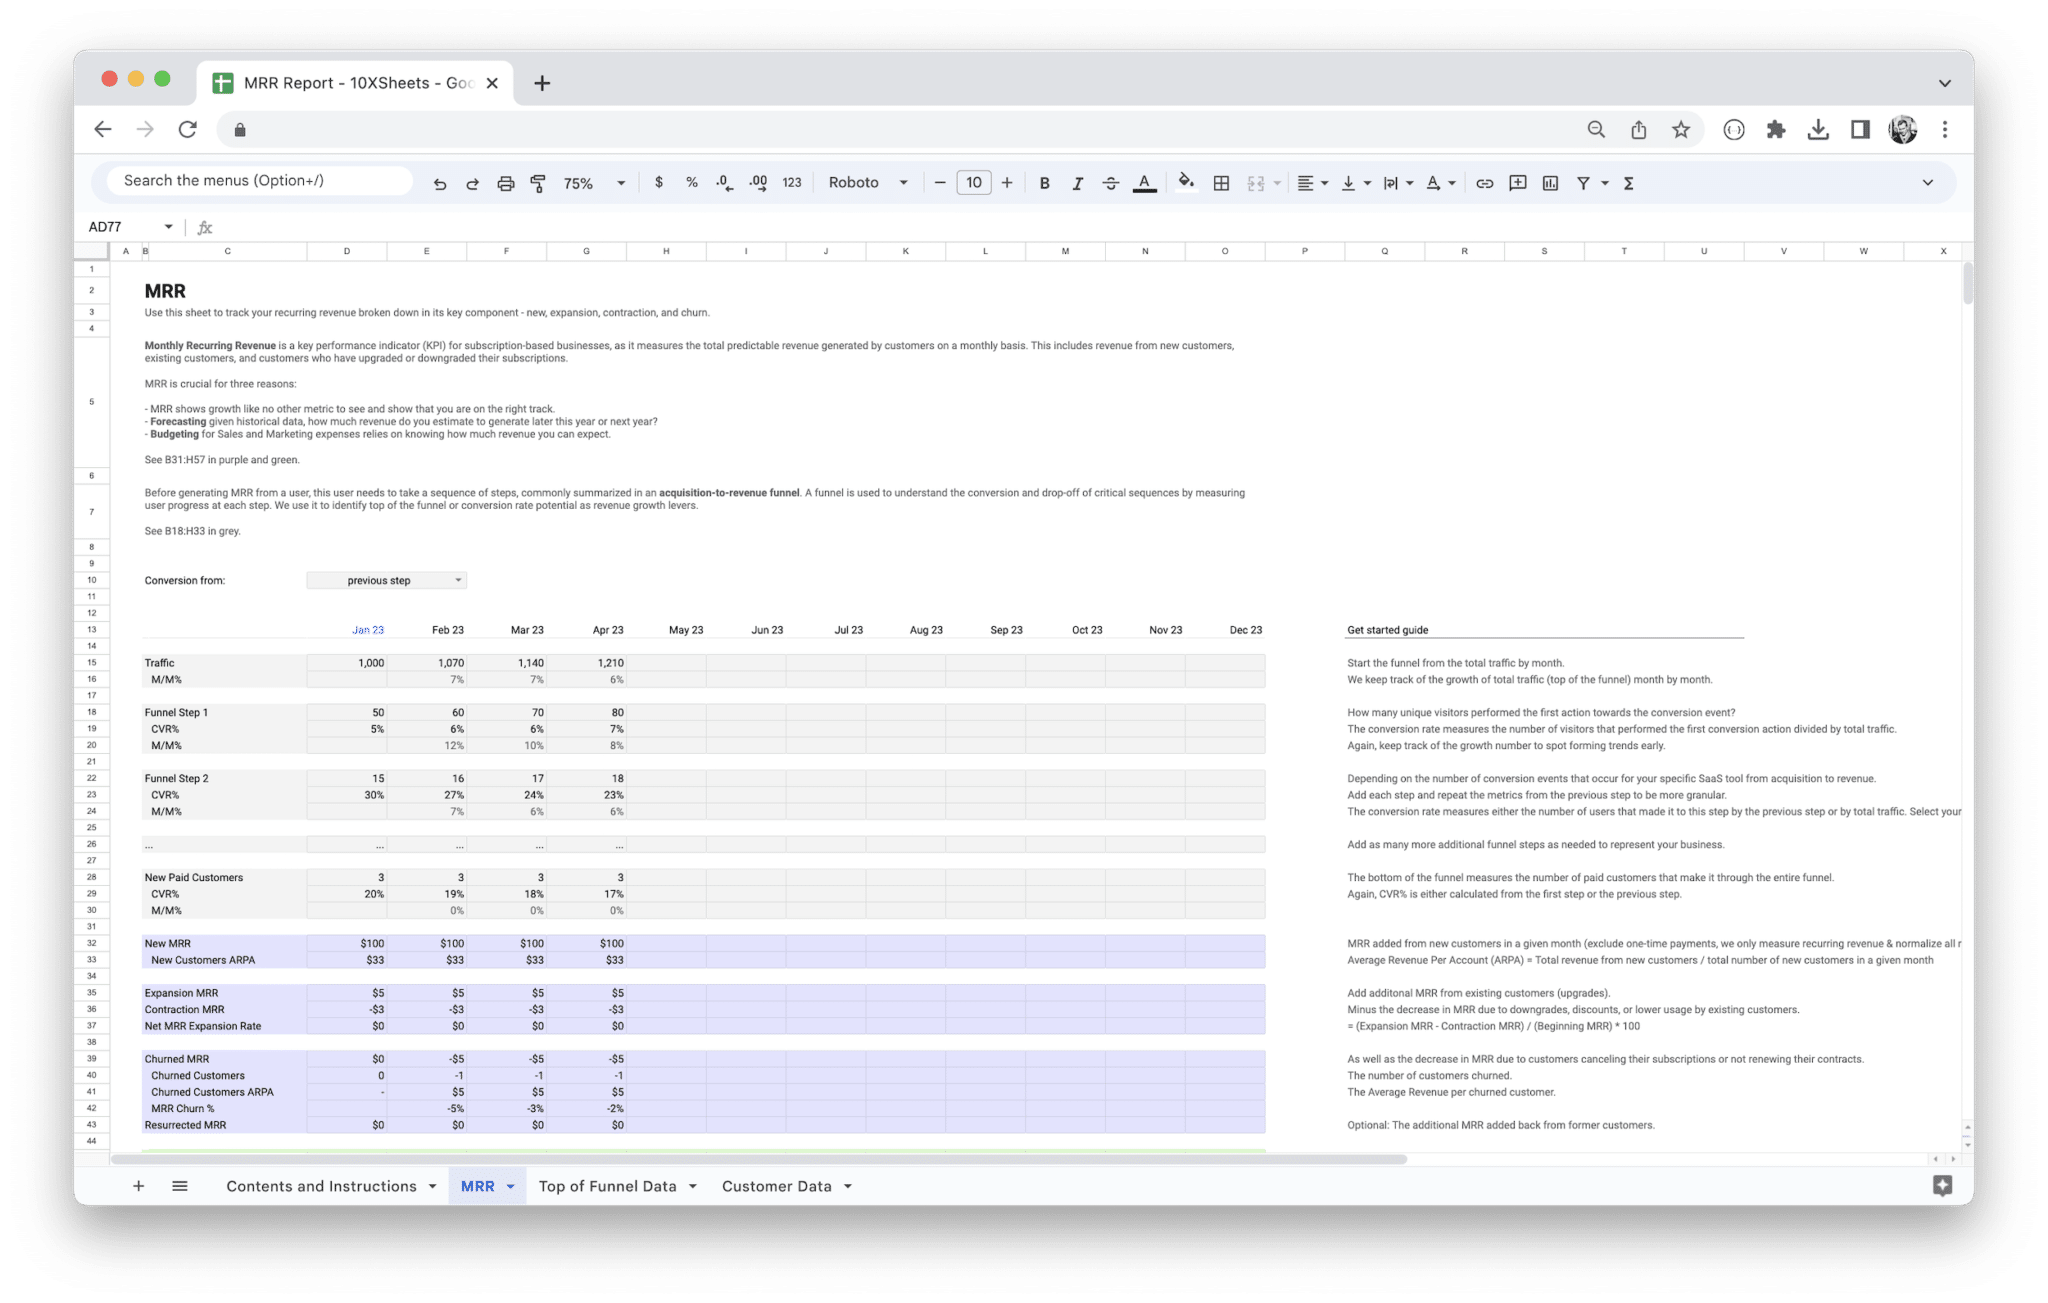
FreeMRR Dashboard
Take control of your business's growth with the MRR Reporting Template. Forecast your monthly recurring revenue, track your revenue streams, and make data-driven decisions. Integrate your payment provider and unlock powerful insights today!
 Free
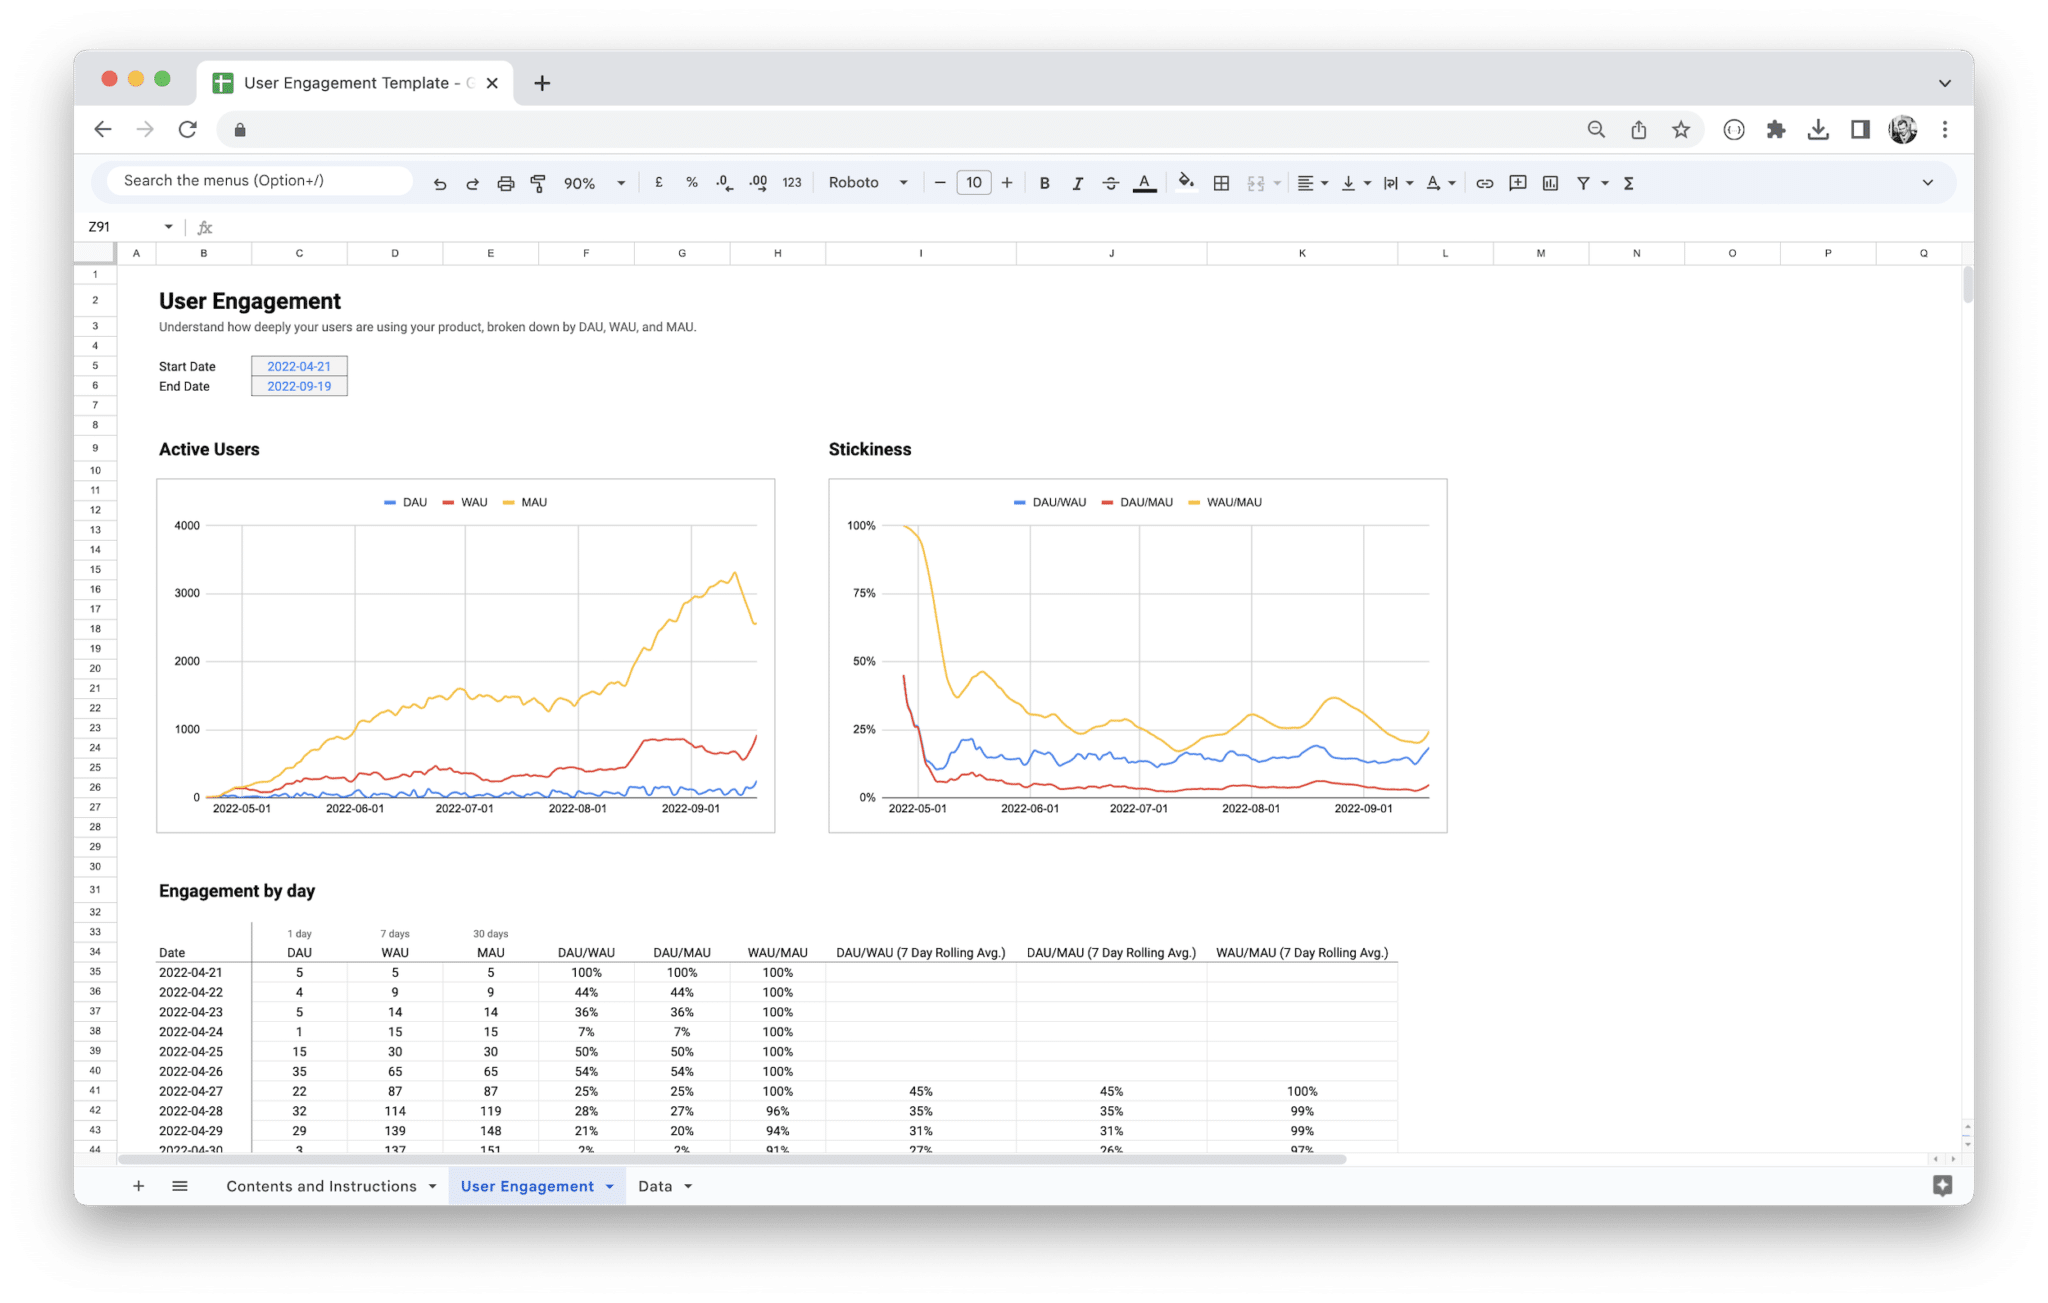
FreeUser Engagement Dashboard
Maximize your SaaS or subscription-based business. Keep track of user activity with daily, weekly, and monthly active user metrics based on event data to gain insights and improve user engagement!