- What is Vertical Analysis?
- Importance of Vertical Analysis in Financial Analysis
- Key Components of Vertical Analysis
- Understanding Financial Statements
- Vertical Analysis Methodology
- Vertical Analysis of Income Statement
- Vertical Analysis of Balance Sheet
- Vertical Analysis of Cash Flow Statement
- Interpreting Vertical Analysis Results
- Limitations and Considerations of Vertical Analysis
- Practical Applications of Vertical Analysis
- Advantages of Vertical Analysis over Horizontal Analysis
- Vertical Analysis Tools and Software
- Vertical Analysis Examples
- Tips for Effective Vertical Analysis
- Conclusion
Whether you’re an investor, business owner, or financial professional, understanding vertical analysis can help you make informed decisions and identify key trends within financial statements.
In this guide, we will explore the concept of vertical analysis, its purpose, and why it is crucial in financial analysis. We’ll dive into the methodology of vertical analysis and walk you through the step-by-step process of conducting a vertical analysis. By the end of this guide, you’ll be equipped with the knowledge to interpret vertical analysis results and apply them in practical scenarios.
What is Vertical Analysis?
Vertical analysis, also known as common-size analysis, is a financial analysis technique used to evaluate the relative proportions of different line items within a financial statement. It involves expressing each line item as a percentage of a base figure, typically taken as 100%. This approach allows for meaningful comparisons of line items over time or across companies, highlighting changes in the composition and structure of financial statements.
The purpose of vertical analysis is to provide insights into the distribution and significance of various components within a financial statement. By expressing line items as percentages, vertical analysis allows for a clearer understanding of the relative importance of different elements and helps identify trends, patterns, and potential areas of concern or opportunity.
Importance of Vertical Analysis in Financial Analysis
Vertical analysis plays a critical role in financial analysis for several reasons:
- Identifying Key Trends: By examining the percentage changes in line items over time, vertical analysis helps identify significant trends and patterns within financial statements. These trends can provide valuable insights into a company’s financial performance and prospects.
- Comparative Analysis: It enables meaningful comparisons between different companies or time periods, regardless of their size or scale of operations. By expressing line items as percentages, it allows for a fair comparison of financial structures and performance.
- Assessing Proportions and Relationships: It provides a comprehensive view of the proportions and relationships between line items within a financial statement. It helps evaluate the relative significance of various components and their impact on the overall financial picture.
- Identifying Areas of Strength and Weakness: By analyzing vertical percentages, financial analysts can identify areas of strength and weakness within a company’s financial statements. This information can be used to make informed decisions, set strategic priorities, and allocate resources effectively.
- Supporting Decision-Making: It assists in financial decision-making by providing insights into the financial implications of various options. Whether it’s assessing the impact of cost-cutting measures, evaluating pricing strategies, or analyzing investment opportunities, vertical analysis helps guide decision-making processes.
- Enhancing Communication: It facilitates effective communication of financial information. By expressing line items as percentages, complex financial statements are simplified and made more accessible to a wider audience, including stakeholders, investors, and non-financial professionals.
Overall, vertical analysis is a valuable tool in financial analysis, providing a deeper understanding of financial statements, supporting decision-making processes, and facilitating effective communication of financial information.
Key Components of Vertical Analysis
Vertical analysis involves several key components that are essential to its execution and interpretation. These components include:
- Base Figure: The base figure serves as the reference point for expressing all other line items as percentages. It is typically set at 100% and is used to establish a consistent framework for comparison.
- Line Items: Line items refer to the individual components within a financial statement that are being analyzed. These may include revenue categories, expense categories, asset types, liability categories, or equity components.
- Percentage Calculation: The calculation of percentages is a fundamental step in vertical analysis. It involves dividing the value of a specific line item by the base figure and multiplying the result by 100. This calculation yields the percentage representation of the line item.
- Interpretation of Results: Interpreting the results of vertical analysis is a critical component. It involves analyzing the percentage changes, identifying trends, patterns, and significant relationships between line items. The interpretation process allows for meaningful insights and informed decision-making.
- Comparative Analysis: Comparing vertical analysis results across different periods or with industry benchmarks is an important aspect of vertical analysis. This comparative analysis helps gauge the company’s performance, identify strengths and weaknesses, and assess its position relative to peers.
Understanding these key components is vital to the successful execution and interpretation of vertical analysis. By grasping the purpose, importance, and various components of vertical analysis, you can harness its full potential in financial analysis and decision-making.
Understanding Financial Statements
Before we delve into vertical analysis, let’s take a moment to understand the three primary financial statements: the income statement, the balance sheet, and the cash flow statement. These statements provide a comprehensive overview of a company’s financial performance, position, and cash flows.
The Income Statement
The income statement, also known as the profit and loss statement, reveals a company’s revenues, expenses, and net income over a specific period. It highlights the profitability of the business and helps assess its operational efficiency.
The Balance Sheet
The balance sheet provides a snapshot of a company’s financial position at a specific point in time. It presents the company’s assets, liabilities, and shareholders’ equity. The balance sheet helps evaluate the company’s liquidity, solvency, and overall financial health.
The Cash Flow Statement
The cash flow statement tracks the inflows and outflows of cash in a company during a given period. It categorizes cash flows into operating activities, investing activities, and financing activities. The cash flow statement is vital in assessing a company’s ability to generate cash and its cash management practices.
Accurate and reliable financial statements are essential for conducting effective vertical analysis. If the financial statements contain errors or are not prepared in accordance with accounting principles, the results of vertical analysis may be misleading. Therefore, it is crucial to ensure the integrity of the financial statements before performing vertical analysis.
Vertical Analysis Methodology
Vertical analysis, also known as common-size analysis, is a technique used to assess the relative proportions of different line items within a financial statement. It involves expressing each line item as a percentage of a base figure, typically taken as 100%. This allows for meaningful comparisons and identification of trends over time or across companies.
Let’s dive into the step-by-step process of conducting vertical analysis:
- Identifying the Base Figure: Choose a suitable base figure to express all other line items as percentages. The base figure is usually the total of a particular financial statement, such as total revenue for the income statement or total assets for the balance sheet.
- Calculating the Percentage for Each Line Item: Calculate the percentage that each line item represents in relation to the base figure. Divide the line item value by the base figure and multiply by 100 to obtain the percentage. The formula for calculating the percentage is as follows:Percentage = (Line Item Value / Base Figure) * 100
- Analyzing and Interpreting the Results: Once you have calculated the percentages for each line item, analyze and interpret the results. Look for significant changes in percentages over time or across companies. Identify trends, patterns, and potential areas of concern or opportunity within the financial statements.
Vertical Analysis of Income Statement
The income statement vertical analysis focuses on assessing the relative proportions of revenues and expenses. It helps identify the contribution of each revenue source and expense category to the overall financial performance of a company. Here are the key steps to perform vertical analysis on the income statement:
Exploring the Vertical Analysis of Revenue
Revenue is a crucial component of the income statement, as it represents the inflow of economic benefits from the sale of goods or services. By analyzing revenue through vertical analysis, you can gain insights into the revenue mix and the relative significance of different revenue streams. Key considerations include:
- Percentage of revenue from each product or service category.
- Revenue growth or decline over time.
- Comparison of revenue percentages across similar companies or industry benchmarks.
Analyzing Vertical Percentages for Various Expense Categories
Expenses on the income statement encompass a range of costs incurred in running a business. Vertical analysis allows you to understand the allocation of expenses and their impact on profitability. Consider the following when analyzing expense categories:
- Percentage of each expense category relative to total expenses.
- Changes in expense proportions over time.
- Comparisons of expense percentages with industry peers.
Understanding the Impact of Vertical Analysis on Profitability Evaluation
Vertical analysis of the income statement provides valuable insights into a company’s profitability. By examining the relationship between revenues and expenses as percentages of total revenue, you can evaluate profit margins and identify areas for improvement. Key points to consider include:
- Gross profit margin: The percentage of revenue remaining after deducting the cost of goods sold.
- Operating profit margin: The percentage of revenue remaining after deducting both the cost of goods sold and operating expenses.
- Net profit margin: The percentage of revenue remaining after deducting all expenses, including taxes and interest.
By analyzing these profitability ratios using vertical analysis, you can gauge a company’s financial performance and compare it to industry benchmarks or previous periods.
Vertical Analysis of Balance Sheet
The balance sheet vertical analysis involves examining the proportions of assets, liabilities, and shareholders’ equity. It provides insights into a company’s financial structure, leverage, and liquidity. Let’s explore the steps to conduct vertical analysis on the balance sheet:
Conducting Vertical Analysis on Assets
Assets represent the resources owned or controlled by a company. Vertical analysis helps assess the composition of assets and their significance in the overall financial position. Consider the following when analyzing asset categories:
- Current assets: The percentage of current assets relative to total assets.
- Non-current assets: The percentage of non-current assets, such as property, plant, and equipment, relative to total assets.
- Changes in asset proportions over time.
- Comparison of asset percentages with industry peers.
Analyzing Vertical Percentages for Liabilities and Equity
Liabilities and equity represent the sources of financing for a company’s assets. Vertical analysis enables you to understand the capital structure and financial obligations. Consider the following when analyzing liability and equity categories:
- Proportions of different liability categories, such as current liabilities and long-term debt, relative to total liabilities.
- Proportions of shareholders’ equity categories, such as retained earnings and common stock, relative to total equity.
- Changes in liability and equity proportions over time.
- Comparison of liability and equity percentages with industry peers.
Evaluating the Financial Health and Leverage of a Company through Vertical Analysis
Vertical analysis of the balance sheet provides insights into a company’s financial health and leverage. By examining the relationship between liabilities and equity as percentages of total assets, you can assess the level of debt and the proportion of equity financing. Key points to consider include:
- Debt-to-equity ratio: The percentage of debt relative to equity, indicating the level of leverage.
- Equity-to-assets ratio: The percentage of equity relative to total assets, indicating the extent of owner’s investment.
- Working capital ratio: The percentage of current assets relative to current liabilities, assessing short-term liquidity.
By analyzing these ratios using vertical analysis, you can evaluate a company’s financial position, leverage, and liquidity.
Vertical Analysis of Cash Flow Statement
The cash flow statement vertical analysis focuses on understanding the proportions of operating, investing, and financing activities. It helps assess the sources and uses of cash within a company. Let’s explore the steps to conduct vertical analysis on the cash flow statement:
Exploring the Vertical Analysis of Operating Cash Flows
Operating cash flows represent the cash generated or used in the day-to-day operations of a business. Vertical analysis allows you to understand the relative significance of operating cash flows and their impact on the company’s financial performance. Consider the following when analyzing operating cash flows:
- Percentage of operating cash flows relative to total cash flows.
- Changes in operating cash flow proportions over time.
- Comparison of operating cash flow percentages with industry peers.
Analyzing Vertical Percentages for Investing and Financing Activities
Investing and financing activities on the cash flow statement reflect the company’s capital investments and financing decisions. Vertical analysis helps assess the allocation of cash flows in these categories. Consider the following when analyzing investing and financing activities:
- Percentage of investing cash flows relative to total cash flows.
- Percentage of financing cash flows relative to total cash flows.
- Changes in investing and financing cash flow proportions over time.
- Comparison of investing and financing cash flow percentages with industry peers.
Understanding the Implications of Vertical Analysis on Cash Flow Management
Vertical analysis of the cash flow statement provides insights into a company’s cash management practices and capital allocation decisions. By examining the relationship between cash flows from different activities as percentages of total cash flows, you can assess the company’s cash flow position. Key points to consider include:
- Operating cash flow ratio: The percentage of operating cash flows relative to total cash flows, assessing the company’s ability to generate cash from core operations.
- Investing cash flow ratio: The percentage of investing cash flows relative to total cash flows, indicating the company’s capital investment decisions.
- Financing cash flow ratio: The percentage of financing cash flows relative to total cash flows, reflecting the company’s financing and capital structure.
By analyzing these ratios using vertical analysis, you can gain insights into a company’s cash flow management and capital allocation strategies.
Interpreting Vertical Analysis Results
Once you have conducted vertical analysis on financial statements, it’s crucial to interpret the results accurately. By analyzing the percentage changes and trends, you can draw meaningful conclusions and make informed decisions. Consider the following factors when interpreting vertical analysis results:
- Significance of Percentage Changes: Assess the magnitude and direction of percentage changes in line items. Positive or negative trends can indicate strengths or weaknesses within the company’s financial performance.
- Identifying Trends and Patterns: Look for consistent trends over time or across companies. Identify any recurring patterns that may shed light on the company’s financial performance and prospects.
- Relationship between Line Items and Base Figure: Analyze the relationship between each line item and the chosen base figure. Identify line items that have a substantial impact on the base figure and understand their significance within the financial statement.
- Comparing Vertical Analysis Results: Compare vertical analysis results across different periods or with industry benchmarks. This comparison allows you to gauge a company’s performance relative to its own historical data or industry peers.
Through careful interpretation of vertical analysis results, you can gain valuable insights into a company’s financial performance, strengths, and areas for improvement.
Limitations and Considerations of Vertical Analysis
While vertical analysis is a powerful tool, it is essential to be aware of its limitations and consider them when interpreting results. Here are some key limitations and considerations of vertical analysis:
- Comparative Analysis: Vertical analysis provides insights within a single financial statement but does not facilitate direct comparison between different financial statements. To gain a comprehensive understanding, consider using horizontal analysis or ratio analysis alongside vertical analysis.
- Changes in Base Figures: Altering the base figure can significantly impact the results of vertical analysis. It is crucial to choose an appropriate base figure that accurately reflects the company’s operations and goals.
- Industry-Specific Factors: Different industries have varying financial structures and norms. When comparing vertical analysis results, consider industry-specific factors that may influence the proportions of line items.
- Limited Context: Vertical analysis does not provide a complete context for a company’s financial performance. It should be used in conjunction with other analytical tools to obtain a holistic view.
It’s important to keep these limitations in mind and utilize complementary analysis methods to enhance the accuracy and depth of your financial assessments.
Practical Applications of Vertical Analysis
Vertical analysis has various practical applications in financial analysis and decision-making. Let’s explore some key scenarios where vertical analysis can be applied effectively:
Using Vertical Analysis for Benchmarking and Industry Comparisons
Vertical analysis allows you to benchmark a company’s financial performance against industry averages or leading competitors. By comparing the percentages of line items, you can identify areas of strength or weakness and gain insights into competitive positioning.
Applying Vertical Analysis to Evaluate Financial Performance and Efficiency
Vertical analysis helps assess a company’s financial performance and efficiency by examining the proportions of key line items. You can identify trends, analyze the impact of specific expenses or revenue sources, and evaluate profitability ratios using vertical analysis.
Utilizing Vertical Analysis in Decision-Making and Forecasting
Vertical analysis can guide decision-making processes by providing insights into the financial implications of various options. Whether you’re considering cost-cutting measures, pricing strategies, or investment decisions, vertical analysis helps evaluate the potential impact on key line items.
In addition, vertical analysis can aid in financial forecasting by projecting future trends based on historical data. By analyzing the percentages of line items, you can make informed predictions and support strategic planning.
By leveraging these practical applications, you can harness the power of vertical analysis to enhance financial decision-making and improve overall business performance.
Advantages of Vertical Analysis over Horizontal Analysis
While horizontal analysis focuses on changes in line items over time, vertical analysis offers unique advantages in financial analysis. Let’s explore some key benefits of vertical analysis compared to horizontal analysis:
- Identifying Proportional Changes: Vertical analysis allows you to assess the proportional changes in line items relative to a base figure. This provides a clearer understanding of the relative significance of different components within a financial statement.
- Comparing Companies of Different Sizes: Vertical analysis enables meaningful comparisons between companies of varying sizes. By expressing line items as percentages, you can compare the financial structures and performance of companies with different scales of operations.
- Spotting Trends and Patterns: Vertical analysis helps identify trends and patterns within financial statements. By analyzing the percentages of line items, you can spot consistent changes and assess their implications on a company’s financial performance.
- Enhancing Cross-Statement Analysis: Vertical analysis allows for effective analysis within a single financial statement. It provides insights into the relationship between line items and the base figure, enhancing cross-statement analysis and holistic understanding.
While horizontal analysis remains valuable for assessing changes over time, vertical analysis offers unique perspectives and granularity in financial analysis.
Vertical Analysis Tools and Software
Several tools and software can assist in performing vertical analysis efficiently. These tools automate calculations, generate visual representations of vertical analysis results, and provide additional analytical capabilities. Let’s explore some popular vertical analysis tools and their features:
- Financial Analysis Software: Comprehensive financial analysis software, such as Tableau or Microsoft Power BI, can be customized to perform vertical analysis. These tools enable data integration, automate calculations, and provide interactive dashboards for visualizing vertical analysis results.
- Spreadsheet Software: Widely used spreadsheet software like Microsoft Excel or Google Sheets offers built-in functions and formulas to perform vertical analysis. Using formulas like “= (Line Item Value / Base Figure) * 100,” you can calculate vertical percentages efficiently.
- Accounting Software: Some accounting software, like QuickBooks or Xero, may offer vertical analysis features as part of their reporting capabilities. These tools allow you to generate vertical analysis reports directly from the financial data within the software.
When selecting a vertical analysis tool or software, consider your specific needs, budget, and the level of automation and customization required.
Vertical Analysis Examples
To deepen your understanding of vertical analysis, let’s explore some practical examples that demonstrate its application in analyzing financial statements. These examples will showcase how vertical analysis can unveil valuable insights and aid in decision-making.
Example 1: Vertical Analysis of Income Statement
Let’s consider a hypothetical company, ABC Manufacturing, and examine its income statement using vertical analysis.
| Line Items | Amount ($) | Percentage |
|---|---|---|
| Revenue | 500,000 | 100% |
| Cost of Goods Sold | 300,000 | 60% |
| Gross Profit | 200,000 | 40% |
| Operating Expenses | 120,000 | 24% |
| Net Operating Income | 80,000 | 16% |
| Interest Expense | 10,000 | 2% |
| Net Income | 70,000 | 14% |
In this example, we have expressed each line item as a percentage of the revenue, which serves as the base figure. By doing so, we can analyze the proportions and relationships between different components of the income statement.
Insights from the vertical analysis of the income statement for ABC Manufacturing:
- The cost of goods sold accounts for 60% of the revenue, indicating the company’s direct production costs.
- Gross profit represents 40% of the revenue, indicating the profitability after deducting the cost of goods sold.
- Operating expenses account for 24% of the revenue, highlighting the costs associated with running the business.
- Net operating income represents 16% of the revenue, indicating the profitability from core operations.
- Interest expense represents 2% of the revenue, reflecting the cost of borrowing.
- Net income accounts for 14% of the revenue, indicating the company’s overall profitability after considering all expenses.
By examining these vertical percentages, analysts can evaluate the cost structure, profitability ratios, and the relative significance of different line items within the income statement.
Example 2: Vertical Analysis of Balance Sheet
Let’s continue our analysis of ABC Manufacturing by applying vertical analysis to its balance sheet.
| Line Items | Amount ($) | Percentage |
|---|---|---|
| Cash and Cash Equivalents | 50,000 | 10% |
| Accounts Receivable | 70,000 | 14% |
| Inventory | 120,000 | 24% |
| Total Current Assets | 240,000 | 48% |
| Property, Plant, Equipment (PPE) | 200,000 | 40% |
| Total Assets | 500,000 | 100% |
| Accounts Payable | 60,000 | 12% |
| Short-Term Debt | 40,000 | 8% |
| Total Current Liabilities | 100,000 | 20% |
| Long-Term Debt | 150,000 | 30% |
| Shareholders’ Equity | 250,000 | 50% |
| Total Liabilities & Equity | 500,000 | 100% |
In this example, we have expressed each line item as a percentage of the total assets, which serves as the base figure. This allows us to assess the proportions and relationships between different components of the balance sheet.
Insights from the vertical analysis of the balance sheet for ABC Manufacturing:
- Current assets represent 48% of the total assets, indicating the liquidity and short-term financial position of the company.
- Property, plant, and equipment (PPE) account for 40% of the total assets, reflecting the long-term investments made by the company.
- Total current liabilities represent 20% of the total liabilities and equity, showing the short-term obligations of the company.
- Long-term debt accounts for 30% of the total liabilities and equity, indicating the company’s long-term financing.
- Shareholders’ equity represents 50% of the total liabilities and equity, signifying the owners’ investment and retained earnings.
By analyzing these vertical percentages, financial analysts can gain insights into the asset structure, capital structure, and the relative significance of different components within the balance sheet.
These examples demonstrate how vertical analysis allows for meaningful comparisons, identification of trends, and assessment of the relative proportions and relationships within financial statements. By applying vertical analysis to real-world scenarios, you can unlock valuable insights and make informed decisions based on the financial health and performance of a company.
Tips for Effective Vertical Analysis
To maximize the effectiveness of vertical analysis, consider the following tips and best practices:
- Choose an Appropriate Base Figure: Select a base figure that accurately reflects the context and purpose of your analysis. Ensure the chosen base figure is meaningful and aligns with the objective of your assessment.
- Maintain Consistency: Maintain consistency in your analysis by using consistent time periods, data sources, and accounting principles. This allows for accurate comparisons and trend analysis.
- Validate the Integrity of Financial Statements: Before conducting vertical analysis, verify the accuracy and reliability of the financial statements. Ensure the statements are prepared in accordance with accounting principles and do not contain errors or discrepancies.
- Use Supplementary Analysis Methods: Vertical analysis provides valuable insights but should be complemented with other analytical methods. Incorporate horizontal analysis, ratio analysis, and qualitative assessment to obtain a comprehensive view of a company’s financial performance.
- Consider Industry-specific Factors: Take into account industry-specific factors when interpreting vertical analysis results. Understand the unique characteristics and benchmarks within the industry to draw meaningful conclusions.
By following these tips, you can enhance the accuracy and effectiveness of your vertical analysis and make informed financial assessments.
Conclusion
Vertical analysis is a powerful technique that allows you to analyze financial statements in a meaningful and comparative way. By expressing line items as percentages of a base figure, you can identify trends, assess proportions, and gain valuable insights into a company’s financial performance.
In this guide, we explored the methodology of vertical analysis, walked through the steps to perform vertical analysis on income statements, balance sheets, and cash flow statements. We discussed how to interpret the results, considered limitations, and highlighted practical applications.
Armed with the knowledge and understanding gained from this guide, you can confidently apply vertical analysis in your financial analysis endeavors. Remember to choose appropriate base figures, maintain consistency, and consider industry-specific factors to enhance the accuracy and relevance of your analysis.
Vertical analysis, when combined with other analytical methods, empowers you to make informed decisions, evaluate financial performance, and drive business success. Embrace the power of vertical analysis and unlock deeper insights into financial statements like a true expert.
Get Started With a Prebuilt Template!
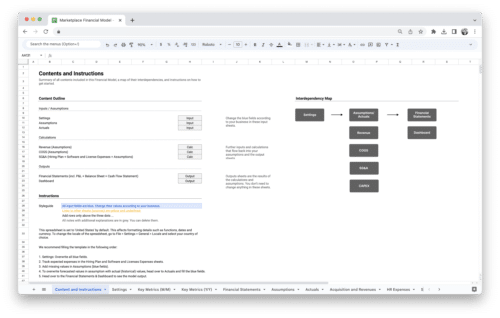
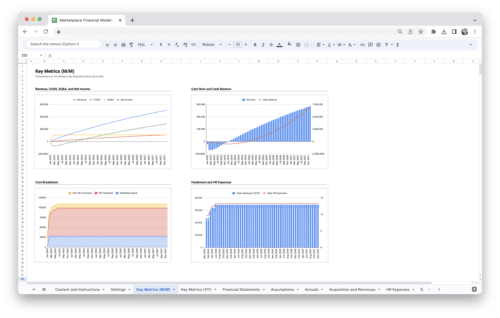
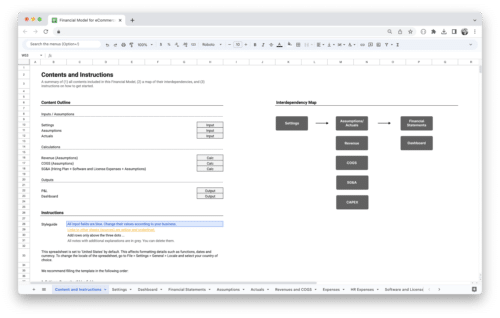
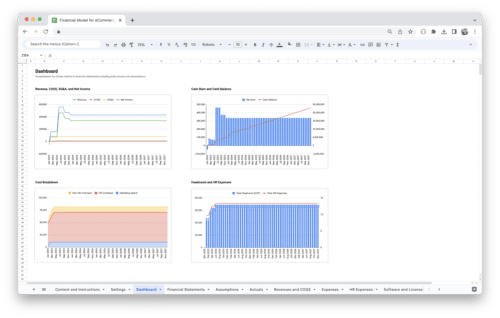
Looking to streamline your business financial modeling process with a prebuilt customizable template? Say goodbye to the hassle of building a financial model from scratch and get started right away with one of our premium templates.
- Save time with no need to create a financial model from scratch.
- Reduce errors with prebuilt formulas and calculations.
- Customize to your needs by adding/deleting sections and adjusting formulas.
- Automatically calculate key metrics for valuable insights.
- Make informed decisions about your strategy and goals with a clear picture of your business performance and financial health.

