Have you ever wondered what makes some sales teams incredibly successful while others struggle to meet their targets? Understanding and effectively utilizing sales metrics is the secret sauce behind high-performing sales organizations. In today’s competitive business landscape, sales metrics serve as the compass that guides businesses toward greater revenue growth and profitability. By tracking and analyzing key performance indicators (KPIs) such as revenue, sales growth rate, customer acquisition cost, and more, businesses gain valuable insights into their sales performance, identify areas for improvement, and make data-driven decisions to optimize their sales strategies.
Whether you’re a seasoned sales professional or just starting in the field, mastering the art of sales metrics is essential for driving success and achieving your business goals. In this guide, we’ll delve into the top sales metrics, explore their significance, and provide actionable tips for tracking and leveraging them to supercharge your sales performance.
What are Sales Metrics?
Sales metrics, also known as key performance indicators (KPIs), are quantitative measures used to evaluate and assess the performance of sales teams, processes, and strategies. These metrics provide valuable insights into various aspects of the sales process, helping businesses understand their sales performance, identify areas for improvement, and make data-driven decisions to optimize sales effectiveness and drive revenue growth.
Sales metrics encompass a wide range of performance indicators, including but not limited to revenue, sales growth rate, customer acquisition cost (CAC), customer lifetime value (CLV), sales conversion rate, average deal size, sales velocity, churn rate, pipeline coverage ratio, and more. By tracking and analyzing these metrics, businesses can gain a comprehensive understanding of their sales performance and take proactive steps to enhance sales outcomes.
Importance of Tracking Sales Metrics for Business Success
- Performance Evaluation: Tracking sales metrics allows businesses to evaluate the performance of their sales teams and individuals objectively. By measuring performance against predefined targets and benchmarks, businesses can identify top performers, areas for improvement, and training needs.
- Identifying Trends and Patterns: Sales metrics provide valuable insights into trends and patterns in customer behavior, market dynamics, and sales performance over time. By analyzing historical data, businesses can identify emerging trends, market opportunities, and potential threats, allowing them to adjust their sales strategies accordingly.
- Optimizing Sales Processes: By tracking sales metrics, businesses can identify bottlenecks, inefficiencies, and areas of friction in their sales processes. This enables them to streamline processes, eliminate unnecessary steps, and optimize workflows to improve overall sales efficiency and productivity.
- Forecasting and Planning: Sales metrics play a crucial role in sales forecasting and planning. By analyzing historical sales data and performance metrics, businesses can forecast future sales trends, set realistic sales targets, and allocate resources effectively to achieve their sales objectives.
- Driving Continuous Improvement: Continuous improvement is essential for long-term business success. By tracking sales metrics, businesses can identify areas for improvement, implement targeted interventions, and measure the impact of these initiatives over time. This iterative process of improvement enables businesses to stay competitive and adapt to changing market conditions.
- Enhancing Customer Satisfaction: Sales metrics such as customer satisfaction scores and retention rates provide valuable insights into customer sentiment and loyalty. By tracking these metrics, businesses can identify areas where customer satisfaction is lacking, address customer concerns proactively, and enhance the overall customer experience.
By tracking sales metrics effectively, businesses can gain actionable insights into their sales performance, optimize sales processes, and drive business success in today’s competitive marketplace.
Sales KPIs and Metrics
In the realm of sales, Key Performance Indicators (KPIs) serve as vital signposts that help gauge the health and effectiveness of your sales efforts. Understanding these metrics is crucial for driving informed decisions and optimizing your sales strategy for success.
What Are Sales KPIs?
Key Performance Indicators (KPIs) are measurable values that demonstrate how effectively a company is achieving its key business objectives. In sales, KPIs provide actionable insights into various aspects of the sales process, allowing businesses to monitor performance, identify areas for improvement, and make data-driven decisions to enhance sales outcomes.
Common KPIs Used in Sales Tracking
- Revenue: Revenue is the total income generated from sales activities within a specific period. It’s a fundamental metric that indicates the financial health and success of your business.Formula: Revenue = Total SalesExample: If your company generated $500,000 in sales revenue last quarter, your revenue for that period would be $500,000.
- Sales Growth Rate: Sales growth rate measures the percentage increase or decrease in sales over a specific period, typically month-over-month or year-over-year.Formula: Sales Growth Rate = [(Current Period Sales – Previous Period Sales) / Previous Period Sales] * 100Example: If your sales were $100,000 last month and $120,000 this month, your sales growth rate would be (($120,000 – $100,000) / $100,000) * 100 = 20%.
- Customer Acquisition Cost (CAC): Customer Acquisition Cost refers to the average cost incurred to acquire a new customer. It encompasses expenses related to marketing, sales, and other customer acquisition efforts.Formula: CAC = (Total Sales and Marketing Expenses) / Number of New Customers AcquiredExample: If your company spent $50,000 on sales and marketing activities last quarter and acquired 100 new customers, the CAC would be $50,000 / 100 = $500 per customer.
- Customer Lifetime Value (CLV): Customer Lifetime Value represents the total revenue a customer is expected to generate throughout their entire relationship with your business. It helps assess the long-term value of acquiring and retaining customers.Formula: CLV = Average Purchase Value * Average Purchase Frequency * Customer LifespanExample: If the average purchase value is $100, the average purchase frequency is 5 times per year, and the average customer lifespan is 5 years, the CLV would be $100 * 5 * 5 = $2,500.
- Sales Conversion Rate: Sales conversion rate measures the percentage of leads or prospects that result in a successful sale. It indicates the effectiveness of your sales efforts in converting leads into customers.Formula: Conversion Rate = (Number of Conversions / Total Number of Leads) * 100Example: If you had 500 leads and 50 of them converted into customers, the conversion rate would be (50 / 500) * 100 = 10%.
- Average Deal Size: Average deal size refers to the average value of each sales deal closed by your team. It helps assess the typical value of your sales transactions.Formula: Average Deal Size = Total Sales Revenue / Number of Deals ClosedExample: If your team closed 50 deals last month, generating a total revenue of $250,000, the average deal size would be $250,000 / 50 = $5,000.
- Sales Velocity: Sales velocity measures the rate at which deals move through your sales pipeline, from initial contact to closing. It helps identify bottlenecks and inefficiencies in the sales process.Formula: Sales Velocity = (Number of Opportunities * Average Deal Value * Win Rate) / Sales Cycle LengthExample: If you have 100 opportunities in your pipeline, with an average deal value of $10,000, a win rate of 20%, and a sales cycle length of 60 days, the sales velocity would be (100 * $10,000 * 0.20) / 60 = $3,333 per day.
- Churn Rate: Churn rate measures the percentage of customers who stop using your product or service over a specific period. It’s crucial for assessing customer retention and loyalty.Formula: Churn Rate = (Number of Customers Lost / Total Number of Customers at the Beginning of the Period) * 100Example: If you had 500 customers at the beginning of the quarter and lost 50 of them during that period, the churn rate would be (50 / 500) * 100 = 10%.
- Pipeline Coverage Ratio: Pipeline coverage ratio evaluates the health and potential success of your sales pipeline by comparing the value of deals in the pipeline to your sales target.Formula: Pipeline Coverage Ratio = (Value of Opportunities in Pipeline / Sales Target) * 100Example: If your sales target for the quarter is $1,000,000 and the total value of opportunities in your pipeline is $500,000, the pipeline coverage ratio would be ($500,000 / $1,000,000) * 100 = 50%.
Lead Generation Metrics
When it comes to driving sales growth, effective lead generation is key. Understanding and tracking lead generation metrics is essential for assessing the performance of your lead generation efforts and optimizing your strategies to attract and convert prospects into customers.
Understanding Lead Generation Metrics
Lead generation metrics provide insights into the effectiveness of your marketing and sales efforts in generating leads and converting them into opportunities. By analyzing these metrics, you can identify which channels and tactics are most successful in attracting and nurturing leads, allowing you to allocate resources more efficiently and improve overall conversion rates.
Essential Lead Generation Metrics to Track
- Lead Conversion Rate: Lead conversion rate measures the percentage of leads that successfully convert into customers. It provides valuable insights into the effectiveness of your lead nurturing and sales processes.Formula: Lead Conversion Rate = (Number of Converted Leads / Total Number of Leads) * 100Example: If you generated 500 leads last month and 50 of them became customers, your lead conversion rate would be (50 / 500) * 100 = 10%.
- Lead Quality: Lead quality refers to the likelihood that a lead will convert into a paying customer based on their characteristics, behavior, and level of engagement. It’s essential to assess lead quality to prioritize and focus efforts on leads with the highest potential for conversion.Metrics to consider for evaluating lead quality:
- Demographic information
- Firmographics (for B2B leads)
- Engagement level (e.g., website visits, email opens, content downloads)
- Fit with ideal customer profile (ICP)
- Cost per Lead (CPL): Cost per Lead (CPL) measures the average cost incurred to acquire a new lead through marketing and sales efforts. Understanding CPL helps assess the efficiency and effectiveness of your lead generation campaigns and budget allocation.Formula: CPL = Total Marketing and Sales Expenses / Number of Leads GeneratedExample: If you spent $10,000 on marketing and sales activities last quarter and generated 500 leads, your CPL would be $10,000 / 500 = $20 per lead.
- Lead-to-Opportunity Ratio: Lead-to-Opportunity Ratio measures the effectiveness of your lead qualification process in converting leads into sales opportunities. A higher ratio indicates a more efficient and successful lead qualification process.Formula: Lead-to-Opportunity Ratio = (Number of Qualified Opportunities / Total Number of Leads) * 100Example: If you qualified 100 leads out of 500 generated last month, your lead-to-opportunity ratio would be (100 / 500) * 100 = 20%.
By tracking and analyzing these essential lead generation metrics, you can gain valuable insights into the performance of your lead generation efforts and make data-driven decisions to optimize your strategies for better results.
Sales Productivity Metrics
In the dynamic world of sales, productivity is a critical factor in driving success. Sales productivity metrics provide valuable insights into the efficiency and effectiveness of your sales team, helping you identify areas for improvement and optimize performance for greater revenue generation.
Importance of Sales Productivity Metrics
Sales productivity metrics play a pivotal role in assessing the efficiency and effectiveness of your sales team’s efforts. By measuring key productivity metrics, you can identify bottlenecks, streamline processes, and empower your team to achieve better results. These metrics also help in resource allocation, sales forecasting, and performance evaluation, ultimately contributing to the overall success of your sales organization.
Key Sales Productivity Metrics to Monitor
- Sales Activities per Rep: This metric measures the number of sales-related activities performed by each sales representative within a given period. Activities may include calls made, emails sent, meetings conducted, or presentations delivered. Tracking sales activities per rep provides insights into individual productivity levels and helps identify top performers.Example: If a sales representative makes 50 calls, sends 30 emails, and conducts 10 meetings in a week, their total sales activities would be 90.
- Time to Close: Time to close measures the average duration it takes to close a deal from the initial contact with a prospect to the final sale. Monitoring this metric helps identify inefficiencies in the sales process and enables sales teams to optimize their strategies for faster deal closure.Example: If the average time to close a deal is 30 days, it indicates that, on average, it takes 30 days from the first interaction with a prospect to finalize the sale.
- Sales Cycle Length: Sales cycle length refers to the average duration of the sales cycle, from the initial contact with a prospect to the closing of the deal. Understanding the sales cycle length helps sales teams forecast revenue, allocate resources effectively, and identify opportunities to shorten the sales cycle.Example: If the average sales cycle length is 60 days, it means that, on average, it takes 60 days to convert a lead into a customer.
- Opportunity Win Rate: Opportunity win rate measures the percentage of sales opportunities that result in a successful deal closure. Tracking this metric helps evaluate the effectiveness of your sales strategy, identify areas for improvement, and forecast future revenue accurately.Formula: Opportunity Win Rate = (Number of Won Opportunities / Total Number of Opportunities) * 100Example: If your sales team won 20 out of 100 opportunities, the opportunity win rate would be (20 / 100) * 100 = 20%.
By monitoring these key sales productivity metrics, you can gain actionable insights into your sales team’s performance, identify areas for improvement, and implement strategies to enhance productivity and drive revenue growth.
Customer Satisfaction Metrics
Ensuring customer satisfaction is paramount for the success and growth of any business. Customer satisfaction metrics provide valuable insights into how well your products or services meet customer expectations and how likely they are to remain loyal and advocate for your brand.
Significance of Customer Satisfaction Metrics in Sales
Customer satisfaction metrics play a crucial role in driving sales and revenue growth. Satisfied customers are more likely to make repeat purchases, refer others to your business, and become loyal advocates for your brand. By measuring and monitoring customer satisfaction metrics, you can identify areas for improvement, address customer concerns, and cultivate long-term relationships with your customer base, ultimately leading to increased sales and business success.
Essential Customer Satisfaction Metrics to Measure
- Net Promoter Score (NPS): NPS is a widely used metric that measures customer loyalty and satisfaction by asking customers how likely they are to recommend your product or service to others. Customers are classified into Promoters, Passives, or Detractors based on their responses, allowing you to gauge overall customer sentiment and identify areas for improvement.Formula: NPS = % of Promoters – % of DetractorsExample: If 40% of customers are Promoters, 30% are Passives, and 30% are Detractors, the NPS would be 40 – 30 = 10.
- Customer Satisfaction (CSAT) Score: CSAT score measures customer satisfaction with a specific product, service, or interaction. Customers are asked to rate their satisfaction on a scale (e.g., 1-5 or 1-10), and the average score is calculated to determine overall satisfaction levels.Formula: CSAT Score = (Sum of Satisfaction Ratings / Total Number of Responses) * 100Example: If you received satisfaction ratings of 4, 5, 3, 4, and 5 from five customers, the CSAT score would be ((4 + 5 + 3 + 4 + 5) / 5) * 100 = 84%.
- Customer Retention Rate: Customer retention rate measures the percentage of customers who continue to use your product or service over a specific period. It indicates the effectiveness of your customer service, product quality, and overall customer experience in fostering loyalty and repeat business.Formula: Customer Retention Rate = ((Number of Customers at the End of the Period – Number of New Customers Acquired) / Number of Customers at the Start of the Period) * 100Example: If you had 500 customers at the beginning of the quarter, acquired 50 new customers during that period, and ended with 480 customers, the retention rate would be ((480 – 50) / 500) * 100 = 86%.
By tracking these essential customer satisfaction metrics, you can gain valuable insights into the overall satisfaction levels of your customer base, identify areas for improvement, and implement strategies to enhance customer loyalty and drive sales growth.
Sales Team Performance Metrics
Assessing the performance of your sales team is essential for achieving organizational goals and driving revenue growth. By evaluating key sales team performance metrics, you can identify areas of strength, pinpoint areas for improvement, and provide targeted coaching and support to your sales representatives.
Evaluating Sales Team Performance Metrics
Evaluating sales team performance metrics involves analyzing various indicators to gauge the effectiveness and efficiency of your sales team’s efforts. It enables you to track progress towards sales targets, identify top performers, and address any challenges or issues hindering sales productivity. By regularly assessing sales team performance metrics, you can make data-driven decisions to optimize sales strategies and drive better results.
Important Sales Team Performance Metrics to Assess
- Quota Attainment: Quota attainment measures the percentage of sales representatives who achieve or exceed their assigned sales targets within a given period. It provides insights into individual and team performance relative to established goals, helping you identify top performers and areas for improvement.Example: If your sales team has 10 members, and 8 of them achieve or exceed their sales quotas for the quarter, the quota attainment rate would be 80%.
- Sales Rep Turnover Rate: Sales rep turnover rate measures the percentage of sales representatives who leave your organization within a specified period. High turnover can indicate dissatisfaction, poor performance, or other organizational issues that may impact sales productivity and revenue growth.Formula: Sales Rep Turnover Rate = (Number of Sales Reps Who Left / Total Number of Sales Reps) * 100Example: If you had 20 sales reps at the beginning of the year and 4 of them left during the year, the turnover rate would be (4 / 20) * 100 = 20%.
- Activity-to-Quota Ratio: Activity-to-Quota Ratio compares the sales activities performed by each sales representative to their assigned sales quota. It helps assess productivity levels and identify whether sales reps are allocating their time and resources effectively to meet their targets.Formula: Activity-to-Quota Ratio = (Total Sales Activities / Sales Quota) * 100Example: If a sales representative made 500 sales calls in a month and their monthly sales quota is 100 units, the activity-to-quota ratio would be (500 / 100) * 100 = 500%.
By evaluating these important sales team performance metrics, you can gain insights into individual and team performance, identify areas for improvement, and implement strategies to enhance sales productivity and achieve organizational objectives.
Sales Data Analytics and Reporting
In today’s data-driven business landscape, leveraging data analytics and effective reporting strategies is crucial for optimizing sales performance and driving business growth. By harnessing the power of data, you can gain valuable insights into your sales metrics, identify trends, and make informed decisions to enhance sales effectiveness and efficiency.
Utilizing Data Analytics for Sales Metrics
Data analytics involves the process of collecting, analyzing, and interpreting data to uncover meaningful insights and trends. In the context of sales, data analytics allows you to track key performance indicators (KPIs), understand customer behavior, and identify areas for improvement in your sales processes. By leveraging data analytics tools and techniques, you can gain a deeper understanding of your sales performance and make data-driven decisions to drive business success.
Effective Reporting Strategies for Sales Metrics
- Choosing the Right Reporting Tools: Selecting the appropriate reporting tools is essential for effectively tracking and analyzing sales metrics. Choose tools that align with your business needs, provide comprehensive analytics capabilities, and offer customizable reporting features. Popular reporting tools for sales metrics include Excel, Google Sheets, Salesforce, Microsoft Power BI, Tableau, and Google Analytics.
- Creating Actionable Reports: When creating sales reports, focus on generating actionable insights that enable stakeholders to make informed decisions. Present data in a clear, concise manner, using visualizations such as charts, graphs, and dashboards to highlight key trends and performance metrics. Tailor reports to specific audiences, providing relevant information that empowers them to take meaningful actions to drive sales growth.
- Implementing Data-Driven Decisions: Data-driven decision-making involves using insights derived from sales metrics to inform strategic decisions and optimize sales strategies. Encourage a culture of data-driven decision-making within your organization, where stakeholders rely on empirical evidence and analysis rather than intuition or gut feelings. By integrating data into decision-making processes, you can enhance sales performance, improve forecasting accuracy, and drive business success.
By effectively utilizing data analytics and implementing robust reporting strategies, you can unlock the full potential of your sales metrics, drive continuous improvement, and achieve your sales objectives with greater efficiency and effectiveness.
Best Practices for Sales Metrics Tracking
Tracking sales metrics effectively is essential for optimizing sales performance and driving business growth. Here are some best practices to ensure success:
- Establish Clear Goals and Objectives: Clearly define the key performance indicators (KPIs) and metrics that align with your business objectives. Set specific, measurable goals for each metric to provide clarity and direction for your sales team.
- Use Real-Time Data: Utilize real-time data analytics tools to track and analyze sales metrics promptly. By accessing up-to-date information, you can identify trends, respond to changing market conditions, and make timely adjustments to your sales strategy.
- Regularly Review and Analyze Metrics: Schedule regular reviews of your sales metrics to monitor performance, identify areas for improvement, and track progress towards goals. Analyze historical data to identify trends and patterns, allowing you to make informed decisions and adjustments to your sales strategy.
- Empower Sales Team with Insights: Share sales metrics and insights with your sales team to provide visibility into their performance and motivate them to achieve their goals. Encourage open communication and collaboration, allowing team members to share best practices and learn from each other’s successes.
- Invest in Training and Development: Provide ongoing training and development opportunities for your sales team to enhance their skills and knowledge. Equip them with the tools and resources they need to succeed, including training on using data analytics tools and interpreting sales metrics effectively.
- Iterate and Adapt: Continuously evaluate and refine your sales metrics tracking processes based on feedback and results. Be open to experimentation and innovation, and be willing to adapt your approach to meet changing business needs and market dynamics.
Challenges Tracking Sales Metrics
Tracking sales metrics can pose various challenges for businesses. Here are some common challenges and strategies for overcoming them:
- Data Quality Issues: Inaccurate or incomplete data can undermine the reliability of your sales metrics. Implement data validation processes and invest in data cleansing tools to ensure the accuracy and integrity of your sales data.
- Lack of Integration: Disparate systems and data silos can make it challenging to consolidate and analyze sales metrics effectively. Invest in integrated CRM and analytics platforms to centralize data and streamline the reporting process.
- Resistance to Change: Resistance from sales teams or stakeholders to adopt new metrics or processes can hinder progress. Foster a culture of openness and transparency, and communicate the benefits of sales metrics tracking to gain buy-in and support from all stakeholders.
- Overemphasis on Quantity over Quality: Focusing solely on meeting sales targets without considering the quality of leads or customer satisfaction metrics can lead to short-term gains but long-term issues. Balance quantity metrics with quality metrics to ensure sustainable growth and customer satisfaction.
- Lack of Actionable Insights: Simply tracking sales metrics without deriving actionable insights can result in missed opportunities. Invest in analytics tools that provide deep insights into sales performance and empower decision-makers with actionable recommendations for improvement.
By addressing these challenges proactively and implementing strategies to overcome them, businesses can maximize the effectiveness of their sales metrics tracking efforts and drive sustainable growth and success.
Conclusion
Mastering top sales metrics is essential for driving business success in today’s competitive marketplace. By tracking key performance indicators such as revenue, sales growth rate, customer acquisition cost, and more, businesses can gain valuable insights into their sales performance, identify areas for improvement, and make data-driven decisions to optimize their sales strategies. Whether you’re a sales leader looking to empower your team or an individual contributor aiming to boost your performance, understanding and leveraging sales metrics is the key to unlocking your full potential and achieving your sales objectives.
Furthermore, by adopting best practices for sales metrics tracking, implementing effective reporting strategies, and addressing common challenges, businesses can maximize the impact of their sales metrics initiatives. With a data-driven approach to sales management, organizations can drive continuous improvement, enhance customer satisfaction, and ultimately, drive revenue growth and profitability.
Get Started With a Prebuilt Template!
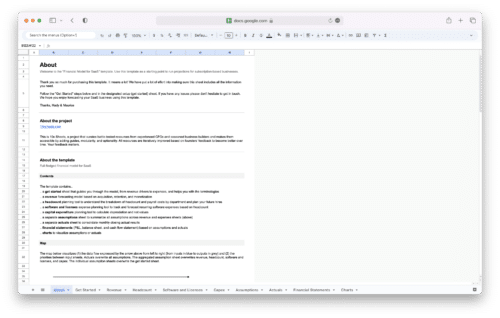
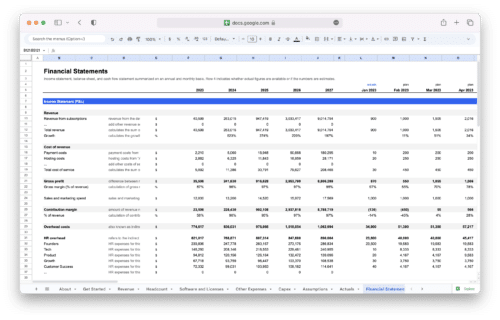
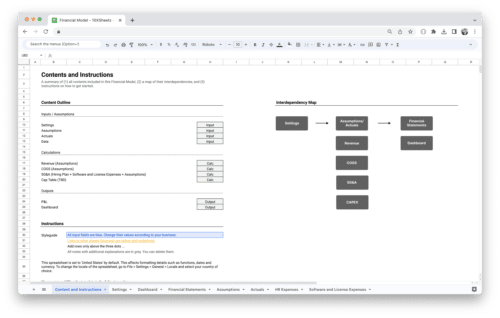
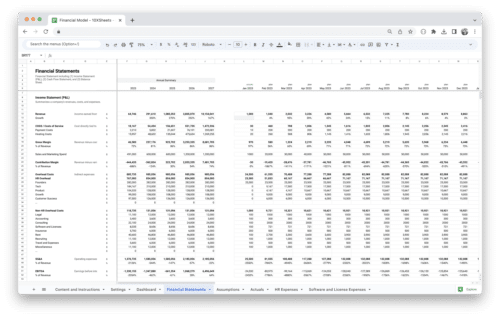
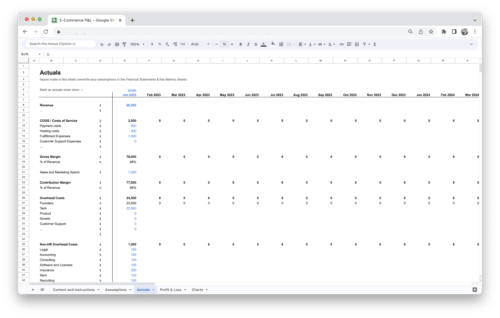
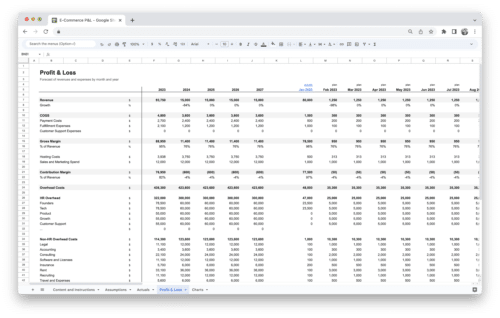
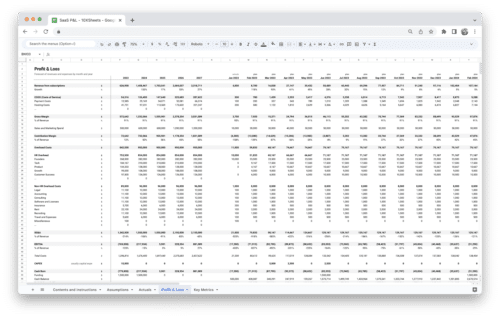
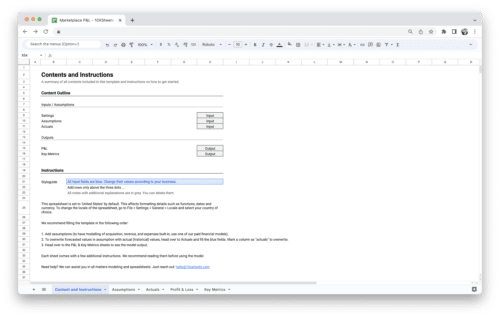
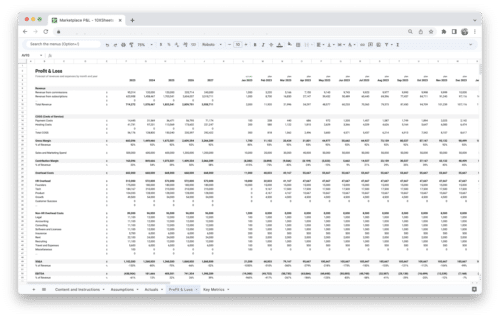
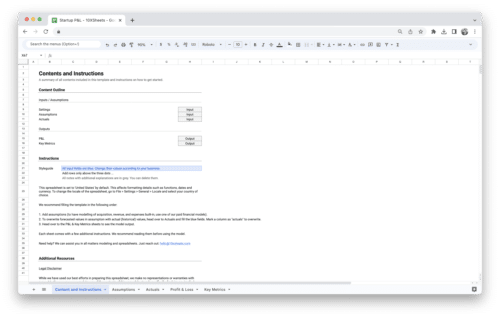
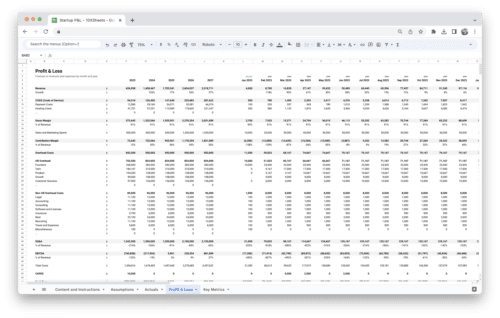
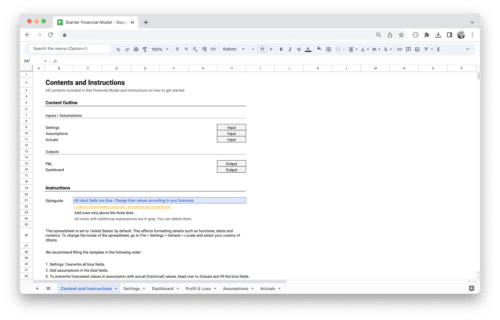
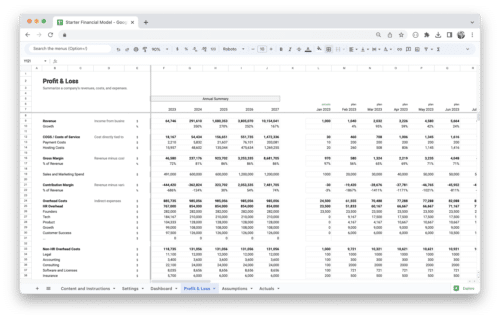
Looking to streamline your business financial modeling process with a prebuilt customizable template? Say goodbye to the hassle of building a financial model from scratch and get started right away with one of our premium templates.
- Save time with no need to create a financial model from scratch.
- Reduce errors with prebuilt formulas and calculations.
- Customize to your needs by adding/deleting sections and adjusting formulas.
- Automatically calculate key metrics for valuable insights.
- Make informed decisions about your strategy and goals with a clear picture of your business performance and financial health.

