- Key Revenue Metrics
- Profitability Metrics: Evaluating Your Financial Performance
- Sales Metrics: Analyzing and Optimizing Your Sales Performance
- Retention Metrics: Building Long-Term Customer Relationships
- Financial Metrics: Evaluating Your Investment and Break-Even Point
- Marketing Metrics: Evaluating Your Marketing Performance
- Operational Metrics: Optimizing Your Business Operations
- Data Analysis and Tools: Leveraging Data for Insights
- Conclusion
Measuring and analyzing revenue metrics is essential for success. Revenue metrics provide valuable insights into the financial performance and growth of a business, enabling you to make informed decisions and optimize your strategies. This comprehensive guide will walk you through the key revenue metrics that every business needs to measure, their significance, calculation methods, and strategies to improve them. Whether you’re a business owner, manager, or marketer, understanding these metrics will empower you to drive revenue growth and maximize profitability.
Key Revenue Metrics
Gross Revenue: Understanding Your Total Income
Gross revenue is the total amount of revenue generated by your business before deducting any costs or expenses. It provides an overall picture of your business’s financial performance. Calculating gross revenue involves summing up all the revenue earned within a specific period. The formula for gross revenue is:
Gross Revenue = Total Sales Revenue
- Gross revenue reflects the total sales generated by your business.
- It helps you assess the overall performance of your business.
- Factors such as pricing strategies, product mix, and market demand impact gross revenue.
Net Revenue: Evaluating Your Revenue After Deductions
Net revenue, also known as net sales or net income, is the revenue left after deducting returns, discounts, and allowances from the gross revenue. It represents the actual revenue your business earns from its operations. The formula for net revenue is:
Net Revenue = Gross Revenue – Returns – Discounts – Allowances
- Net revenue provides a more accurate representation of your business’s revenue.
- It takes into account the deductions and adjustments made to gross revenue.
- Monitoring net revenue helps you understand the profitability of your business.
Average Revenue Per User (ARPU): Maximizing Revenue from Customers
Average Revenue Per User (ARPU) measures the average revenue generated by each customer or user. It is calculated by dividing the total revenue generated within a specific period by the number of active customers/users during that period. The formula for ARPU is:
ARPU = Total Revenue / Number of Active Customers/Users
- ARPU helps you gauge the revenue contribution of each customer or user.
- It indicates the effectiveness of your revenue generation strategies.
- Increasing ARPU involves optimizing pricing, upselling, and cross-selling.
Customer Lifetime Value (CLV): Unlocking Long-Term Revenue Potential
Customer Lifetime Value (CLV) is a metric that estimates the total revenue a customer will generate throughout their relationship with your business. It takes into account the customer’s average purchase value, purchase frequency, and customer lifespan. The formula for CLV varies depending on the complexity of your business model, but a simplified version is:
CLV = (Average Purchase Value) x (Purchase Frequency) x (Customer Lifespan)
- CLV helps you understand the long-term revenue potential of your customer base.
- It helps in identifying high-value customers and tailoring strategies to retain them.
- Increasing CLV involves enhancing customer satisfaction, loyalty, and repeat purchases.
Revenue Growth Rate: Tracking Your Business’s Expansion
Revenue Growth Rate measures the percentage increase or decrease in revenue over a specific period compared to the previous period. It allows you to assess the growth trends and performance of your business. The formula for revenue growth rate is:
Revenue Growth Rate = ((Current Period Revenue – Previous Period Revenue) / Previous Period Revenue) x 100
- Revenue Growth Rate indicates the rate at which your business is growing.
- Positive growth rates signify business expansion, while negative growth rates indicate decline.
- Strategies to accelerate revenue growth include market expansion, product diversification, and customer acquisition efforts.
Profitability Metrics: Evaluating Your Financial Performance
Profitability metrics provide insights into your business’s financial health and efficiency. Let’s explore three key profitability metrics:
Gross Profit Margin: Assessing Your Profitability Before Overhead Costs
Gross Profit Margin measures the percentage of revenue remaining after deducting the direct costs associated with producing or delivering your product or service. It reflects your business’s profitability before considering overhead expenses. The formula for gross profit margin is:
Gross Profit Margin = (Gross Profit / Revenue) x 100
- Gross Profit Margin indicates the profitability of your core operations.
- Higher gross profit margins signify better cost control and pricing strategies.
- Improving gross profit margin involves optimizing production processes, negotiating better supplier contracts, and implementing cost-effective measures.
Net Profit Margin: Understanding Your Overall Profitability
Net Profit Margin, also known as the bottom line, measures the percentage of revenue that translates into profit after deducting all costs, including both direct and indirect expenses. It provides a comprehensive view of your business’s profitability. The formula for net profit margin is:
Net Profit Margin = (Net Profit / Revenue) x 100
- Net Profit Margin helps you assess your business’s overall financial performance.
- Higher net profit margins indicate efficient cost management and revenue generation.
- Strategies to enhance net profit margin include reducing operating expenses, increasing pricing, and optimizing resource allocation.
Contribution Margin: Analyzing the Profitability of Individual Products
Contribution Margin assesses the profitability of individual products or services by measuring the revenue left after deducting the variable costs associated with producing or delivering them. It helps you identify the most profitable products and make informed pricing and production decisions. The formula for contribution margin is:
Contribution Margin = (Revenue – Variable Costs) / Revenue
- Contribution Margin allows you to evaluate the profitability of each product or service.
- It helps you prioritize and allocate resources effectively.
- Increasing contribution margin involves optimizing pricing, reducing variable costs, and focusing on high-margin products.
Sales Metrics: Analyzing and Optimizing Your Sales Performance
Sales metrics provide valuable insights into your sales performance and help you identify areas for improvement. Let’s explore three key sales metrics:
Sales Conversion Rate: Evaluating Your Sales Effectiveness
Sales Conversion Rate measures the percentage of leads or prospects that convert into paying customers. It indicates the effectiveness of your sales process and the ability to turn leads into revenue. The formula for sales conversion rate is:
Sales Conversion Rate = (Number of Conversions / Number of Leads) x 100
- Sales Conversion Rate helps you assess your sales team’s efficiency.
- Higher conversion rates indicate better sales strategies and lead nurturing.
- Techniques to increase sales conversion rate include improving lead quality, refining sales scripts, and implementing effective follow-up processes.
Customer Acquisition Cost (CAC): Optimizing Your Customer Acquisition Strategy
Customer Acquisition Cost (CAC) measures the average cost incurred to acquire a new customer. It includes the expenses associated with marketing, sales, and other activities aimed at attracting and converting customers. The formula for customer acquisition cost is:
CAC = (Total Marketing and Sales Expenses) / (Number of New Customers Acquired)
- CAC helps you evaluate the efficiency of your customer acquisition efforts.
- It helps in budgeting and optimizing your marketing and sales strategies.
- Strategies to reduce customer acquisition cost include improving targeting, enhancing conversion rates, and maximizing customer referrals.
Sales Growth Rate: Tracking Your Sales Expansion
Sales Growth Rate measures the percentage increase or decrease in sales over a specific period compared to the previous period. It helps you monitor the performance of your sales efforts and identify trends. The formula for sales growth rate is:
Sales Growth Rate = ((Current Period Sales – Previous Period Sales) / Previous Period Sales) x 100
- Sales Growth Rate indicates the rate at which your sales are growing.
- Positive growth rates signify business expansion, while negative growth rates indicate sales decline.
- Approaches to boost sales growth rate include implementing effective marketing strategies, exploring new markets, and improving customer retention.
Retention Metrics: Building Long-Term Customer Relationships
Retention metrics focus on customer loyalty and satisfaction, which are crucial for sustainable business growth. Let’s explore three key retention metrics:
Customer Churn Rate: Identifying Customer Attrition
Customer Churn Rate measures the percentage of customers who stop using your product or service within a given period. It helps you identify customer attrition and take proactive measures to retain customers. The formula for customer churn rate is:
Customer Churn Rate = (Number of Customers Lost / Number of Customers at the Beginning of the Period) x 100
- Customer Churn Rate helps you understand customer retention challenges.
- Lower churn rates signify higher customer satisfaction and loyalty.
- Retention strategies to reduce churn rate include enhancing customer support, personalizing communication, and offering loyalty programs.
Repeat Purchase Rate: Assessing Customer Loyalty
Repeat Purchase Rate measures the percentage of customers who make multiple purchases over a specific period. It indicates customer loyalty and the effectiveness of your retention efforts. The formula for repeat purchase rate is:
Repeat Purchase Rate = (Number of Repeat Customers / Total Number of Customers) x 100
- Repeat Purchase Rate helps you evaluate the success of your retention strategies.
- Higher repeat purchase rates indicate customer satisfaction and loyalty.
- Tactics to increase repeat purchase rate include delivering exceptional customer experiences, implementing customer loyalty programs, and offering personalized recommendations.
Customer Lifetime Value to Customer Acquisition Cost Ratio (CLV:CAC): Assessing Customer Value
The CLV:CAC ratio compares the customer lifetime value (CLV) with the customer acquisition cost (CAC) and helps you evaluate the return on investment for acquiring and retaining customers. The formula for CLV:CAC ratio is:
CLV:CAC Ratio = CLV / CAC
- CLV:CAC ratio helps you assess the efficiency and profitability of your customer acquisition and retention efforts.
- Higher ratios indicate better returns on your investment in acquiring and retaining customers.
- Enhancing the CLV:CAC ratio involves increasing CLV through customer satisfaction and loyalty programs while optimizing CAC through targeted marketing and sales strategies.
Financial Metrics: Evaluating Your Investment and Break-Even Point
Financial metrics provide insights into your business’s financial performance and investment viability. Let’s explore two key financial metrics:
Return on Investment (ROI): Measuring Investment Profitability
Return on Investment (ROI) measures the profitability of an investment by comparing the net profit generated with the cost of the investment. It helps you assess the effectiveness of your investment decisions. The formula for ROI is:
ROI = ((Net Profit from Investment – Cost of Investment) / Cost of Investment) x 100
- ROI helps you evaluate the success of your investments and allocate resources wisely.
- Higher ROI indicates more profitable investments.
- Strategies for maximizing ROI include conducting thorough investment analysis, diversifying investments, and monitoring performance.
Break-Even Point: Achieving Cost-Revenue Equilibrium
Break-Even Point is the level of sales or revenue at which your business neither makes a profit nor incurs a loss. It helps you understand the minimum sales volume needed to cover all costs and reach profitability. The formula for break-even point depends on your business’s cost structure but is generally calculated as:
Break-Even Point (in units) = Fixed Costs / (Selling Price per Unit – Variable Costs per Unit)
- Break-Even Point helps you set sales targets and understand cost-revenue dynamics.
- Achieving the break-even point faster ensures early profitability.
- Actions to achieve break-even faster include reducing costs, increasing sales volume, and optimizing pricing strategies.
Marketing Metrics: Evaluating Your Marketing Performance
Marketing metrics provide insights into the effectiveness of your marketing efforts. Let’s explore three key marketing metrics:
Customer Acquisition Rate: Assessing Marketing Effectiveness
Customer Acquisition Rate measures the number of new customers acquired within a specific period. It helps you evaluate the success of your marketing campaigns and initiatives. The formula for customer acquisition rate is:
Customer Acquisition Rate = Number of New Customers Acquired / Total Potential Customers x 100
- Customer Acquisition Rate allows you to assess the efficiency of your marketing strategies.
- Higher acquisition rates indicate successful marketing campaigns and lead generation efforts.
- Techniques to improve customer acquisition rate include targeted advertising, optimized landing pages, and effective lead nurturing.
Customer Lifetime Value to Customer Acquisition Cost Ratio by Marketing Channel: Allocating Resources Strategically
The CLV:CAC ratio can be calculated for each marketing channel individually, helping you evaluate the effectiveness of different channels in acquiring and retaining profitable customers. This allows you to allocate your marketing resources strategically. The formula for CLV:CAC ratio by marketing channel is:
CLV:CAC Ratio by Marketing Channel = CLV by Marketing Channel / CAC by Marketing Channel
- CLV:CAC ratio by marketing channel provides insights into the profitability of different marketing channels.
- Higher ratios indicate more efficient and effective channels.
- Allocating resources based on CLV:CAC ratios by channel maximizes your marketing ROI.
Return on Ad Spend (ROAS): Measuring Advertising Effectiveness
Return on Ad Spend (ROAS) measures the profitability of your advertising campaigns by comparing the revenue generated with the cost of advertising. It helps you assess the effectiveness of your advertising efforts. The formula for ROAS is:
ROAS = (Revenue Generated from Ads / Cost of Advertising) x 100
- ROAS allows you to evaluate the success of your advertising campaigns and optimize your advertising budget.
- Higher ROAS indicates more profitable advertising campaigns.
- Strategies to optimize ROAS include targeting relevant audiences, refining ad copy, and optimizing landing pages.
Operational Metrics: Optimizing Your Business Operations
Operational metrics focus on the efficiency and effectiveness of your business operations. Let’s explore three key operational metrics:
Inventory Turnover: Maximizing Inventory Efficiency
Inventory Turnover measures how quickly your inventory is sold and replaced within a specific period. It helps you assess inventory efficiency and make informed decisions regarding stock management. The formula for inventory turnover is:
Inventory Turnover = Cost of Goods Sold / Average Inventory Value
- Inventory Turnover indicates the effectiveness of your inventory management and sales performance.
- Higher turnover ratios suggest efficient inventory control and reduced carrying costs.
- Improving inventory turnover involves implementing demand forecasting, optimizing inventory levels, and improving supply chain efficiency.
Order Fulfillment Cycle Time: Enhancing Order Processing Efficiency
Order Fulfillment Cycle Time measures the time it takes to process and fulfill customer orders, starting from order placement to delivery. It helps you assess the efficiency of your order processing system.
- Order Fulfillment Cycle Time indicates your ability to meet customer expectations and deliver products or services promptly.
- Shorter cycle times enhance customer satisfaction and loyalty.
- Reducing order fulfillment cycle time involves streamlining processes, optimizing inventory availability, and improving logistics and shipping.
Average Revenue Per Transaction (ARPT): Maximizing Each Transaction’s Value
Average Revenue Per Transaction (ARPT) measures the average value of each transaction or purchase made by a customer. It helps you understand the revenue generated from individual transactions and identify opportunities to increase sales per transaction.
- ARPT allows you to assess the effectiveness of your upselling and cross-selling strategies.
- Increasing ARPT leads to higher revenue without acquiring additional customers.
- Tactics to increase ARPT include offering bundled products, showcasing related items, and implementing personalized recommendations.
Data Analysis and Tools: Leveraging Data for Insights
Collecting and analyzing revenue data is crucial for measuring and optimizing revenue metrics. Here are some key aspects to consider:
Collecting and Organizing Revenue Data
Collecting accurate and comprehensive revenue data is essential for meaningful analysis. Implement robust data collection methods, including integrating your sales, finance, and marketing systems. Ensure data integrity and maintain a centralized database for easy access and analysis.
Data Analysis Techniques for Revenue Metrics
Utilize various data analysis techniques to extract meaningful insights from your revenue data. These techniques include trend analysis, cohort analysis, segmentation, and regression analysis. Use statistical tools and software to perform data analysis and visualize results effectively.
Popular Tools and Software for Revenue Tracking
Numerous tools and software are available to track and analyze revenue metrics efficiently. Some popular options include customer relationship management (CRM) systems, accounting software, analytics platforms, and business intelligence tools. Choose tools that align with your business needs and integrate well with your existing systems.
Conclusion
Measuring and analyzing revenue metrics is fundamental to business success. By understanding and tracking key revenue metrics, such as gross revenue, net revenue, ARPU, CLV, and revenue growth rate, you gain valuable insights into your business’s financial performance and growth potential. Additionally, profitability metrics like gross profit margin, net profit margin, and contribution margin allow you to evaluate your business’s financial health and efficiency.
Sales metrics, including sales conversion rate, CAC, and sales growth rate, help you optimize your sales strategies and drive revenue growth. Retention metrics like customer churn rate, repeat purchase rate, and CLV:CAC ratio assist in building long-term customer relationships and maximizing customer lifetime value.
Financial metrics like ROI and break-even point guide your investment decisions and ensure financial viability. Marketing metrics, such as customer acquisition rate, CLV:CAC ratio by marketing channel, and ROAS, help evaluate and optimize your marketing performance.
Operational metrics like inventory turnover, order fulfillment cycle time, and ARPT aid in streamlining your business operations and enhancing efficiency. By leveraging data analysis techniques and using appropriate tools, you can gain valuable insights from your revenue data.
Remember, ongoing measurement, analysis, and optimization of revenue metrics are vital for sustainable growth. Implement the strategies outlined in this guide, adapt them to your business needs, and make data-driven decisions to unlock the full revenue potential of your business.
Get Started With a Prebuilt Template!
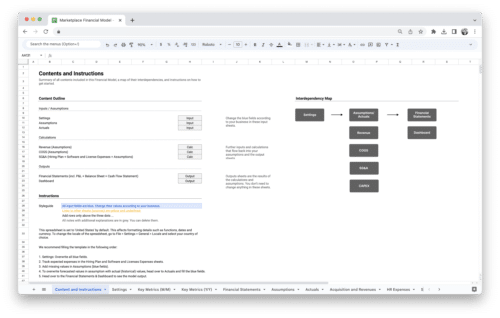
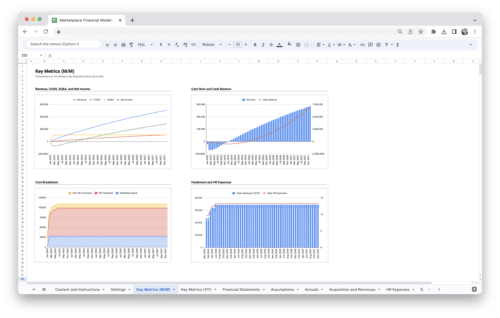
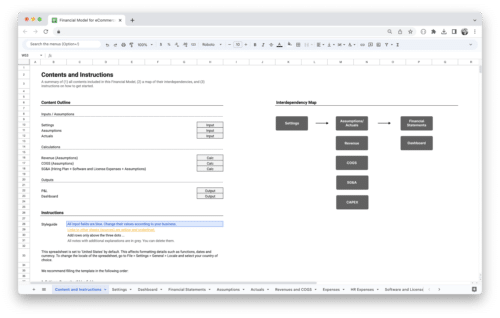
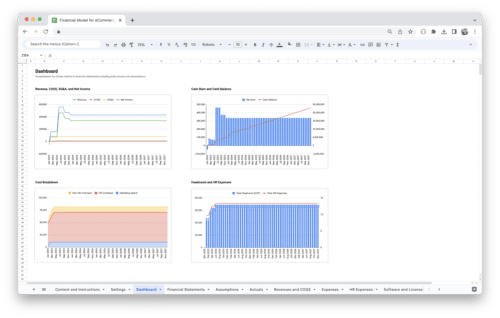
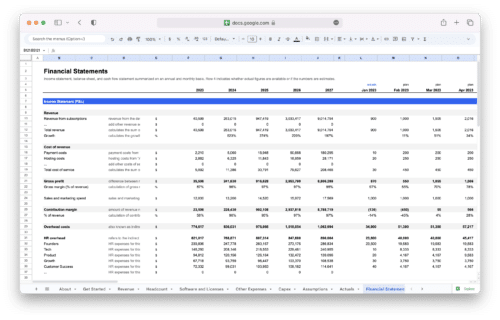
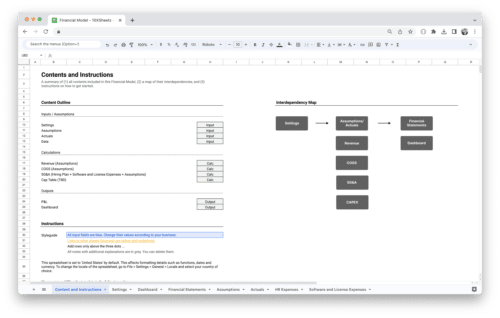
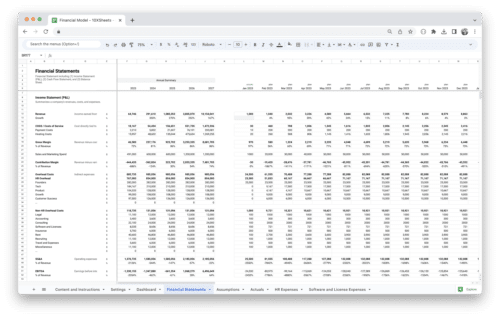
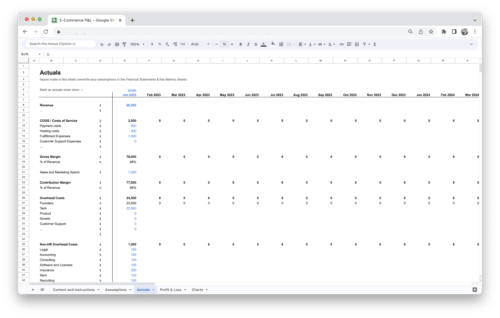
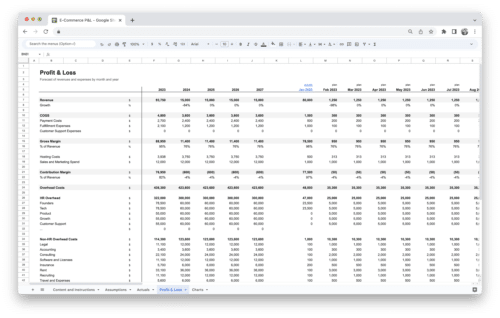
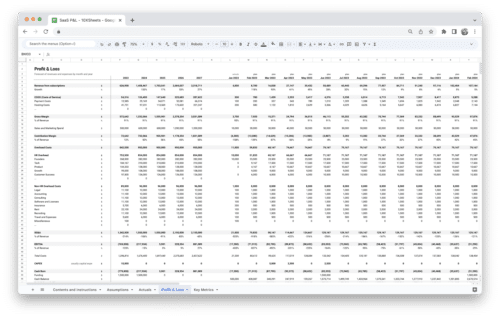
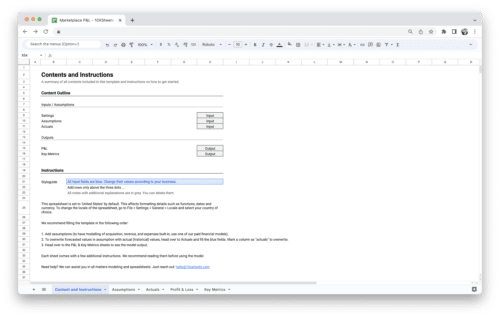
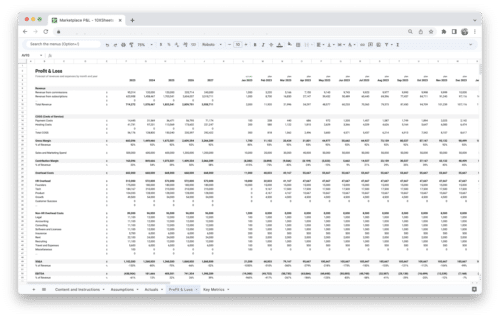
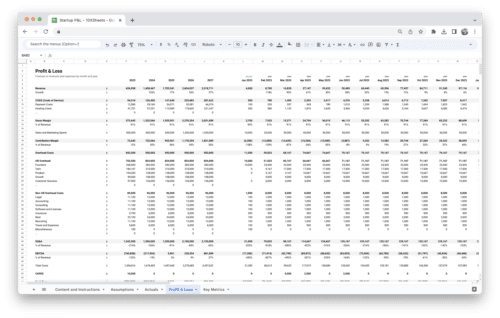
Looking to streamline your business financial modeling process with a prebuilt customizable template? Say goodbye to the hassle of building a financial model from scratch and get started right away with one of our premium templates.
- Save time with no need to create a financial model from scratch.
- Reduce errors with prebuilt formulas and calculations.
- Customize to your needs by adding/deleting sections and adjusting formulas.
- Automatically calculate key metrics for valuable insights.
- Make informed decisions about your strategy and goals with a clear picture of your business performance and financial health.

