- What are Retail Metrics?
- Understanding Sales Metrics
- Customer-Centric Metrics
- Inventory and Stock Performance Metrics
- Profitability Metrics
- Operational Efficiency Metrics
- Digital and Omnichannel Metrics
- Market and Competitor Analysis Metrics
- Metrics for Long-Term Growth
- Examples of Retail Metrics in Action
- Conclusion
How do you know if your retail business is really thriving? The answer lies in the numbers. Retail metrics are the tools that give you the insights you need to track performance, optimize operations, and make smarter decisions.
Whether you’re keeping an eye on sales, customer satisfaction, or inventory, these metrics help you understand what’s working and where you can improve. With the right data in hand, you can make informed choices that drive growth and profitability.
What are Retail Metrics?
Retail metrics are key performance indicators (KPIs) that help businesses track, measure, and evaluate their performance across various aspects of operations, from sales and customer engagement to inventory management and profitability. These metrics allow retailers to understand how well they are meeting their business goals, identify areas for improvement, and make data-driven decisions to optimize performance. Whether you’re a small shop owner or a large enterprise, understanding and applying retail metrics is essential for sustainable growth and staying competitive in the market.
Retail metrics cover a wide range of areas, such as sales performance, customer satisfaction, operational efficiency, and financial health. Some of the most common retail metrics include total sales, average transaction value (ATV), conversion rates, inventory turnover, and customer retention. These metrics give retailers a comprehensive view of their business health and customer behavior.
Importance of Metrics in Retail
Retail metrics provide insights that are essential for maintaining and growing a successful retail business. They help you identify trends, measure the effectiveness of strategies, and make informed decisions that align with your business objectives. Here’s why they are critical:
- Informed decision-making: Retail metrics provide data-driven insights that help managers and business owners make decisions based on performance, rather than assumptions.
- Tracking performance: By consistently monitoring metrics, you can track progress toward goals and benchmarks, ensuring your business stays on the right path.
- Cost control: Metrics like labor cost percentage and inventory turnover help businesses control expenses and identify areas for cost reduction.
- Customer insights: Metrics such as customer lifetime value (CLV) and retention rate give you a deeper understanding of your customers’ behavior and preferences.
- Competitive edge: Analyzing market share and competitor pricing allows you to stay ahead of the competition and adjust strategies as needed.
- Optimizing operations: Metrics like order fulfillment time and shrinkage rate provide insights into areas where operational efficiencies can be improved.
How Metrics Drive Decision-Making and Strategy
Retail metrics directly influence the strategic decisions that drive business growth and operational success. They provide a clear view of where your business stands and help you develop strategies to address weaknesses or capitalize on strengths. Here’s how metrics guide your decisions:
- Setting goals: Metrics allow you to set realistic, measurable goals for various areas of your business, such as sales targets, customer acquisition, and operational efficiency.
- Resource allocation: Understanding where your business excels or struggles helps allocate resources effectively, whether that’s staffing, inventory, or marketing budget.
- Improving customer experience: Customer-related metrics guide strategies for improving satisfaction and engagement, helping to boost loyalty and retention.
- Inventory management: Metrics such as inventory turnover and stockouts allow you to optimize inventory levels, reducing waste and ensuring you meet demand without overstocking.
- Pricing strategies: Competitive pricing analysis and market share metrics help refine pricing strategies, ensuring your offerings remain competitive while maximizing profitability.
- Performance monitoring: Continuously tracking key metrics helps identify trends and make adjustments in real-time to keep your business on track.
Understanding Sales Metrics
Sales metrics are at the heart of retail performance, helping you measure revenue, track sales efficiency, and set future targets. Understanding how to interpret these metrics can directly inform your pricing strategy, inventory management, and overall business growth.
Total Sales and Revenue
Total sales or revenue is the most straightforward and critical metric for any retail business. It represents the total income generated from the sale of goods or services within a specific time frame. Tracking total sales consistently helps you evaluate the overall financial performance of your business and understand whether you’re meeting your targets.
The formula for total sales is simple:
Formula:
Total Sales = Price per Unit x Number of Units Sold
For example, if you sell 300 units of a product priced at $25 each, the total sales will be:
$25 x 300 = $7,500
By regularly monitoring total sales, you can assess trends over time, identify high-performing products, and adjust your marketing and promotional strategies accordingly. If sales are decreasing, it’s essential to identify whether the drop is due to seasonality, market shifts, or other factors.
Average Transaction Value (ATV)
Average Transaction Value (ATV) helps you understand how much customers are spending each time they make a purchase. It is particularly useful for analyzing customer behavior and determining whether your upselling or cross-selling strategies are effective.
The formula for calculating ATV is:
Formula:
Average Transaction Value = Total Sales / Number of Transactions
For instance, if your total sales for the day amount to $5,000 and you had 250 transactions, your ATV would be:
$5,000 / 250 = $20
A low ATV may suggest that customers are purchasing fewer items per visit or that your pricing strategy needs adjustment. On the other hand, a higher ATV can indicate that your customers are purchasing more expensive items or responding well to promotional strategies that encourage larger purchases.
Sales Per Square Foot
Sales per square foot is a metric primarily used for brick-and-mortar retailers to measure how efficiently the retail space is being used to generate sales. This metric helps you evaluate the return on investment of your physical store’s space and layout.
The formula to calculate sales per square foot is:
Formula:
Sales Per Square Foot = Total Sales / Total Square Footage of the Store
For example, if your store generated $50,000 in sales this month and occupies 2,000 square feet, the sales per square foot would be:
$50,000 / 2,000 = $25
The higher the sales per square foot, the more efficient your use of space. If the metric is low, it may indicate that you need to optimize your store layout, rearrange merchandise, or even consider downsizing or expanding your store depending on the results.
Sales Growth and Comparison
Sales growth measures how much your sales have increased or decreased over a specific period, giving you an idea of how well your business is expanding or contracting. Tracking sales growth is essential for setting realistic goals and forecasting future performance.
The formula to calculate sales growth is:
Formula:
Sales Growth = (Current Period Sales – Previous Period Sales) / Previous Period Sales x 100
For example, if your sales this month are $200,000 and last month’s sales were $150,000, your sales growth would be:
($200,000 – $150,000) / $150,000 x 100 = 33.33%
A positive sales growth percentage shows that your business is progressing and improving, whereas negative growth might require a deeper dive into the factors causing the decline, such as changes in customer preferences or increased competition.
Customer-Centric Metrics
Customer-centric metrics focus on measuring how well you’re serving your customers, maintaining loyalty, and attracting new buyers. These metrics offer deeper insights into the relationship between your brand and your customers, which is crucial for sustaining long-term business growth.
Customer Lifetime Value (CLV)
Customer Lifetime Value (CLV) is one of the most important customer-centric metrics, as it helps you estimate the total revenue a customer will generate during their relationship with your brand. CLV guides decisions on customer acquisition costs, loyalty programs, and retention strategies.
The formula to calculate CLV is:
Formula:
Customer Lifetime Value = Average Purchase Value x Purchase Frequency x Customer Lifespan
For example, if the average purchase value is $50, a customer buys from you 5 times a year, and they typically remain a customer for 3 years, their CLV would be:
$50 x 5 x 3 = $750
Understanding CLV helps you allocate your marketing budget more effectively by ensuring you’re spending enough to acquire customers who will bring long-term value. CLV also helps in optimizing customer retention efforts, as improving retention will directly increase the lifetime value of each customer.
Customer Retention Rate
Customer retention rate is a critical metric that tells you how well your business is doing in keeping existing customers. It’s often cheaper and more profitable to retain existing customers than to acquire new ones, making this metric a top priority for most retail businesses.
The formula to calculate customer retention rate is:
Formula:
Retention Rate = (Customers at End of Period – New Customers) / Customers at Start of Period x 100
For instance, if you had 800 customers at the start of the month, gained 200 new customers, and ended the month with 850 customers, the retention rate would be:
(850 – 200) / 800 x 100 = 81.25%
A high retention rate indicates strong customer satisfaction and loyalty, while a low retention rate signals potential problems in customer experience or product quality. Improving retention by enhancing customer service, offering loyalty programs, or personalizing experiences can help increase this rate.
Foot Traffic and Conversion Rate
Foot traffic is a metric used to measure the number of people visiting your store, either physically or digitally. Conversion rate, on the other hand, tells you how many of those visitors end up making a purchase. Together, these metrics help you understand your store’s ability to attract and convert customers.
The formula to calculate conversion rate is:
Formula:
Conversion Rate = (Number of Sales / Number of Visitors) x 100
If 500 people visited your store and 100 made a purchase, your conversion rate would be:
(100 / 500) x 100 = 20%
A low conversion rate indicates that although you’re attracting visitors, you may not be engaging them effectively enough to drive sales. This could be due to various factors such as poor store layout, ineffective promotions, or even an uninspiring online presence. Improving your conversion rate involves optimizing the in-store or online experience to encourage more purchases per visitor.
Net Promoter Score (NPS)
Net Promoter Score (NPS) is a customer satisfaction metric that measures how likely customers are to recommend your store to others. A high NPS suggests strong customer loyalty and positive word-of-mouth, while a low NPS can signal that changes are needed in your customer service, product offerings, or brand experience.
To calculate NPS, you subtract the percentage of detractors (those who rate your business 0-6) from the percentage of promoters (those who rate your business 9-10).
Formula:
NPS = % of Promoters – % of Detractors
For example, if 70% of customers give you a score of 9-10 (promoters) and 20% give you a score of 0-6 (detractors), your NPS would be:
70% – 20% = 50
An NPS of 50 is considered strong, meaning your customers are highly likely to recommend you to others. A low NPS means that you may need to address specific pain points to improve customer satisfaction and loyalty.
Inventory and Stock Performance Metrics
Effective inventory management is essential to running a successful retail business. These metrics help you track how efficiently your inventory is turning over, how well you’re meeting demand, and how you’re balancing stock levels to avoid excess or shortage. Understanding these metrics can help prevent lost sales, unnecessary markdowns, and costly stockouts.
Inventory Turnover
Inventory turnover is a key performance indicator (KPI) that measures how quickly your inventory is sold and replaced over a given period. A high turnover rate indicates that your products are in demand and that you’re managing inventory efficiently. Conversely, a low turnover suggests overstocking or slow-moving products, which can lead to excess inventory and tied-up capital.
To calculate inventory turnover, use the following formula:
Formula:
Inventory Turnover = Cost of Goods Sold (COGS) / Average Inventory
For example, if your COGS for the year is $500,000 and your average inventory during that period was $100,000, the inventory turnover would be:
$500,000 / $100,000 = 5
This means that your inventory was sold and replaced five times during the year. The higher the turnover, the better you’re managing your stock. A higher turnover rate generally means you’re generating more revenue relative to your inventory.
Stockouts and Overstock Levels
Stockouts and overstock levels represent the extremes of inventory mismanagement, both of which can harm your business. A stockout occurs when you run out of a product, leading to missed sales opportunities, while overstocking ties up capital and can result in markdowns or even unsold inventory.
Monitoring stockouts and overstock levels involves consistently analyzing your inventory against customer demand. The key is to maintain a balance—having enough stock to meet demand without having too much.
When stockouts occur, it’s essential to understand whether they are due to poor forecasting or supply chain delays. On the other hand, overstocking often results from overestimating demand or failing to move inventory fast enough.
By adjusting inventory orders based on real-time data and sales trends, you can optimize stock levels. A key metric related to managing stockouts is your stockout rate, which measures how often you run out of products.
Formula:
Stockout Rate = Number of Stockouts / Total Number of Products Sold
If you sold 1,000 units in a given period but ran out of 100 products, the stockout rate would be:
100 / 1,000 = 10%
A stockout rate of 10% indicates that 10% of your products were unavailable for customers, which might have resulted in lost sales.
Sell-Through Rate
The sell-through rate measures how much of your inventory has been sold over a specific period, which is a crucial indicator of product demand and inventory efficiency. A high sell-through rate means you’re selling inventory quickly and efficiently, while a low sell-through rate can point to overstocking, pricing issues, or lack of demand.
The formula for calculating sell-through rate is:
Formula:
Sell-Through Rate = Units Sold / Units Received
For example, if you received 500 units of a product and sold 400 units, the sell-through rate would be:
400 / 500 = 80%
This means 80% of your stock was sold during the period. A high sell-through rate is a positive sign, indicating that you’re aligning your inventory with customer demand. If the rate is low, you may need to reevaluate your pricing, marketing, or even product offering.
Days of Inventory
Days of inventory is a metric that calculates how many days it takes for your inventory to sell out, given your current sales velocity. This metric helps you understand how quickly your products are moving and gives you insights into how well you’re managing your stock.
The formula to calculate days of inventory is:
Formula:
Days of Inventory = Average Inventory / Cost of Goods Sold per Day
For example, if your average inventory is $120,000 and your daily cost of goods sold is $4,000, the days of inventory would be:
$120,000 / $4,000 = 30 days
This means that, at your current sales rate, it will take you 30 days to sell out of your inventory. This metric helps you forecast when you’ll need to reorder and ensure that you don’t experience stockouts.
Profitability Metrics
Profitability metrics are crucial for understanding how efficiently your business is generating profit from its sales. These metrics allow you to evaluate the financial health of your business, measure performance against industry standards, and make informed decisions about pricing, cost management, and investment.
Gross Margin
Gross margin is a profitability metric that shows the percentage of revenue remaining after accounting for the cost of goods sold (COGS). It’s a key indicator of your business’s efficiency in managing production or purchasing costs. The higher your gross margin, the more money you retain from each sale to cover operating expenses and profit.
The formula to calculate gross margin is:
Formula:
Gross Margin = (Revenue – COGS) / Revenue x 100
For example, if your revenue is $150,000 and your COGS is $90,000, the gross margin would be:
($150,000 – $90,000) / $150,000 x 100 = 40%
A gross margin of 40% means that for every dollar of revenue, you retain 40 cents after covering the cost of goods sold. This metric is crucial for assessing pricing strategies and overall cost structure. A high gross margin indicates that you’re effectively managing production costs, while a low margin suggests room for improvement in procurement or pricing.
Net Profit Margin
Net profit margin shows the percentage of revenue that remains after all operating expenses, taxes, interest, and other costs have been deducted. This is the ultimate profitability measure, as it reflects the actual profit your business makes after covering all its expenses.
The formula to calculate net profit margin is:
Formula:
Net Profit Margin = Net Profit / Revenue x 100
For example, if your net profit is $30,000 and your revenue is $200,000, the net profit margin would be:
$30,000 / $200,000 x 100 = 15%
A net profit margin of 15% means that after all expenses, you keep 15% of your revenue as profit. This metric helps you determine the overall financial health of your business. A low net profit margin could signal issues with operating costs, pricing, or inefficiencies in your business operations.
Contribution Margin
Contribution margin is a measure of how much revenue from each sale is available to cover fixed costs after variable costs have been deducted. It provides insight into the profitability of individual products and helps you understand which products contribute the most to your bottom line.
The formula to calculate contribution margin is:
Formula:
Contribution Margin = (Sales Revenue – Variable Costs) / Sales Revenue x 100
For example, if your sales revenue is $100,000 and your variable costs are $60,000, the contribution margin would be:
($100,000 – $60,000) / $100,000 x 100 = 40%
A contribution margin of 40% means that 40% of each dollar in sales goes toward covering your fixed costs and generating profit. This metric is helpful for determining which products are most profitable and can inform decisions around pricing, product mix, and cost management.
Return on Investment (ROI)
Return on Investment (ROI) is a profitability ratio that measures the return you generate on an investment relative to its cost. In retail, ROI is particularly useful for evaluating the effectiveness of marketing campaigns, store renovations, inventory investments, or any other strategic expenditure.
The formula to calculate ROI is:
Formula:
ROI = (Net Profit / Investment Cost) x 100
For example, if you invested $10,000 in a marketing campaign and generated $15,000 in net profit, the ROI would be:
($15,000 / $10,000) x 100 = 150%
An ROI of 150% means that for every dollar spent on the investment, you generated $1.50 in profit. This metric helps you determine whether your investments are yielding positive returns or if adjustments are needed to improve profitability.
By tracking these profitability metrics, you gain critical insights into the financial efficiency of your business and can make more informed decisions about cost-cutting, pricing, and strategic investments.
Operational Efficiency Metrics
Operational efficiency metrics focus on how well your business manages its internal processes, labor, and resources. These metrics can help identify areas where costs can be reduced, performance can be improved, and workflows can be optimized, ultimately driving greater profitability and customer satisfaction.
Labor Cost Percentage
Labor cost percentage is a key metric that measures how much of your revenue is spent on employee wages and benefits. Labor is often one of the largest expenses for retail businesses, so monitoring this metric ensures you’re maintaining a balance between providing quality service and controlling costs.
The formula to calculate labor cost percentage is:
Formula:
Labor Cost Percentage = (Labor Costs / Total Sales) x 100
For example, if your total sales for the month are $100,000 and you spent $20,000 on labor costs, the labor cost percentage would be:
($20,000 / $100,000) x 100 = 20%
This means that 20% of your revenue goes toward labor expenses. Monitoring this percentage helps you ensure that your labor costs are sustainable in relation to your sales. A high labor cost percentage can indicate that you’re overstaffing or paying employees too much relative to the revenue being generated, while a low percentage might suggest you’re understaffed or not investing enough in customer service.
Shrinkage Rate
Shrinkage refers to the loss of inventory due to theft, damage, or administrative errors. This metric is critical for understanding how much profit is lost due to preventable factors. High shrinkage rates can significantly impact your bottom line, and reducing shrinkage can lead to substantial savings.
The formula to calculate shrinkage rate is:
Formula:
Shrinkage Rate = (Inventory Loss / Total Inventory) x 100
For example, if you had $2,000 worth of inventory losses and your total inventory value was $50,000, the shrinkage rate would be:
($2,000 / $50,000) x 100 = 4%
A shrinkage rate of 4% means that 4% of your inventory has been lost due to theft, damage, or errors. To reduce shrinkage, you can improve inventory management, implement better security measures, and train staff to handle inventory properly. Keeping shrinkage rates low is crucial for maintaining profitability.
Order Fulfillment Time
Order fulfillment time measures how long it takes to process and ship an order after a customer places it. This metric is especially important for e-commerce businesses and companies with an omnichannel presence, as fast fulfillment can significantly impact customer satisfaction and retention.
The formula for order fulfillment time is:
Formula:
Order Fulfillment Time = Total Time Taken to Fulfill Orders / Number of Orders Fulfilled
For example, if you took 20 hours to fulfill 100 orders, the average fulfillment time per order would be:
20 hours / 100 orders = 0.2 hours per order (12 minutes)
Reducing order fulfillment time is crucial for improving customer experience, especially in industries where fast shipping is expected. Streamlining your inventory management, warehouse operations, and order processing systems can help shorten fulfillment times.
Customer Service Efficiency
Customer service efficiency measures how effectively your customer service team resolves issues, responds to inquiries, and manages customer relationships. It’s essential for maintaining customer satisfaction and loyalty. A highly efficient customer service team can handle a higher volume of inquiries with fewer resources, leading to better customer outcomes and lower operational costs.
The formula to calculate customer service efficiency is:
Formula:
Customer Service Efficiency = (Number of Resolved Cases / Total Number of Cases) x 100
For example, if your customer service team resolved 80 out of 100 customer cases in a given period, the efficiency would be:
(80 / 100) x 100 = 80%
A customer service efficiency rate of 80% means that your team is effectively resolving 80% of the cases they handle. Improving customer service efficiency involves training staff, implementing technology such as chatbots or self-service portals, and optimizing processes to resolve issues faster and more effectively.
Digital and Omnichannel Metrics
As retail increasingly moves online and across multiple channels, digital and omnichannel metrics have become critical for measuring the performance of online stores, mobile apps, and the overall customer experience across different touchpoints. These metrics help you understand how customers are interacting with your brand online and how those interactions drive sales, engagement, and conversions.
E-commerce Conversion Rate
The e-commerce conversion rate is a key metric that measures the percentage of website visitors who complete a purchase. It’s a direct reflection of your website’s ability to convert traffic into revenue. A higher conversion rate means that your site is optimized to encourage visitors to buy, while a low conversion rate could signal issues with your site’s usability, product offerings, or pricing.
The formula to calculate e-commerce conversion rate is:
Formula:
E-commerce Conversion Rate = (Number of Purchases / Number of Website Visitors) x 100
For example, if your website had 10,000 visitors and 200 of them made a purchase, the conversion rate would be:
(200 / 10,000) x 100 = 2%
A 2% conversion rate means that 2% of visitors to your site make a purchase. Depending on your industry, a 2% conversion rate might be average, but improving this rate can have a significant impact on your revenue. This can be done by optimizing your website’s user experience, improving product descriptions, offering promotions, or simplifying the checkout process.
Click-Through Rate (CTR)
Click-through rate (CTR) measures the percentage of people who click on a link, ad, or email relative to the number of people who view it. It’s commonly used in digital marketing to assess the effectiveness of online ads, email campaigns, or any call-to-action (CTA). A high CTR suggests that your messaging is resonating with your audience, while a low CTR could indicate that your ads or emails need refinement.
The formula for calculating CTR is:
Formula:
CTR = (Number of Clicks / Number of Impressions) x 100
For example, if you ran an ad that received 1,000 impressions and 50 clicks, the CTR would be:
(50 / 1,000) x 100 = 5%
A 5% CTR means that 5% of the people who saw your ad clicked on it. To improve CTR, you can experiment with different ad designs, messages, targeting strategies, and CTAs to find what resonates best with your audience.
Social Media Engagement
Social media engagement measures how actively your audience interacts with your content across social platforms like Facebook, Instagram, Twitter, and LinkedIn. High engagement indicates that your audience is interested in your brand and content, while low engagement may suggest that your content isn’t resonating or reaching the right people.
The formula to calculate social media engagement is:
Formula:
Social Media Engagement = (Total Engagements / Total Followers) x 100
For example, if you received 500 likes, comments, and shares from 5,000 followers, your engagement rate would be:
(500 / 5,000) x 100 = 10%
A 10% engagement rate means that 10% of your followers are interacting with your posts. Increasing engagement can be achieved by posting relevant, high-quality content, responding to comments, running contests or giveaways, and using targeted advertising.
Omnichannel Revenue
Omnichannel revenue tracks the total revenue generated across multiple channels, both online and offline. As businesses increasingly operate across physical stores, websites, mobile apps, and marketplaces, understanding omnichannel revenue helps you assess how well your channels work together to drive sales and enhance the customer experience.
The formula for omnichannel revenue is:
Formula:
Omnichannel Revenue = Revenue from All Channels (Website + In-Store + Mobile App + Other Platforms)
For example, if your website generated $30,000, your store sales totaled $50,000, and your mobile app brought in $20,000, your total omnichannel revenue would be:
$30,000 + $50,000 + $20,000 = $100,000
Monitoring omnichannel revenue helps you understand the impact of each channel and how they contribute to your overall sales. It also enables you to identify areas where you can improve integration between channels, such as offering seamless transitions between in-store and online shopping experiences or implementing click-and-collect services.
Tracking digital and omnichannel metrics is essential in today’s retail environment, where customers engage with brands across multiple platforms. Understanding these metrics helps optimize your online and offline presence, leading to better customer engagement and increased revenue.
Market and Competitor Analysis Metrics
Understanding the market landscape and how your business compares to competitors is essential for long-term success. Market and competitor analysis metrics provide insights into your market position, help you track competitors’ pricing strategies, and assess how well your brand is resonating with customers. These metrics are crucial for refining your business strategy, making informed decisions, and staying competitive in the market.
Market Share
Market share is a critical metric for understanding your business’s portion of the overall market for a given product or service. It allows you to assess how well you’re performing relative to competitors and how much of the total demand you are capturing. Monitoring market share over time helps you track growth and identify whether your business is gaining or losing ground within the industry.
The formula to calculate market share is:
Formula:
Market Share = (Your Sales / Total Market Sales) x 100
For example, if your business generated $500,000 in sales last year, and the total market sales in your industry were $5 million, your market share would be:
($500,000 / $5,000,000) x 100 = 10%
A market share of 10% indicates that your business holds 10% of the total sales in your industry. Tracking this metric over time allows you to evaluate whether your marketing strategies, product offerings, and customer engagement are working effectively to grow your share of the market.
Competitive Pricing Analysis
Competitive pricing analysis involves monitoring your competitors’ pricing strategies to ensure that your pricing remains competitive while maximizing profitability. By tracking how your prices compare to those of competitors, you can adjust your pricing to remain attractive to customers, respond to market changes, and optimize revenue.
The formula for a basic competitive pricing analysis could be:
Formula:
Average Competitor Price = Sum of Competitor Prices / Number of Competitors
For example, if you’re comparing the prices of a product with five competitors, where the prices are $50, $55, $60, $52, and $57, the average competitor price would be:
($50 + $55 + $60 + $52 + $57) / 5 = $54.8
Once you know the average competitor price, you can determine whether your product is priced higher, lower, or at parity. Adjusting your price in response to this analysis can help you stay competitive and attract more customers. Keep in mind, however, that pricing should also reflect your brand positioning and customer value.
Brand Awareness and Sentiment
Brand awareness and sentiment are crucial metrics for understanding how well your brand is known and how customers feel about it. Strong brand awareness and positive sentiment can drive customer loyalty, repeat business, and word-of-mouth marketing. Monitoring sentiment helps you gauge customer satisfaction and can identify areas for improvement.
Brand awareness can be measured by asking customers how familiar they are with your brand or by tracking social media mentions and website traffic. Sentiment analysis, on the other hand, analyzes the emotions behind customer interactions with your brand, such as positive, neutral, or negative feedback.
The formula for measuring brand sentiment is:
Formula:
Sentiment Score = (Positive Mentions – Negative Mentions) / Total Mentions x 100
For example, if you receive 200 positive mentions, 50 negative mentions, and 250 total mentions, your sentiment score would be:
(200 – 50) / 250 x 100 = 60%
A sentiment score of 60% suggests that most people are talking positively about your brand. Tracking brand awareness and sentiment over time helps you understand your market position and adjust your marketing and customer service strategies accordingly.
Metrics for Long-Term Growth
For sustainable business success, it’s essential to focus on long-term growth rather than short-term gains. Metrics for long-term growth help you forecast future performance, identify emerging trends, and assess whether your business is scalable to meet increasing demand.
Sales Forecasting
Sales forecasting is the process of estimating future sales based on historical data, market trends, and business conditions. Accurately forecasting sales is crucial for setting realistic goals, managing inventory, planning marketing efforts, and allocating resources effectively.
The formula for sales forecasting can vary depending on the method used, but a simple approach involves using historical sales data to project future sales growth.
Formula:
Sales Forecast = Previous Period Sales x (1 + Growth Rate)
For example, if last year your sales were $200,000 and you expect a 10% growth rate, your sales forecast for this year would be:
$200,000 x (1 + 0.10) = $220,000
Sales forecasting helps you anticipate potential challenges and opportunities, align operational resources, and plan for growth. Having an accurate forecast allows you to adjust your business strategy as market conditions evolve.
Trend Analysis and Predictive Analytics
Trend analysis and predictive analytics focus on analyzing data over time to identify patterns and predict future outcomes. These metrics help you understand market behaviors, customer preferences, and industry shifts that could impact your business. By identifying trends early, you can adjust your strategies to capitalize on emerging opportunities or mitigate potential risks.
Trend analysis often involves looking at historical data for key metrics, such as sales or customer acquisition, to spot patterns. Predictive analytics takes it a step further by using statistical algorithms and machine learning to forecast future trends.
For example, if you track the seasonality of sales over several years, you may notice a consistent increase in sales during the holiday season. Predictive analytics can help you forecast how much demand will increase and allow you to adjust your inventory and staffing accordingly.
The formula for simple trend analysis can be:
Formula:
Trend Growth = (Value at End of Period – Value at Start of Period) / Value at Start of Period x 100
For example, if your sales were $50,000 last year and increased to $60,000 this year, the growth rate would be:
($60,000 – $50,000) / $50,000 x 100 = 20%
This trend shows that your sales grew by 20%. Using predictive analytics, you could forecast similar growth rates in the future and make data-driven decisions to support that growth.
Expansion and Scalability Metrics
As your business grows, you need to assess its ability to scale effectively. Expansion and scalability metrics help you evaluate whether your business operations, infrastructure, and resources can support increased demand. These metrics focus on assessing your capacity for growth in terms of physical space, labor, technology, and capital.
Key scalability metrics include assessing how your current systems will handle more sales volume, increased customer service needs, and expanded inventory management. These metrics can also help you evaluate the cost-effectiveness of scaling your business.
The formula for assessing scalability is typically a combination of financial and operational measures. One common metric for scalability is the cost-to-serve ratio, which measures the cost of providing goods or services to your customers relative to your revenue.
Formula:
Cost-to-Serve Ratio = Total Operating Costs / Total Revenue
For example, if your operating costs are $100,000 and your total revenue is $500,000, the cost-to-serve ratio would be:
$100,000 / $500,000 = 0.2
A cost-to-serve ratio of 0.2 means that for every dollar in revenue, you spend 20 cents on operations. Tracking this ratio can help you determine whether your business can scale effectively. If the cost-to-serve ratio increases as you scale, you may need to find efficiencies or adjust your strategy to ensure profitable growth.
Expansion and scalability metrics provide essential insights into whether your business can handle growth without sacrificing profitability, customer satisfaction, or operational efficiency.
Examples of Retail Metrics in Action
Retail metrics are powerful tools for understanding your business and improving performance. Let’s explore a few examples of how specific metrics can provide insights and lead to actionable strategies. By seeing these metrics in action, you can better understand how they work and how to apply them to your own retail operations.
Example 1: Sales Performance and Total Sales
Imagine you run a boutique clothing store, and you’re tracking total sales each month. Let’s say you’ve just completed the month of September with $50,000 in sales. This metric gives you an immediate snapshot of how much revenue your business generated.
But when you compare these total sales to the same month last year, you see that September 2023’s sales were $40,000. This year’s total sales reflect a 25% growth—an excellent sign that your efforts to boost sales, such as a seasonal promotion or improved product mix, are working.
Calculation:
Sales Growth = (Current Period Sales – Previous Period Sales) / Previous Period Sales x 100
Sales Growth = ($50,000 – $40,000) / $40,000 x 100 = 25%
This insight encourages you to keep pursuing similar strategies that are delivering strong results, while also identifying areas where you can improve even further.
Example 2: Inventory Management and Inventory Turnover
You operate a furniture store, and you’re keen on optimizing your inventory to ensure you’re not overstocked or understocked. Let’s assume your store’s average inventory over the past quarter was $100,000, and your cost of goods sold (COGS) during that time was $300,000.
Using the inventory turnover metric, you can calculate how many times your inventory turned over in the last quarter. This can help determine if you’re moving product efficiently or if certain items need to be restocked more quickly.
Formula:
Inventory Turnover = Cost of Goods Sold / Average Inventory
Inventory Turnover = $300,000 / $100,000 = 3
An inventory turnover of 3 indicates that your store is selling through its inventory every three months. If you were aiming for a higher turnover, this could suggest that certain products are moving too slowly, and you may need to adjust pricing, promotions, or product offerings to boost sales.
Example 3: Customer Retention and Customer Lifetime Value (CLV)
Imagine you run an online beauty brand and you want to understand how much value each customer brings to your business over their lifetime. By tracking Customer Lifetime Value (CLV), you can make better decisions about marketing spend and customer retention strategies. Let’s say that your average customer spends $40 per purchase, makes four purchases per year, and stays with your brand for three years.
Formula:
CLV = Average Purchase Value x Purchase Frequency x Customer Lifespan
CLV = $40 x 4 x 3 = $480
This means each customer is expected to generate $480 in revenue over the course of their relationship with your brand. With this information, you can assess how much to spend on acquiring new customers, while ensuring that you’re nurturing and retaining existing ones to maximize the value they bring to your business.
Example 4: Operational Efficiency and Shrinkage Rate
You manage a chain of retail stores, and you’re focused on reducing inventory loss due to theft or damage. Over the past year, your stores experienced inventory shrinkage totaling $15,000, and the value of your total inventory at the start of the year was $500,000. By calculating your shrinkage rate, you can better understand the extent of your losses and take steps to reduce them.
Formula:
Shrinkage Rate = Inventory Loss / Total Inventory x 100
Shrinkage Rate = $15,000 / $500,000 x 100 = 3%
A shrinkage rate of 3% indicates that you’re losing 3% of your inventory to theft, damage, or other factors. This is a valuable insight that can lead you to implement tighter security measures, improve employee training, or optimize inventory tracking systems to reduce shrinkage and improve profitability.
Example 5: Marketing Impact and Conversion Rate
You run an online store and have been running a paid advertising campaign on social media. Your ad has been seen by 10,000 people, and out of that, 300 clicked through to your website and made a purchase. By calculating your conversion rate, you can determine how effective your ad is in driving sales.
Formula:
Conversion Rate = (Number of Sales / Number of Visitors) x 100
Conversion Rate = (300 / 10,000) x 100 = 3%
A 3% conversion rate means that for every 100 visitors to your site, three are making a purchase. If you find that your conversion rate is lower than expected, you might want to refine your ad targeting, improve your landing page, or adjust your offers to make the sales process smoother.
These examples show how different retail metrics can offer valuable insights into your business operations. By applying them, you can better understand where you’re succeeding and where there’s room for improvement. Tracking the right metrics at the right time empowers you to make informed decisions that support your business’s growth and sustainability.
Conclusion
In the fast-paced world of retail, knowing your numbers can make all the difference. By tracking the right metrics, you gain valuable insights into every aspect of your business—from sales performance and customer satisfaction to inventory management and profitability. These metrics are your business’s heartbeat, giving you the ability to adjust strategies, improve operations, and stay ahead of the competition. The more you understand your data, the better equipped you’ll be to make decisions that drive growth and long-term success.
Remember, retail metrics are not just about numbers; they’re about turning information into action. Whether it’s adjusting pricing, improving customer service, or optimizing inventory, the metrics guide your next steps. As your business evolves, so too should the metrics you focus on. Regularly reviewing and adjusting your strategies based on these numbers ensures that you’re always moving forward. Keep a close eye on the key metrics that matter most to your business, and use them as a powerful tool to unlock your full potential.
Get Started With a Prebuilt Template!
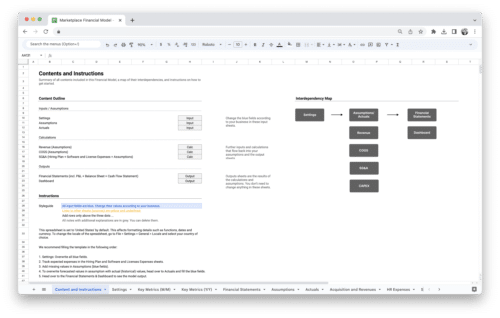
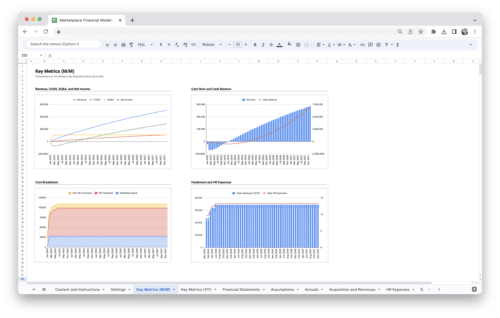
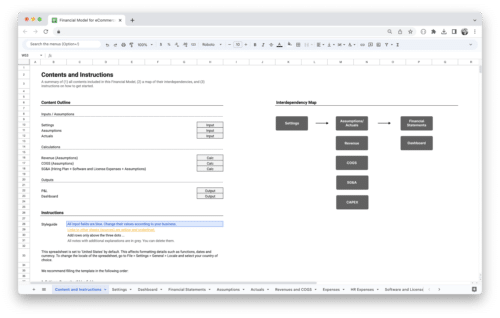
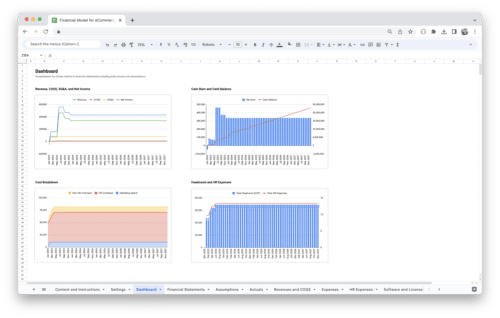
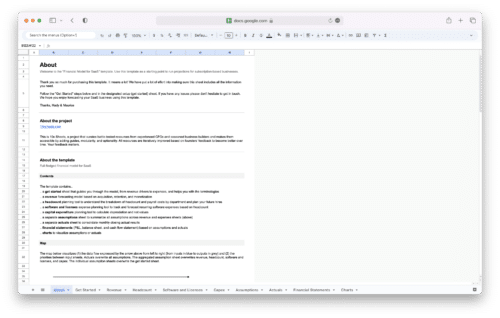
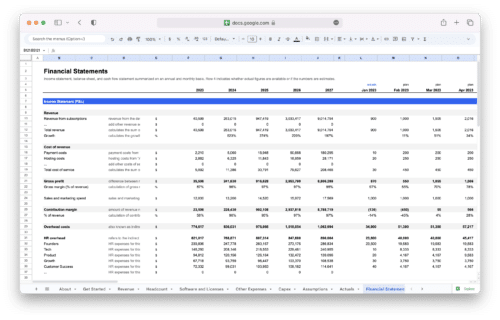
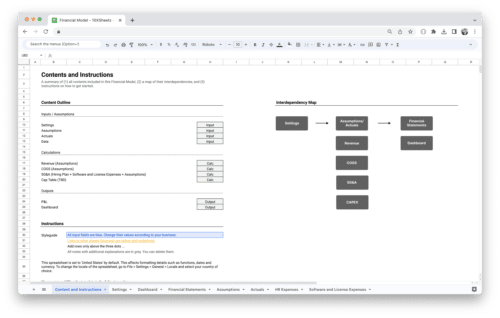
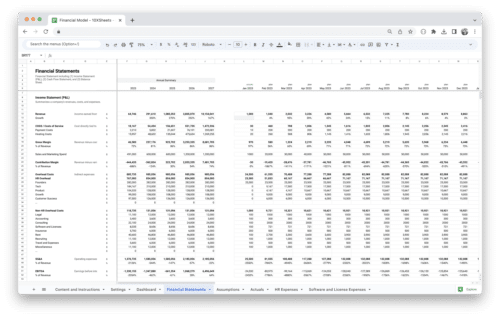
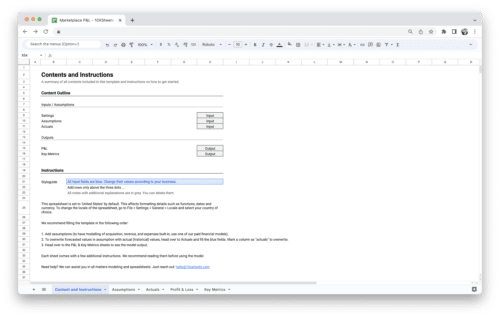
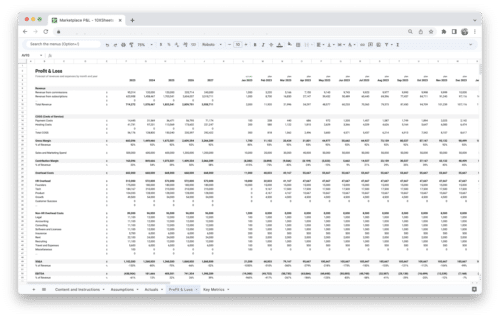
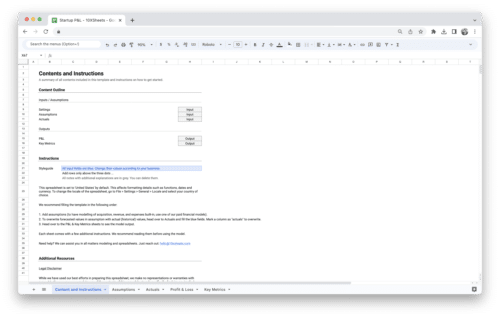
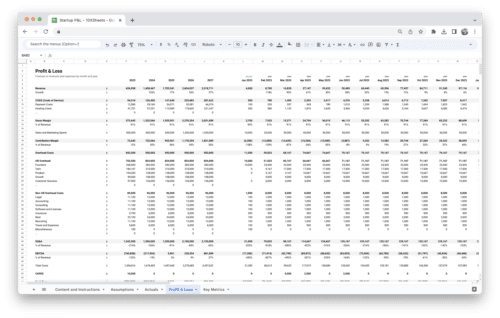
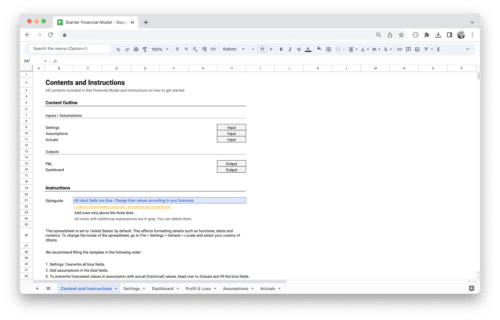
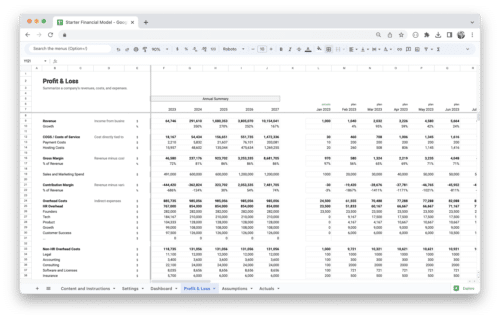
Looking to streamline your business financial modeling process with a prebuilt customizable template? Say goodbye to the hassle of building a financial model from scratch and get started right away with one of our premium templates.
- Save time with no need to create a financial model from scratch.
- Reduce errors with prebuilt formulas and calculations.
- Customize to your needs by adding/deleting sections and adjusting formulas.
- Automatically calculate key metrics for valuable insights.
- Make informed decisions about your strategy and goals with a clear picture of your business performance and financial health.

