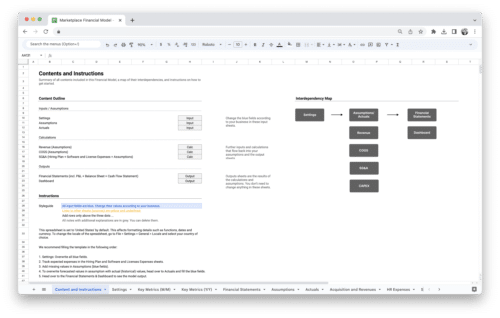
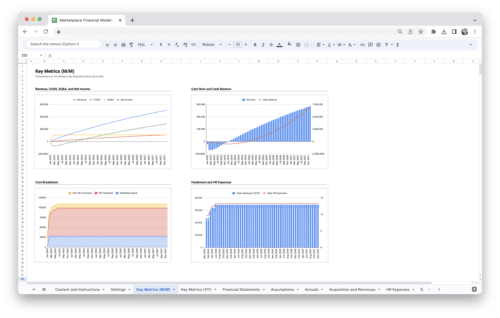
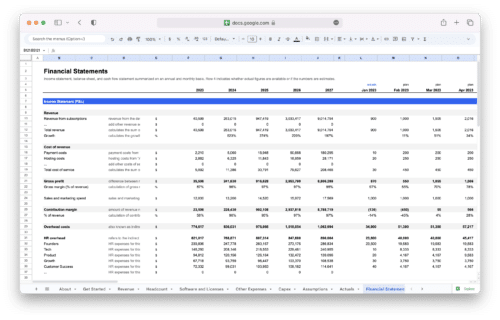
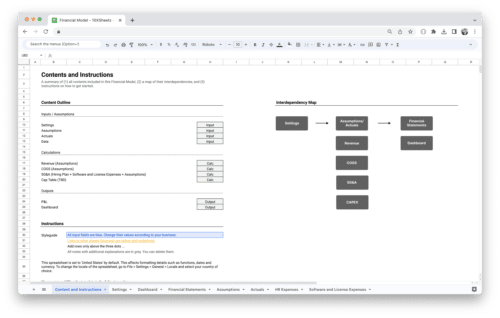
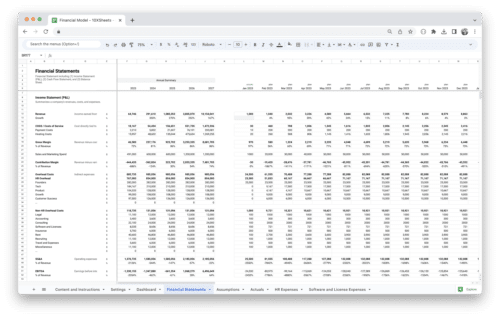
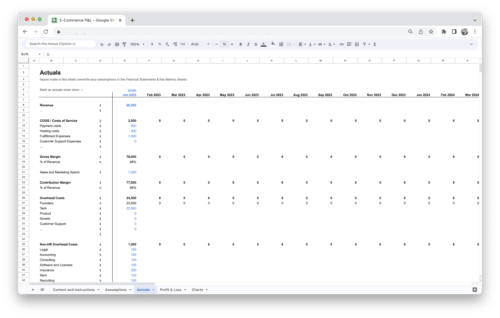
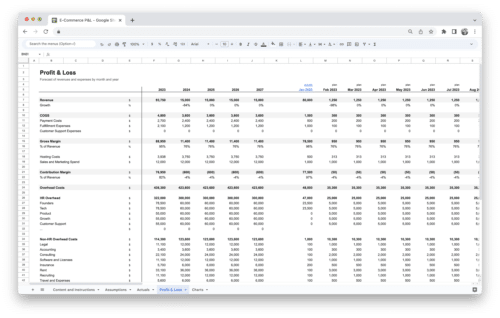
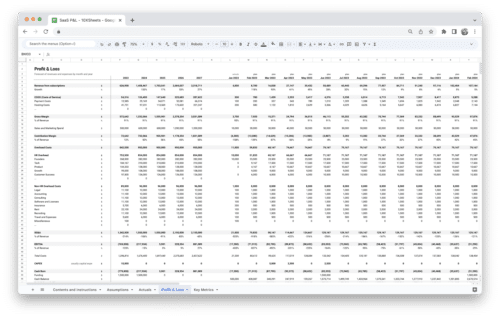
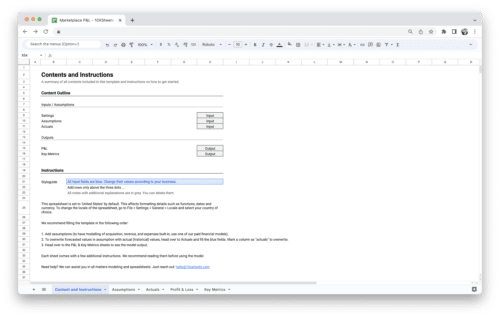
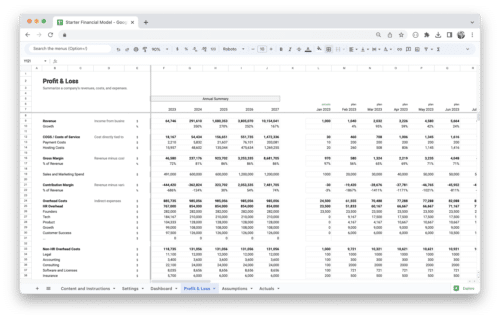
Get Started With a Prebuilt Model

Start with a free template and upgrade when needed.

Ever wondered what fuels the success of top-tier Software as a Service (SaaS) businesses? The answer lies in their mastery of key SaaS metrics and Key Performance Indicators (KPIs). These metrics are the secret sauce behind data-driven decisions, strategic growth, and the ability to thrive in the ever-evolving world of subscription-based services. In this guide, we’ll take you on a journey through the intricate landscape of SaaS metrics, equipping you with the knowledge to navigate your SaaS venture towards prosperity.

What are SaaS Metrics and KPIs?

SaaS Metrics and Key Performance Indicators (KPIs) are essential tools for monitoring, analyzing, and optimizing the performance of Software as a Service (SaaS) businesses. These metrics provide valuable insights into various aspects of your SaaS operation, enabling data-driven decision-making and strategic planning.

The Importance of SaaS Metrics and KPIs

SaaS Metrics and KPIs are not mere numbers; they are the lifeline of your SaaS business. Here’s why they matter:

  1. Data-Driven Decisions: SaaS metrics and KPIs provide you with real-time data about your business’s health. This data empowers you to make informed decisions based on facts rather than assumptions.
  2. Visibility and Accountability: These metrics offer transparency into every facet of your SaaS business, from customer acquisition costs to revenue growth. They hold teams and individuals accountable for their performance.
  3. Strategic Planning: By tracking relevant metrics, you can identify trends and patterns in user behavior, sales, and marketing. This information is invaluable for crafting and adjusting your business strategy.
  4. Resource Allocation: Knowing which metrics are most critical helps you allocate resources efficiently. You can invest in areas that directly impact your growth and profitability.
  5. User-Centric Approach: SaaS metrics often revolve around user behavior and satisfaction. Monitoring these metrics allows you to focus on improving the user experience and increasing customer satisfaction.
  6. Scaling and Optimization: As your SaaS business grows, metrics become even more vital for scaling operations and optimizing processes. They provide benchmarks for setting performance goals and evaluating success.
  7. Competitive Edge: Staying ahead of competitors requires a deep understanding of your market and customers. SaaS metrics help you analyze your position and differentiate your offering.

SaaS Metrics and KPIs are the compass that guides your SaaS business toward success. They enable you to navigate the complex landscape of subscription-based services, adapt to changing market conditions, and continually improve your product and services to meet user needs.

Key Metrics for Customer Acquisition

In the competitive world of SaaS, understanding the metrics that drive customer acquisition is vital. These metrics help you determine the effectiveness of your marketing and sales efforts, ensuring you’re acquiring customers efficiently and maximizing their value.

Customer Acquisition Cost (CAC)

Customer Acquisition Cost (CAC) is the cornerstone of customer acquisition metrics. It tells you how much it costs to acquire a new customer. To calculate CAC, consider the total cost of your sales and marketing efforts over a specific period and divide it by the number of new customers acquired in the same period.

Formula:

CAC = Total Sales and Marketing Expenses / Number of New Customers Acquired

A high CAC can be a warning sign, indicating that your customer acquisition strategy might be too expensive. Strive to optimize this cost while maintaining the quality of acquired customers.

Customer Lifetime Value (CLTV)

Customer Lifetime Value (CLTV) represents the total revenue a customer is expected to generate during their entire relationship with your company. Calculating CLTV is essential because it helps you understand the long-term value of acquiring a customer.

Formula:

CLTV = Average Revenue Per User (ARPU) x Average Customer Lifespan

By focusing on CLTV, you can make more informed decisions about how much you’re willing to invest in acquiring and retaining customers.

CAC to CLTV Ratio

The CAC to CLTV Ratio is a key metric that compares the cost of acquiring a customer (CAC) to the revenue that customer is expected to generate (CLTV). A ratio less than 1 is considered healthy, as it indicates that you’re earning more from a customer over their lifetime than what it cost to acquire them.

Calculating this ratio helps you assess the efficiency of your customer acquisition strategy and make adjustments as needed to maintain a healthy balance.

Churn Rate

Churn Rate is the percentage of customers who stop using your SaaS product or service over a specific period. It’s crucial to monitor churn closely because it directly impacts your customer base and revenue.

Formula:

Churn Rate = (Customers at the Start of the Period - Customers at the End of the Period) / Customers at the Start of the Period

A high churn rate can erode the gains from customer acquisition efforts. Identifying the reasons behind churn and taking steps to reduce it is essential for long-term success.

Net Promoter Score (NPS)

Net Promoter Score (NPS) is a metric that measures customer satisfaction and loyalty by asking a simple question: “On a scale of 0 to 10, how likely are you to recommend our product/service to a friend or colleague?”

A high NPS score indicates satisfied customers who are not only likely to stay but also to promote your product to others. NPS surveys provide valuable qualitative insights into your customers’ feelings and perceptions, enabling you to make improvements where needed.

By focusing on these customer acquisition metrics, you can fine-tune your strategies, reduce costs, and increase the value of every customer you acquire, ultimately driving the growth of your SaaS business.

Metrics for Revenue and Growth

In the dynamic landscape of SaaS businesses, understanding and optimizing revenue and growth metrics are essential for sustainable success. These metrics provide insights into the health of your subscription-based model and help you make informed decisions to drive growth.

Monthly Recurring Revenue (MRR)

Monthly Recurring Revenue (MRR) is a foundational metric for SaaS companies. It represents the total revenue you expect to receive from your customers every month, primarily from subscription fees. MRR offers a clear view of your regular income stream, making it easier to predict and manage your cash flow.

To calculate MRR, sum up the subscription fees from all your customers.

MRR = Subscription Fee of Customer 1 + Subscription Fee of Customer 2 + …

By monitoring MRR, you can quickly identify trends, such as growth or decline, and respond proactively to changes in your revenue stream.

Annual Recurring Revenue (ARR)

Annual Recurring Revenue (ARR) is an extension of MRR, calculated on an annual basis. It’s an important metric for SaaS businesses that bill customers annually instead of monthly. ARR helps you forecast long-term revenue and is particularly valuable for financial planning and investor relations.

Calculate ARR by multiplying your MRR by 12:

ARR = MRR x 12

Having a clear understanding of your ARR allows you to plan for the year ahead and make informed decisions about scaling your business.

Churn MRR (CMRR)

Churn MRR (CMRR) focuses on the revenue lost due to churn in a given month. Churn occurs when customers cancel their subscriptions or reduce their usage of your service. CMRR provides valuable insights into the impact of churn on your monthly revenue.

To calculate CMRR, sum up the MRR from customers who have churned:

CMRR = Churned Customers MRR

By tracking CMRR, you can assess the financial implications of customer losses and take measures to reduce churn and retain valuable customers.

Expansion MRR (EMRR)

Expansion MRR (EMRR) measures the additional revenue generated from existing customers through upselling, cross-selling, or expanding their usage of your product. It reflects the growth potential within your existing customer base.

Calculate EMRR by summing the revenue generated from upselling, cross-selling, or expanded usage:

EMRR = Upsell MRR + Cross-sell MRR + Expansion in Usage MRR

A positive EMRR indicates that you are effectively monetizing your existing customer relationships and driving growth from within.

Gross and Net Revenue Churn

Gross Churn measures the total revenue lost due to customer churn. It’s a straightforward calculation that quantifies the impact of customer departures on your revenue.

Net Revenue Churn goes a step further by accounting for expansion MRR within the same period. This metric gives you a more balanced view of your revenue health.

The formula for Net Revenue Churn is:

Net Revenue Churn = (Gross Churn – Expansion MRR) / MRR at the Start of the Month

Understanding both gross and net churn helps you manage your customer base effectively. A negative net revenue churn rate indicates that the growth from existing customers outweighs the losses from churn, which is a strong indicator of a healthy SaaS business.

By focusing on these revenue and growth metrics, you can gain deeper insights into your SaaS business’s financial performance, identify areas for improvement, and make strategic decisions to drive sustainable growth.

User Engagement and Adoption Metrics

When it comes to SaaS success, it’s not just about acquiring customers but also about keeping them engaged and satisfied. User engagement and adoption metrics are crucial for assessing how well your product resonates with your audience and ensuring that they continue to benefit from it.

Monthly Active Users (MAU)

Monthly Active Users (MAU) is a key metric that tracks the number of unique users who actively engage with your SaaS product within a given month. This metric provides insights into the popularity and stickiness of your offering.

Tracking MAU allows you to understand how many users are regularly using your product, which features are most popular, and whether your user base is growing or declining over time. By analyzing these patterns, you can tailor your product and marketing strategies to better serve your audience.

Daily Active Users (DAU)

Daily Active Users (DAU) is similar to MAU but focuses on daily engagement. It’s particularly important for products that users interact with frequently, such as productivity tools or communication platforms.

Measuring DAU helps you gauge the intensity of user interaction with your product on a daily basis. It’s a valuable metric for identifying trends in user behavior, which can inform feature enhancements and user retention strategies.

User Churn Rate

User Churn Rate measures the percentage of users who stop using your SaaS product within a specific period. It’s a critical metric for evaluating user retention and satisfaction.

Calculate the User Churn Rate using this formula:

User Churn Rate = (Users at the Start of the Period - Users at the End of the Period) / Users at the Start of the Period

A high User Churn Rate can be alarming as it signifies that users are discontinuing their engagement with your product. Reducing churn is a top priority, and understanding the reasons behind it can guide improvements to your product and customer support.

Feature Adoption Rate

Feature Adoption Rate tracks how quickly users adopt new features or updates in your SaaS product. It’s a vital metric for assessing the success of feature releases and enhancements.

Analyzing Feature Adoption Rate helps you understand if your users are taking advantage of new functionalities and improvements. If adoption is slow, you may need to improve your communication and onboarding processes to highlight the value of these features.

Customer Retention Rate

Customer Retention Rate measures the percentage of customers you’ve retained over a specific period. While it’s similar to User Churn Rate, it focuses on customer relationships as a whole.

Calculate Customer Retention Rate using this formula:

Customer Retention Rate = ((Customers at the End of the Period - New Customers Acquired) / Customers at the Start of the Period) x 100

A high Customer Retention Rate is a strong indicator of customer satisfaction and loyalty. It’s often more cost-effective to retain existing customers than to acquire new ones, making this metric essential for long-term profitability.

By keeping a close eye on these user engagement and adoption metrics, you can gain a deeper understanding of how users interact with your product, identify areas for improvement, and create strategies that enhance user satisfaction and drive long-term growth.

Metrics for Sales and Marketing Efficiency

In the competitive world of SaaS, efficient sales and marketing operations are paramount to success. Understanding and optimizing the metrics that gauge the effectiveness of your customer acquisition strategies is essential for sustainable growth and profitability.

Customer Acquisition Cost (CAC)

Customer Acquisition Cost (CAC) is a critical metric that reveals the cost associated with acquiring a new customer. Calculating CAC helps you evaluate the efficiency of your sales and marketing efforts and determine whether they are cost-effective.

To calculate CAC, divide your total sales and marketing expenses within a specific period by the number of new customers acquired during the same period.

CAC Formula:

CAC = Total Sales and Marketing Expenses / Number of New Customers Acquired

A high CAC relative to the revenue generated by a customer (CLTV) suggests inefficiencies in your acquisition strategy. Reducing CAC while maintaining the quality of acquired customers is a key goal for SaaS businesses.

Customer Acquisition Rate

Customer Acquisition Rate measures how quickly you are acquiring new customers. This metric provides insights into the effectiveness of your marketing and sales campaigns and your ability to attract and convert leads into paying customers.

Tracking this rate allows you to assess the impact of your marketing efforts and evaluate your sales team’s performance. A higher acquisition rate typically indicates successful marketing strategies.

Sales Conversion Rate

Sales Conversion Rate is a fundamental metric for your sales team’s effectiveness. It measures the percentage of leads or prospects that convert into paying customers. A higher conversion rate indicates that your sales team is skilled at closing deals.

To calculate the Sales Conversion Rate, divide the number of conversions by the total number of leads or prospects and multiply by 100 to express it as a percentage.

Sales Conversion Rate Formula:

Sales Conversion Rate = (Number of Conversions / Total Number of Leads or Prospects) x 100

Optimizing your sales process to improve this rate can significantly impact your revenue growth.

Marketing Conversion Rate

Marketing Conversion Rate evaluates the effectiveness of your marketing campaigns in converting leads into customers. It measures the percentage of leads who take the desired action, such as signing up for a trial or requesting more information.

To calculate the Marketing Conversion Rate, divide the number of conversions from your marketing efforts by the total number of leads generated through those efforts and multiply by 100.

Marketing Conversion Rate Formula:

Marketing Conversion Rate = (Number of Marketing Conversions / Total Number of Marketing Leads) x 100

A higher marketing conversion rate signifies the success of your marketing strategies in attracting and engaging potential customers.

Customer Lifetime Value (CLTV) to CAC Ratio

The Customer Lifetime Value (CLTV) to CAC Ratio is a crucial metric that assesses the balance between the value a customer brings over their lifetime and the cost of acquiring that customer. A ratio greater than 1 indicates that your customer acquisition efforts are efficient and profitable.

Formula:

CLTV to CAC Ratio = CLTV / CAC

A high CLTV to CAC ratio indicates that the long-term value of your customers exceeds the cost of acquiring them, making your business model financially viable and sustainable.

By focusing on these sales and marketing efficiency metrics, you can refine your strategies, reduce acquisition costs, and maximize the value of every customer, ultimately driving the growth and profitability of your SaaS business.

Metrics for Product Performance

The success of your SaaS product depends not only on acquiring customers but also on how well your product performs and satisfies users. Monitoring product performance metrics is crucial for delivering a seamless user experience and achieving long-term success.

User Satisfaction Score

User Satisfaction Score is a key indicator of how happy and content your users are with your SaaS product. It is typically measured through surveys, feedback forms, or ratings provided by users.

To calculate a User Satisfaction Score, you can use a survey with a Likert scale or a Net Promoter Score (NPS) survey. These surveys help gather feedback and opinions directly from users, providing valuable insights into their experience and satisfaction levels.

User satisfaction is essential because satisfied users are more likely to continue using your product, recommend it to others, and become long-term customers. Monitoring this score helps you identify areas for improvement and make informed decisions to enhance user satisfaction.

User Onboarding and Activation Rate

User Onboarding and Activation Rate measures how effectively you guide new users through the initial setup and usage of your SaaS product. It focuses on helping users experience the core value of your product as quickly as possible.

The activation rate is the percentage of new users who successfully complete key actions or reach milestones that indicate they have onboarded and started using your product as intended. These actions can vary depending on your product but may include creating an account, completing a tutorial, or using a core feature.

A high activation rate indicates that your onboarding process is effective in getting users started with your product. By optimizing this process, you can reduce user churn and increase user retention.

Average Revenue Per User (ARPU)

Average Revenue Per User (ARPU) calculates the average revenue generated by each user of your SaaS product. This metric is essential for pricing strategies, revenue optimization, and understanding the financial health of your business.

To calculate ARPU, divide your total revenue by the number of active users during a specific period.

ARPU Formula:

ARPU = Total Revenue / Number of Active Users

ARPU helps you assess the monetization of your user base and identify opportunities to increase revenue through upselling, cross-selling, or adjusting pricing plans.

Customer Support Ticket Volume and Response Time

Customer Support Ticket Volume and Response Time are critical metrics for evaluating the effectiveness of your customer support and service teams.

  • Ticket Volume: This metric tracks the number of support tickets or requests submitted by users within a specific period. A sudden increase in ticket volume may indicate product issues or the need for improved documentation and self-service options.
  • Response Time: Response time measures how quickly your support team responds to user inquiries or issues. Users appreciate timely and helpful responses. Slow response times can lead to frustration and churn.

Efficiently managing customer support by monitoring ticket volume and response time is essential for maintaining user satisfaction and resolving problems promptly.

By focusing on these product performance metrics, you can ensure that your SaaS product delivers a great user experience, retains users, and continues to provide value, ultimately contributing to the long-term success of your business.

Conclusion

SaaS metrics and KPIs are your compass and toolkit for achieving success in the world of subscription-based services. These metrics help you understand your customers, optimize your operations, and make informed decisions that drive growth and profitability. From customer acquisition to product performance, they empower you to stay ahead of the curve, continually improve, and create lasting value for your users. So, embrace the power of data, harness these metrics, and watch your SaaS business thrive in an ever-changing digital landscape.

Remember, the journey to SaaS excellence doesn’t end here. Continuously monitor, analyze, and adapt your strategies based on these key metrics. Keep your users at the forefront of your efforts, and you’ll not only meet their needs but also surpass their expectations. With the right data and insights, you’re well on your way to achieving long-term success in the competitive world of SaaS.

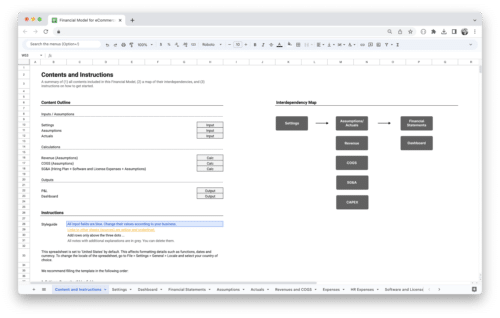
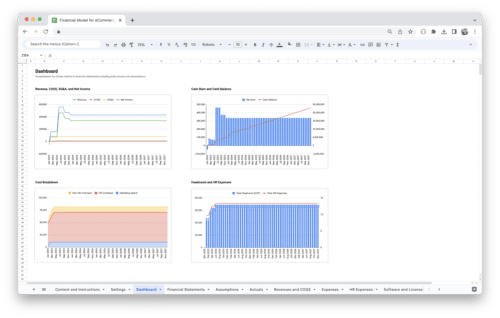
Get Started With a Prebuilt Template!

Looking to streamline your business financial modeling process with a prebuilt customizable template? Say goodbye to the hassle of building a financial model from scratch and get started right away with one of our premium templates.

  • Save time with no need to create a financial model from scratch.
  • Reduce errors with prebuilt formulas and calculations.
  • Customize to your needs by adding/deleting sections and adjusting formulas.
  • Automatically calculate key metrics for valuable insights.
  • Make informed decisions about your strategy and goals with a clear picture of your business performance and financial health.