- What is Horizontal Analysis?
- Why is Horizontal Analysis Important in Financial Analysis?
- Understanding Horizontal Analysis
- How to Perform Horizontal Analysis?
- How to Interpret Horizontal Analysis Results?
- Key Metrics and Ratios in Horizontal Analysis
- Advantages and Limitations of Horizontal Analysis
- Industry Benchmarking and Peer Analysis
- Horizontal Analysis Best Practices
- Horizontal Analysis Examples
- Conclusion
Financial analysis plays a crucial role in assessing the performance and financial health of a company. One essential technique in financial analysis is horizontal analysis, which allows you to analyze and interpret changes in financial statement data over time. In this guide, we will provide you with a comprehensive understanding of horizontal analysis, its significance, and how to conduct it effectively.
What is Horizontal Analysis?
Horizontal analysis, also known as trend analysis, is a financial analysis technique that compares and evaluates the changes in financial statement data over a specific period. It involves analyzing year-to-year variations in financial metrics to identify trends, patterns, and shifts in a company’s financial performance. By examining the historical data and calculating percentage changes, horizontal analysis helps in understanding the direction and magnitude of changes, enabling informed decision-making and strategic planning.
Why is Horizontal Analysis Important in Financial Analysis?
Horizontal analysis plays a crucial role in financial analysis for several reasons:
- Identification of Trends and Patterns: Horizontal analysis helps identify long-term trends and patterns in financial data. By analyzing year-to-year changes, it becomes possible to understand the overall trajectory of a company’s financial performance, whether it is experiencing consistent growth, stability, or decline.
- Assessment of Financial Performance: Examining changes in key financial metrics over time allows for an assessment of a company’s financial performance. It helps gauge the effectiveness of revenue generation, expense management, and profitability. Horizontal analysis provides insights into a company’s ability to generate sustainable growth and maintain financial health.
- Detection of Anomalies and Red Flags: By conducting horizontal analysis, analysts can identify anomalies or deviations from expected trends. Unusual fluctuations or unexpected patterns may indicate underlying issues that require further investigation. Horizontal analysis serves as an alert mechanism for potential financial irregularities or risks.
- Comparative Analysis: It enables the comparison of financial data across different periods, facilitating benchmarking and industry analysis. By comparing a company’s performance to industry peers or historical performance, it becomes possible to evaluate relative strengths, weaknesses, and areas of improvement. This comparative perspective provides valuable insights for decision-making and goal setting.
- Strategic Planning and Forecasting: Horizontal analysis assists in strategic planning by providing a historical context for future projections. Understanding past trends and patterns allows companies to make more accurate forecasts, set realistic goals, and develop effective strategies for growth, cost management, and risk mitigation.
- Investor and Stakeholder Communication: It helps in effectively communicating a company’s financial performance to investors and stakeholders. It provides a clear picture of the company’s historical growth, stability, and financial position, instilling confidence and transparency. This analysis aids in building trust and attracting potential investors and stakeholders.
Overall, horizontal analysis is a valuable tool in financial analysis as it allows for the identification of trends, assessment of performance, detection of anomalies, comparative analysis, strategic planning, and effective communication. By leveraging the insights gained from horizontal analysis, businesses can make informed decisions, mitigate risks, and drive sustainable growth.
Understanding Horizontal Analysis
How to Do Horizontal Analysis?
Horizontal analysis, also known as trend analysis, involves the comparison of financial statement data across multiple periods to identify trends, patterns, and changes. By examining year-to-year changes in key financial metrics, you can gain insights into a company’s growth, stability, and overall performance.
To perform horizontal analysis, follow these steps:
- Selecting the Financial Statements to Analyze: Choose the relevant financial statements, such as the income statement, balance sheet, and cash flow statement, based on the specific analysis goals.
- Gathering Historical Financial Data: Collect the financial data for the selected periods.
- Adjusting for Inflation (if applicable): If inflation has affected the financial data, adjust the figures using appropriate inflation adjustment methods.
- Calculating Year-to-Year Changes: Calculate the percentage change between the data points for each period, highlighting the variations.
- Analyzing and Interpreting the Results: Analyze the trends, patterns, and variations to gain insights into the company’s financial performance.
Key Objectives of Horizontal Analysis
Horizontal analysis serves several important objectives in financial analysis:
- Identifying Trends and Patterns: By comparing financial data over time, you can identify recurring trends, cyclical patterns, and anomalies that may impact business operations.
- Assessing Financial Performance: Horizontal analysis helps assess a company’s financial performance by examining changes in revenues, expenses, profits, assets, and liabilities.
- Evaluating Business Stability: Analyzing trends in financial ratios and metrics can provide insights into a company’s stability and ability to withstand economic fluctuations.
- Supporting Decision-Making: Horizontal analysis offers valuable information for decision-making processes, such as budgeting, forecasting, and strategic planning.
Types of Data Used in Horizontal Analysis
Horizontal analysis involves the analysis of various financial statements:
- Income Statement Analysis: Analyzing changes in revenues, expenses, and net income over time.
- Balance Sheet Analysis: Examining changes in assets, liabilities, and equity from one period to another.
- Cash Flow Statement Analysis: Assessing variations in cash inflows and outflows, operating activities, investing activities, and financing activities.
How to Perform Horizontal Analysis?
To conduct horizontal analysis effectively, follow this step-by-step process:
Step 1: Selecting the Financial Statements to Analyze
Start by choosing the financial statements that are relevant to your analysis objectives. Consider which statements provide the most meaningful insights based on your analysis goals.
Step 2: Gathering Historical Financial Data
Collect the historical financial data for the selected periods. Ensure the accuracy and completeness of the data, as any inaccuracies can affect the analysis results.
Step 3: Adjusting for Inflation (if applicable)
If inflation has influenced the financial data, it is essential to adjust the figures to account for its impact. One common method is using an inflation index or Consumer Price Index (CPI) to calculate the inflation-adjusted values.
Step 4: Calculating Year-to-Year Changes
Calculate the year-to-year changes by comparing the financial data for each period. This can be done by using the following formula:
(CurrentPeriodValue−PreviousPeriodValue)/PreviousPeriodValue×100
For example, to calculate the percentage change in revenue:
(2021 Revenue− 2020 Revenue)/2020 Revenue×100
Step 5: Analyzing and Interpreting the Results
Analyze the calculated percentage changes and interpret the results. Look for significant variations, both positive and negative, and identify any trends or patterns that emerge.
How to Interpret Horizontal Analysis Results?
When interpreting the results of horizontal analysis, consider the following key aspects:
Identifying Trends and Patterns
Analyzing the year-to-year changes helps identify long-term trends and patterns. Look for consistent positive or negative changes in financial metrics to assess the overall direction and performance of the company.
Analyzing Year-to-Year Changes
Carefully examine the percentage changes to understand the magnitude and significance of variations. Look for major fluctuations that may indicate critical events or shifts in the company’s operations.
Evaluating the Significance of Variations
Not all variations in financial metrics are equally significant. Evaluate the size of the changes relative to the company’s size, industry benchmarks, and historical performance. Smaller variations may be within an acceptable range, while larger variations may require further investigation.
Assessing Business Performance and Financial Health
Horizontal analysis provides insights into a company’s financial performance and health. By assessing the changes in revenues, expenses, profits, assets, and liabilities, you can gauge the overall financial well-being of the organization.
Key Metrics and Ratios in Horizontal Analysis
Several key metrics and ratios are used in horizontal analysis to evaluate financial performance:
Common-Size Statements
Common-size financial statements express each line item as a percentage of a base amount, typically total revenue or total assets. This allows for easy comparison and identification of trends across different periods.
Percentage Changes
Percentage changes show the year-to-year variations in financial metrics and help determine the growth or decline rate of the company’s performance.
Compound Annual Growth Rate (CAGR)
CAGR measures the average annual growth rate of a financial metric over a specific period. It helps determine the consistent growth rate, smoothing out fluctuations in year-to-year changes.
Variance Analysis
Variance analysis compares actual financial performance with the expected or budgeted performance. By identifying and analyzing variances, you can gain insights into the factors driving the deviations from the planned targets.
Trend Analysis
Trend analysis examines the direction and magnitude of changes in financial metrics over an extended period. It helps identify recurring patterns and assess the long-term performance of the company.
Advantages and Limitations of Horizontal Analysis
Advantages of Horizontal Analysis
Horizontal analysis offers several advantages in financial analysis:
- Trend Identification: It helps identify long-term trends, patterns, and cycles in financial performance.
- Comparative Analysis: It allows for easy comparison of financial data across multiple periods.
- Performance Evaluation: It provides insights into the company’s financial performance and helps assess its growth and stability over time.
- Decision Support: It offers valuable information for decision-making processes, such as budgeting, forecasting, and strategic planning.
Horizontal Analysis Limitations and Challenges
Despite its benefits, horizontal analysis has some limitations and challenges that need to be considered:
- Seasonal Variations: Seasonal fluctuations in business operations can impact the accuracy of year-to-year comparisons.
- Inflationary Effects: Inflation can distort the analysis results if not properly adjusted.
- Changes in Accounting Methods: Changes in accounting methods between periods can affect the comparability of financial data.
- Comparability Issues: Differences in business models, industry dynamics, and company size can make comparisons across companies challenging.
Industry Benchmarking and Peer Analysis
To gain further insights from horizontal analysis, consider industry benchmarking and peer analysis:
Comparing Financial Performance to Industry Averages
Benchmark the company’s financial performance against industry averages or key competitors. This helps identify areas where the company excels or lags behind the industry norms.
Analyzing Competitors’ Financial Statements
Analyze the financial statements of key competitors to gain a broader understanding of industry dynamics and identify areas for improvement or potential competitive advantages.
Using Ratios for Comparative Analysis
Utilize financial ratios, such as profitability ratios, liquidity ratios, and solvency ratios, to compare the company’s financial performance with industry benchmarks and competitors. This provides a comprehensive view of the company’s relative strengths and weaknesses.
Horizontal Analysis Best Practices
To ensure accurate and meaningful results in horizontal analysis, follow these best practices:
Data Quality and Accuracy
- Use reliable and up-to-date financial data for analysis.
- Ensure data accuracy by verifying the information from credible sources.
Consistency in Financial Reporting
- Use consistent accounting methods and policies across all periods.
- Avoid changes in reporting standards or practices that may affect comparability.
Comparative Analysis Across Multiple Years
- Include multiple years of data for a comprehensive analysis.
- Consider the company’s historical performance trends for a more accurate assessment.
Regular Monitoring and Trend Analysis
- Continuously monitor and update the financial data to track ongoing trends.
- Conduct periodic horizontal analysis to assess the changes in financial performance.
Incorporating Qualitative Factors
- Consider qualitative factors, such as market trends, industry developments, and company-specific events, to provide context and deeper insights into the analysis.
Horizontal Analysis Examples
To further illustrate the practical application of horizontal analysis, let’s explore a few more examples that showcase its effectiveness in assessing financial performance and identifying trends.
Example 1: Revenue Analysis for Company A
Let’s consider Company A, a technology firm, and analyze its revenue trends over a five-year period using horizontal analysis. Here’s a simplified representation of their revenue data:
| Year | Revenue (in millions) |
|---|---|
| 2019 | $100 |
| 2020 | $120 |
| 2021 | $150 |
| 2022 | $180 |
| 2023 | $200 |
By calculating the year-to-year percentage changes, we can assess the revenue growth rates:
- From 2019 to 2020: ($120 – $100) / $100 * 100 = 20%
- From 2020 to 2021: ($150 – $120) / $120 * 100 = 25%
- From 2021 to 2022: ($180 – $150) / $150 * 100 = 20%
- From 2022 to 2023: ($200 – $180) / $180 * 100 = 11.11%
Through horizontal analysis, we observe that Company A has experienced consistent revenue growth over the five-year period. The growth rates of 20%, 25%, 20%, and 11.11% indicate a positive trend in the company’s revenue generation.
Example 2: Expense Analysis for Company B
Let’s consider Company B, a retail company, and analyze its expense trends over a three-year period. Here’s a simplified representation of their expense data:
| Year | Operating Expenses (in millions) |
|---|---|
| 2019 | $50 |
| 2020 | $55 |
| 2021 | $60 |
By calculating the year-to-year percentage changes, we can assess the expense growth rates:
- From 2019 to 2020: ($55 – $50) / $50 * 100 = 10%
- From 2020 to 2021: ($60 – $55) / $55 * 100 = 9.09%
Based on the horizontal analysis, we observe that Company B’s operating expenses have gradually increased over the three-year period. The growth rates of 10% and 9.09% indicate a consistent upward trend in the company’s expenses.
Example 3: Asset Analysis for Company C
Let’s consider Company C, a manufacturing company, and analyze its total assets over a four-year period. Here’s a simplified representation of their asset data:
| Year | Total Assets (in millions) |
|---|---|
| 2019 | $500 |
| 2020 | $550 |
| 2021 | $600 |
| 2022 | $650 |
By calculating the year-to-year percentage changes, we can assess the asset growth rates:
- From 2019 to 2020: ($550 – $500) / $500 * 100 = 10%
- From 2020 to 2021: ($600 – $550) / $550 * 100 = 9.09%
- From 2021 to 2022: ($650 – $600) / $600 * 100 = 8.33%
From the horizontal analysis, we observe that Company C has experienced consistent growth in total assets over the four-year period. The growth rates of 10%, 9.09%, and 8.33% indicate a positive trend in the company’s asset accumulation.
These examples demonstrate how horizontal analysis enables us to identify trends and patterns in various financial metrics. By analyzing changes in revenue, expenses, and assets over time, companies can make informed decisions and better understand their financial performance.
Conclusion
Horizontal analysis is a powerful tool for understanding and evaluating a company’s financial performance over time. By examining year-to-year changes in key financial metrics, you can identify trends, assess stability, and make informed business decisions. Remember to consider industry benchmarks, peer analysis, and best practices to ensure accurate and meaningful results. By incorporating horizontal analysis into your financial analysis toolkit, you can gain valuable insights into your company’s performance and drive strategic growth.
Get Started With a Prebuilt Template!
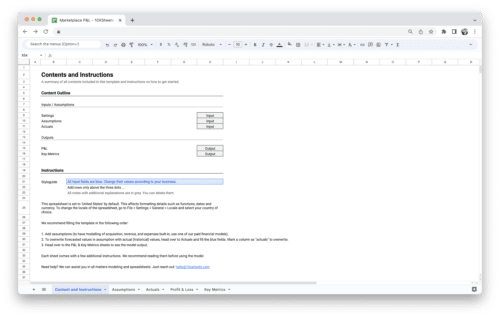
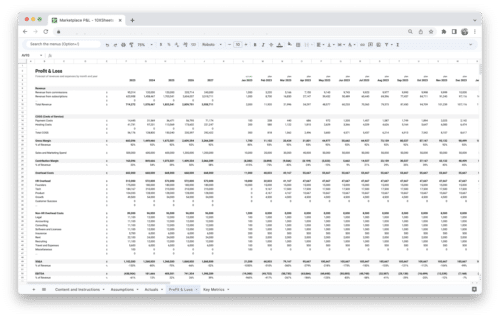
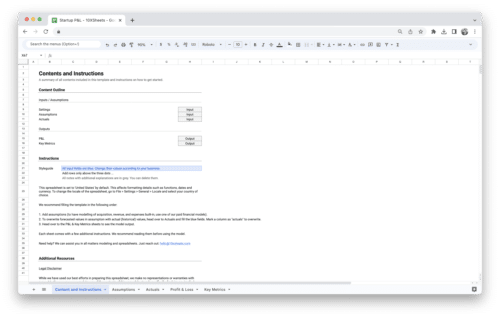
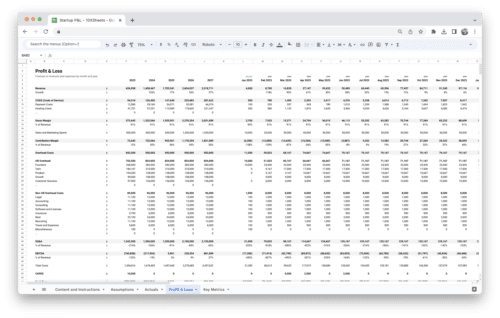
Looking to streamline your business financial modeling process with a prebuilt customizable template? Say goodbye to the hassle of building a financial model from scratch and get started right away with one of our premium templates.
- Save time with no need to create a financial model from scratch.
- Reduce errors with prebuilt formulas and calculations.
- Customize to your needs by adding/deleting sections and adjusting formulas.
- Automatically calculate key metrics for valuable insights.
- Make informed decisions about your strategy and goals with a clear picture of your business performance and financial health.

