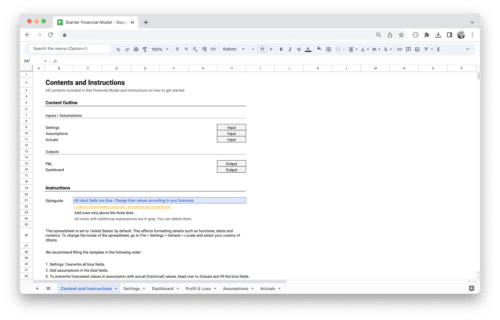
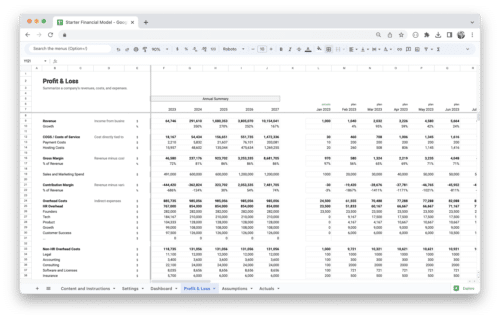
Are you grappling with the decision of choosing the right tool for your financial modeling endeavors? In the realm of spreadsheets, Google Sheets and Excel are two formidable contenders. This guide delves into the strengths, weaknesses, and practical applications of both platforms, equipping you with the knowledge needed to make an informed choice. Whether you’re a financial analyst, business owner, or investor, understanding which tool aligns best with your specific needs is essential for accurate and effective financial modeling.
Overview of Google Sheets and Excel
Before we delve deeper into the comparison and selection process, it’s essential to have a clear understanding of the two key players in this arena: Google Sheets and Excel.
What is Google Sheets?
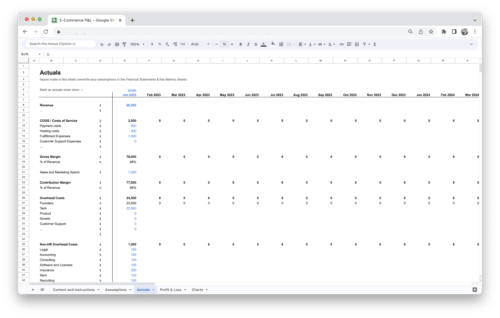
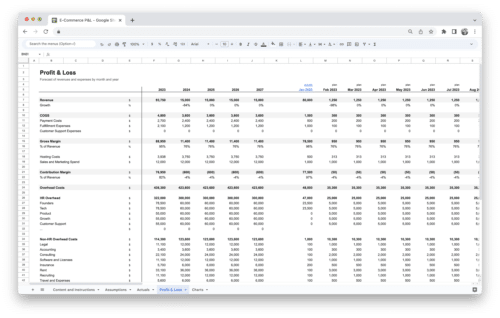
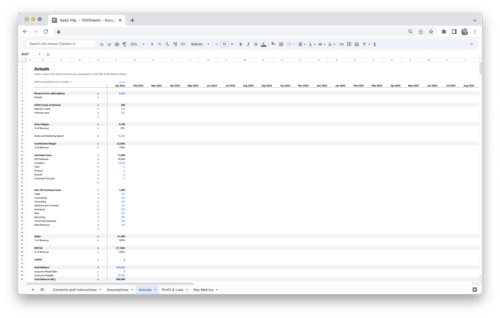
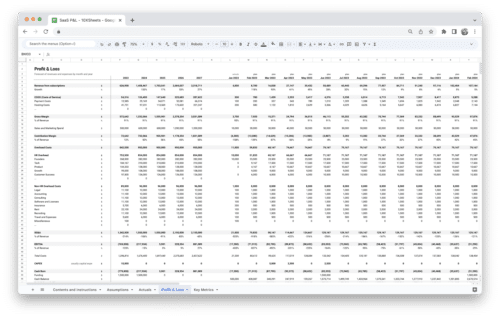
Google Sheets is a web-based spreadsheet application developed by Google. It is part of the Google Workspace suite and offers the convenience of cloud-based computing. This means you can access your spreadsheets from any device with an internet connection. Google Sheets emphasizes collaboration, allowing multiple users to work on the same document simultaneously. It offers a variety of built-in functions, similar to Excel, making it a versatile tool for a wide range of tasks.
What is Excel?
Microsoft Excel, on the other hand, is a well-established spreadsheet software developed by Microsoft. Excel is renowned for its advanced features, extensive library of functions, and versatile data analysis capabilities. It has been the go-to choice for financial professionals, analysts, and businesses for decades. Excel is available both as a desktop application and an online version through Microsoft 365, catering to different user preferences and needs.
Importance of Financial Modeling
Financial modeling is a crucial process used in various domains, including finance, investment, business planning, and decision-making. It involves creating a mathematical representation of a company’s financial performance, typically in the form of a spreadsheet. Financial models enable organizations and individuals to:
- Plan and Forecast: Financial models help in forecasting future financial outcomes based on historical data and assumptions. This is invaluable for budgeting, resource allocation, and setting financial goals.
- Evaluate Investment Opportunities: Investors use financial models to assess the potential returns and risks associated with investment opportunities. Models can determine the profitability of projects, acquisitions, or investments.
- Support Decision-Making: Financial models provide a structured framework for making informed decisions. They enable scenario analysis, allowing users to assess the impact of different strategies or variables on financial outcomes.
- Track Performance: Organizations use financial models to track their actual performance against projected results. This helps in identifying areas that need adjustment or improvement.
- Communicate Financial Insights: Financial models serve as a communication tool, allowing organizations to convey financial insights and plans to stakeholders, investors, and management.
Financial modeling is the backbone of sound financial planning, analysis, and decision-making. The choice between Google Sheets and Excel for financial modeling revolves around selecting the tool that best aligns with your specific requirements and objectives in this critical process.
Google Sheets for Financial Modeling
Now, let’s delve deeper into Google Sheets and explore its features, benefits, limitations, and real-world use cases for financial modeling.
Google Sheets Financial Modeling Features and Benefits
Google Sheets offers a range of features that make it a versatile tool for financial modeling. These include:
- Real-Time Collaboration: Google Sheets allows multiple users to work simultaneously on a single spreadsheet, enabling seamless collaboration. You can see changes in real-time, which is invaluable when working with a team on financial models.
- Cloud-Based Access: One of the standout advantages of Google Sheets is its accessibility from anywhere with an internet connection. No need to worry about carrying your files or being tied to a specific device.
- Built-in Functions: Google Sheets provides a comprehensive set of built-in functions and formulas similar to Excel. From basic arithmetic to statistical analysis, you have the tools you need at your fingertips.
- Cost-Effective: For individuals and small businesses, Google Sheets offers a cost-effective solution. You can start using it for free, and if you need more storage or advanced features, affordable paid plans are available.
Google Sheets Financial Modeling Limitations and Constraints
While Google Sheets has its merits, it also comes with limitations and constraints that may impact its suitability for certain financial modeling tasks:
- Advanced Functionality: Google Sheets may not match Excel’s depth when it comes to advanced financial functions and modeling tools. Complex tasks like Monte Carlo simulations or advanced statistical analysis may require Excel.
- Handling Large Data Sets: When dealing with exceptionally large or complex datasets, Google Sheets can sometimes become slower or less responsive. This could affect the efficiency of your modeling.
- Offline Access: Remember that Google Sheets relies on an internet connection. While this is usually not an issue, it can be a drawback in situations where you don’t have reliable internet access.
Google Sheets Financial Modeling Examples
Now, let’s explore some practical use cases and examples where Google Sheets shines in financial modeling:
Budgeting and Expense Tracking
Whether it’s managing your personal finances or overseeing a company budget, Google Sheets provides a user-friendly platform for creating and tracking budgets. You can easily set up expense categories, input data, and create dynamic visuals to monitor your financial health.
Example: You can use Google Sheets to create a monthly budget that tracks your income, expenses, and savings goals. Formulas can calculate your total spending, savings rate, and help you make informed financial decisions.
Startup Financial Projections
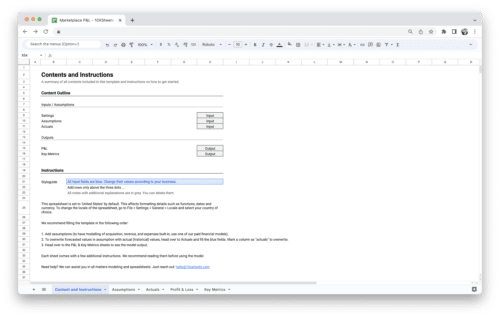
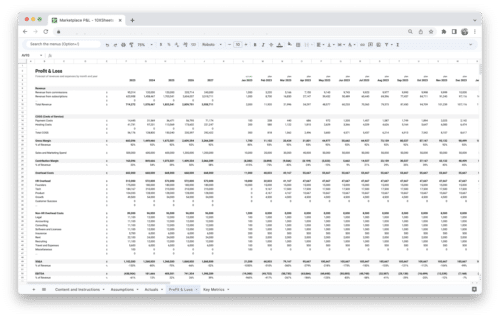
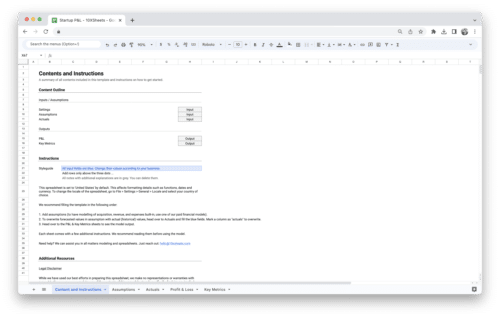
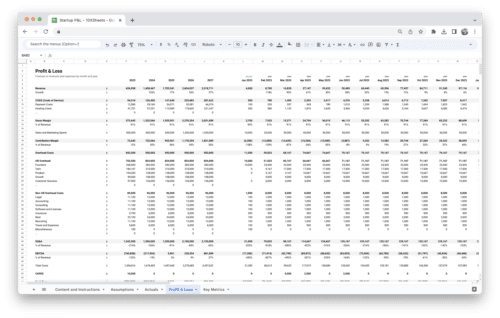
For entrepreneurs and startups seeking funding or planning their financial future, Google Sheets is a valuable tool. You can create financial projections, cash flow statements, and income statements to present a compelling case to investors or stakeholders.
Example: Suppose you’re launching a tech startup. You can use Google Sheets to project revenue growth, expenses, and break-even points over the next three years. Charts and graphs can illustrate your financial strategy.
Simple Financial Analysis
For quick financial analysis, Google Sheets is accessible and efficient. You can calculate key financial metrics like ROI, NPV, and IRR, making it a suitable choice for small businesses and individuals.
Example: Suppose you want to assess the profitability of a potential investment. Google Sheets can help you calculate the Net Present Value (NPV) of the investment based on expected future cash flows and discount rates.
Collaborative Projects
Google Sheets truly shines in collaborative environments. Whether you’re working on financial reports, sales forecasts, or project budgets, multiple team members can contribute simultaneously, reducing the risk of version conflicts.
Example: Your marketing team can use Google Sheets to collaborate on a marketing budget. Team members can input their budgetary needs, and you can instantly see how changes affect the overall budget.
In these scenarios, Google Sheets simplifies financial modeling tasks and fosters teamwork. However, it’s essential to weigh these advantages against the limitations we discussed earlier to determine if Google Sheets is the right choice for your specific financial modeling needs.
Excel for Financial Modeling
Now, let’s dive into Excel, the powerhouse of spreadsheet software, and explore its extensive features, benefits, limitations, and practical applications in financial modeling.
Excel Financial Modeling Features and Benefits
Excel offers a rich array of features that make it a top choice for financial modeling professionals. Some of its key advantages include:
- Advanced Functionality: Excel is renowned for its comprehensive set of advanced financial functions and modeling tools. Whether you’re performing complex financial analysis or building intricate models, Excel has the tools you need.
- Large Data Handling: Excel excels (pun intended) in handling large datasets efficiently. Its robust calculation engine allows you to work with extensive financial data without compromising performance.
- Add-ins and Templates: You can supercharge Excel’s capabilities with a wide range of add-ins and templates designed specifically for financial modeling. These resources streamline your workflow and save time.
- Extensive Formula Library: Excel boasts an extensive library of financial, mathematical, and statistical formulas. These formulas empower you to perform a wide variety of calculations with precision.
Excel Financial Modeling Limitations and Constraints
Despite its strengths, Excel also comes with certain limitations and constraints:
- Costly Licensing: Acquiring Excel requires a paid license, making it relatively expensive for individual users and small businesses, especially when compared to free alternatives like Google Sheets.
- Steep Learning Curve: While Excel is incredibly powerful, mastering its advanced features can be challenging for newcomers. However, once you become proficient, you can harness its full potential.
- Limited Collaboration: While Excel does offer collaboration features, they may not be as seamless as those in Google Sheets. Collaborative work often requires the use of additional Microsoft services like SharePoint or OneDrive.
Excel Financial Modeling Examples
Let’s explore some real-world examples where Excel shines in the realm of financial modeling:
Complex Financial Analysis
Excel’s comprehensive suite of functions and tools makes it the go-to choice for intricate financial modeling tasks. Whether you’re performing discounted cash flow (DCF) analysis, scenario planning, or risk assessment, Excel provides the necessary tools and flexibility.
Example: If you’re an investment analyst evaluating a potential acquisition, Excel allows you to create a DCF model, incorporating various assumptions, discount rates, and future cash flows to assess the investment’s viability.
Professional Reporting
Excel enables you to create polished financial reports and presentations that cater to stakeholders, investors, or executives. With its customizable charts, graphs, and formatting options, you can convey complex financial data in a clear and compelling manner.
Example: As a financial manager, you can use Excel to prepare a quarterly financial report for your company’s board of directors. Excel’s formatting features allow you to create visually appealing reports with detailed financial insights.
Data Analysis and Visualization
For in-depth data analysis and visualization, Excel offers a plethora of tools. From pivot tables to advanced charting options, you can gain valuable insights from your financial data.
Example: Suppose you’re a market analyst examining sales data for your company. You can use Excel to create pivot tables that summarize sales by region, product, and time period. Visualizations like line charts can help identify trends and patterns.
Risk Assessment
Excel’s sophisticated modeling capabilities are invaluable when assessing risk and uncertainty in financial models. Monte Carlo simulations and sensitivity analyses are just a couple of the techniques Excel supports.
Example: As a financial planner, you can use Excel to run Monte Carlo simulations to evaluate the potential range of investment returns and assess the associated risks for your clients’ portfolios.
In these examples, Excel proves its prowess as a versatile tool for financial modeling, particularly for professionals handling complex financial scenarios and requiring in-depth analysis and reporting. However, the decision to use Excel should take into account factors like cost and the learning curve associated with its advanced features.
Google Sheets vs. Excel
Now, let’s conduct a thorough comparison between Google Sheets and Excel across four critical dimensions: functionality and formulas, data handling and analysis, collaboration and sharing, as well as cost and accessibility. This comparison will help you make an informed decision when choosing the right tool for your financial modeling needs.
Functionality and Formulas
When it comes to functionality and formulas, both Google Sheets and Excel offer robust capabilities. Here’s how they stack up:
Google Sheets:
- Google Sheets provides a diverse range of functions and formulas that cater to most common financial modeling needs. You’ll find mathematical, statistical, and logical functions at your disposal.
- For everyday financial tasks like calculating interest rates, managing budgets, or performing basic statistical analysis, Google Sheets is more than capable.
- While it may not match Excel’s depth when it comes to advanced financial functions, it covers the essentials for many users.
Excel:
- Excel shines in this department, offering an extensive library of financial, mathematical, and statistical functions. Whether you’re working on complex financial modeling, statistical analysis, or engineering calculations, Excel has the tools you need.
- Advanced functions like NPV, IRR, and the ability to create custom macros and add-ins make Excel a top choice for financial professionals.
- For those handling intricate financial models, Excel’s depth and versatility are unmatched.
Data Handling and Analysis
Efficiently handling and analyzing data is paramount in financial modeling. Let’s see how Google Sheets and Excel compare in this aspect:
Google Sheets:
- Google Sheets performs well with smaller datasets and is a suitable choice for basic data analysis. It’s particularly strong for collaborative data manipulation.
- Its online nature allows multiple users to work on the same sheet simultaneously, making it ideal for team-based data analysis.
- However, with very large or complex datasets, Google Sheets can experience performance issues.
Excel:
- Excel’s strength lies in its ability to handle large and complex datasets with ease. Its calculation engine is optimized for efficiency.
- For financial professionals dealing with extensive market data, historical records, or intricate financial models, Excel’s superior data handling capabilities are a significant advantage.
- Excel’s array of data analysis tools, such as pivot tables and advanced charting, further solidify its position as a data analysis powerhouse.
Collaboration and Sharing
Effective collaboration and sharing features are crucial, especially in team environments. Here’s how Google Sheets and Excel compare in this regard:
Google Sheets:
- Google Sheets is designed with collaboration in mind. Multiple users can work on the same sheet simultaneously, making real-time collaboration seamless.
- Sharing is straightforward, as you can grant specific permissions to individuals, ensuring data security.
- Collaboration features are particularly valuable for remote teams, fostering teamwork regardless of geographical boundaries.
Excel:
- Excel also offers collaboration features, but they may not be as seamless as Google Sheets. Collaborative work often involves the use of additional Microsoft services like SharePoint or OneDrive.
- Excel’s sharing options can sometimes be more complex to configure, and version control may require more diligence.
Cost and Accessibility
The financial implications of your choice are vital. Let’s consider the cost and accessibility factors:
Google Sheets:
- Google Sheets is accessible for free, making it a budget-friendly option for individuals and small businesses. It offers generous cloud storage and processing capabilities.
- Paid plans provide additional features and storage, but even the free version is sufficient for many users.
- Its cloud-based nature ensures accessibility from any device with an internet connection, promoting flexibility and mobility.
Excel:
- Excel requires a paid license, and this cost can be significant for individual users and smaller organizations. Licensing costs can vary based on your region and version (e.g., Microsoft 365 or standalone Excel).
- While Excel offers desktop and online versions, the offline nature of the desktop application can limit accessibility for remote or on-the-go users.
In summary, the choice between Google Sheets and Excel for financial modeling hinges on your specific needs and priorities. While Google Sheets excels in collaboration and cost-effectiveness, Excel stands out for its advanced functionality and data handling capabilities. Assess your requirements carefully to determine which tool aligns best with your financial modeling goals
Factors to Consider When Choosing Google Sheets vs Excel
When selecting the right spreadsheet tool for financial modeling, there are several critical factors you should take into account. These considerations will guide you towards making the best choice for your unique needs.
Business Requirements
Your specific business requirements play a pivotal role in determining which spreadsheet tool is the most suitable. Here’s what to consider:
- Size and Complexity of Financial Models: Assess the complexity and size of the financial models you need to create. If you deal with intricate, data-intensive models, Excel’s advanced features may be better suited to your needs.
- Type of Financial Analysis: Consider the type of financial analysis you perform. If you require complex financial functions like IRR, NPV, or Monte Carlo simulations, Excel’s extensive library of financial formulas could be advantageous.
- Regulatory Compliance: If your industry or organization has specific regulatory compliance requirements, ensure that the chosen spreadsheet tool supports the necessary features for compliance and reporting.
User Skillset
The proficiency of the individuals who will be using the spreadsheet tool is another essential factor to consider:
- Familiarity with the Software: Assess the existing skill level of your team members. If they are already proficient in either Google Sheets or Excel, it may be more efficient to stick with the tool they are comfortable with.
- Training and Learning Curve: Consider the availability of training resources and the time it takes to become proficient with the chosen software. Excel, with its deep feature set, may require more training for users to leverage its full potential.
Budget Constraints
Financial considerations should not be underestimated, especially for small businesses and individuals:
- Cost of Licensing: Examine the cost of licensing for both Google Sheets and Excel. Keep in mind that Excel typically requires a paid license, while Google Sheets offers a free version with optional paid plans.
- Total Cost of Ownership (TCO): Calculate the TCO, which includes not only licensing fees but also costs associated with training, support, and any necessary add-ons or extensions.
Collaboration Needs
The level of collaboration required within your team or organization is a significant factor:
- Real-Time Collaboration: If your team relies heavily on real-time collaboration, Google Sheets’ cloud-based nature and concurrent editing capabilities make it a strong contender.
- Sharing and Permissions: Consider how easily you can share and control access to your financial models. Both Google Sheets and Excel offer sharing options, but the user experience and security features may differ.
- Integration with Other Tools: Evaluate whether your chosen spreadsheet tool integrates seamlessly with other software your team uses, such as project management or CRM tools.
By thoroughly assessing these factors, you can make an informed decision about whether Google Sheets or Excel aligns best with your business requirements, user skillset, budget constraints, and collaboration needs. Remember that the ideal choice may vary from one organization to another, so choose the tool that best suits your unique circumstances.
Financial Modeling Examples
To gain a deeper understanding of the practical applications of financial modeling and how it can be leveraged using Google Sheets and Excel, let’s explore a variety of real-world examples:
1. Business Valuation
Financial modeling plays a crucial role in determining the value of a business. Whether you’re a business owner looking to sell your company or an investor considering an acquisition, you can use financial models to estimate the business’s worth. Key elements include projecting future cash flows, considering risk factors, and applying appropriate valuation methods such as discounted cash flow (DCF) analysis or comparable company analysis (CCA).
In Excel: Excel’s robust functionality and built-in financial functions make it an ideal choice for complex business valuations. You can create detailed DCF models, analyze financial statements, and incorporate various valuation methodologies.
2. Project Financial Feasibility
For project managers and investors, assessing the financial feasibility of a project is critical. Financial modeling helps determine whether a project will generate a positive return on investment (ROI). This involves estimating project costs, revenue projections, and factoring in variables like inflation, interest rates, and market conditions.
In Google Sheets: Google Sheets offers collaborative capabilities that are valuable for project teams. Multiple team members can work on financial models simultaneously, making it easier to evaluate project feasibility as a group.
3. Personal Financial Planning
Individuals often use financial modeling to manage their personal finances effectively. This may include creating a budget, projecting retirement savings, or planning for major life events like buying a home or sending children to college. Financial models help individuals set realistic financial goals and make informed decisions.
In Excel: Excel’s comprehensive set of functions and templates are beneficial for creating personal financial plans. Users can create budget spreadsheets, retirement savings calculators, and investment portfolios to track and manage their financial future.
4. Investment Analysis
Investors, whether in stocks, real estate, or other assets, rely on financial models to assess the potential return and risk associated with their investments. Financial models can help calculate key metrics like return on investment (ROI), net present value (NPV), and internal rate of return (IRR) to inform investment decisions.
In Google Sheets: Google Sheets offers a collaborative environment where investment analysis can be performed with input from various team members. You can build models to evaluate different investment scenarios and share them for collective decision-making.
5. Credit Risk Assessment
Financial institutions and lending organizations use financial models to evaluate the creditworthiness of borrowers. By analyzing financial statements and historical data, these models assess the risk associated with lending money and help determine interest rates, loan terms, and credit limits.
In Excel: Excel’s advanced data analysis features and financial functions make it an excellent choice for creating credit risk assessment models. Lenders can calculate credit scores, analyze financial ratios, and make lending decisions based on these models.
These examples illustrate the versatility and importance of financial modeling in various domains. Whether you’re a business professional, investor, project manager, or an individual managing personal finances, the ability to create accurate and insightful financial models can greatly impact your decision-making process. Both Google Sheets and Excel offer valuable tools to perform these analyses, with each platform offering its own strengths and use cases based on your specific needs.
Financial Modeling Best Practices
When engaging in financial modeling, whether using Google Sheets or Excel, adhering to best practices is essential to ensure accuracy, efficiency, and reliability in your analyses. Here’s a comprehensive list of best practices to follow:
- Structured Data Organization: Maintain a well-organized structure for your financial data within the spreadsheet. Use clear labels, headings, and consistent formatting to enhance readability.
- Consistent Model Layout: Keep your financial model layout consistent throughout. A standardized layout aids in comprehending the structure and flow of your model.
- Clear Documentation: Document your assumptions, methodologies, and formulas within the spreadsheet. This documentation not only helps you understand your model but also enables others to review and validate your work.
- Version Control: Implement version control practices to track changes and updates to your financial model. This ensures that you can revert to previous versions if needed and maintain a clear audit trail.
- Data Validation: Use data validation rules to prevent errors in data entry. This helps maintain data accuracy and prevents inadvertent data input mistakes.
- Formula Efficiency: Write efficient formulas to avoid spreadsheet slowdowns. Minimize the use of volatile functions and excessive cell references.
- Scenario Analysis: Create multiple scenarios within your financial model to assess different outcomes and sensitivities. This enables you to evaluate the impact of varying assumptions on your financial projections.
- Error Checking: Regularly perform error checks and validation tests to identify and correct any inconsistencies or errors in your model. Utilize Excel’s built-in auditing tools.
- Sensitivity Analysis: Conduct sensitivity analysis to understand the sensitivity of your financial model to changes in key variables. This helps you assess the level of risk associated with your projections.
- Data Security: If you’re using cloud-based solutions, ensure that your financial data is adequately secured with encryption and access controls. Protect sensitive financial information from unauthorized access.
- Conservative Assumptions: Exercise prudence when making assumptions. Overly optimistic assumptions can lead to overly optimistic projections, which may not align with reality.
- Model Testing: Test your financial model by comparing its outputs to historical data or known benchmarks. This helps validate the accuracy of your model and its predictive power.
- Peer Review: Have colleagues or peers review your financial model. Fresh perspectives can uncover errors or assumptions that you may have overlooked.
- Regular Updates: Financial models are not static; they should be updated regularly to reflect changing conditions, market dynamics, or new information.
- Training and Knowledge Sharing: Ensure that team members are trained adequately in the use of the chosen spreadsheet tool and the specific financial models you’ve created. Knowledge sharing among team members promotes consistency and accuracy.
By incorporating these best practices into your financial modeling process, you can enhance the quality and reliability of your financial analyses, whether you’re using Google Sheets or Excel. These guidelines promote transparency, reduce errors, and provide a solid foundation for informed decision-making based on your financial models.
Conclusion
The choice between Google Sheets and Excel for financial modeling ultimately depends on your specific requirements and preferences. Both tools offer distinct advantages. Google Sheets excels in collaboration and accessibility, making it a strong choice for team-based projects and those who need to work on the go. On the other hand, Excel’s advanced functionality and robust capabilities make it a powerhouse for complex financial modeling tasks and data analysis.
Regardless of your choice, remember that proficiency in either tool can significantly enhance your financial modeling skills. The best approach may involve using both Google Sheets and Excel for different aspects of your financial work, taking advantage of the strengths each offers. Ultimately, your ability to make informed financial decisions will be greatly enhanced by your mastery of these powerful spreadsheet tools.

