- What is Financial Statement Analysis?
- Understanding Financial Statements
- Financial Ratio Analysis
- Financial Statement Analysis Tools and Techniques
- Financial Statements Interpretation
- Financial Statement Analysis Applications
- Best Practices for Financial Statement Analysis
- Financial Statement Analysis Limitations
- Conclusion
Financial statement analysis is the process of analyzing a company’s financial statements to gain insight into its financial health and performance. This guide provides an in-depth overview of financial statement analysis, its importance, goals, and types of financial statements.
What is Financial Statement Analysis?
Financial statement analysis involves examining a company’s financial statements to evaluate its financial performance and health. The analysis of financial statements includes assessing the company’s liquidity, solvency, profitability, and efficiency.
Importance of Financial Statement Analysis
Financial statement analysis is essential for understanding a company’s financial health and performance. It is critical for investors, creditors, and other stakeholders who need to make informed decisions about their investments, credit risk, and business operations.
Goals of Financial Statement Analysis
The primary goals of financial statement analysis are to evaluate a company’s financial health, performance, and prospects. It helps identify strengths and weaknesses, trends, and changes in a company’s financial position and results of operations.
Types of Financial Statements
There are three primary types of financial statements:
- Balance Sheet
- Income Statement
- Cash Flow Statement
Understanding Financial Statements
To perform a thorough analysis of your financial statements, it is essential to understand the different financial statements and the information they provide.
1. Balance Sheet
The balance sheet is a snapshot of a company’s financial position at a specific point in time. It provides information about a company’s assets, liabilities, and equity. The following are the components of the balance sheet:
- Assets: These are resources owned by the company, such as cash, accounts receivable, inventory, and property, plant, and equipment.
- Liabilities: These are obligations of the company, such as accounts payable, loans, and notes payable.
- Equity: This represents the residual interest in the company’s assets after deducting liabilities.
Key Ratios derived from the Balance Sheet are:
- Current Ratio: A measure of a company’s liquidity and ability to pay short-term obligations. It is calculated by dividing current assets by current liabilities.
- Quick Ratio: A more stringent measure of liquidity that excludes inventory from current assets. It is calculated by dividing current assets minus inventory by current liabilities.
2. Income Statement
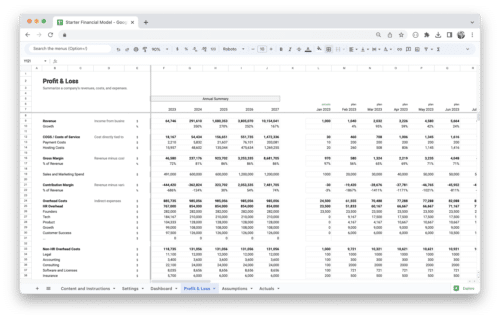
The income statement, also known as the profit and loss statement, provides information about a company’s revenue, expenses, and net income or loss over a specific period. The following are the components of the income statement:
- Revenue: This is the income generated from the company’s operations.
- Cost of Goods Sold (COGS): This includes the direct costs associated with producing or providing goods or services.
- Gross Profit: This is the difference between revenue and COGS.
- Operating Expenses: These are expenses incurred in running the company’s operations, such as salaries, rent, utilities, and marketing expenses.
- Net Income or Loss: This is the bottom-line profit or loss after deducting all expenses from revenue.
Key Ratios derived from the Income Statement are:
- Gross Profit Margin: This is the percentage of revenue that remains after deducting COGS. It is calculated by dividing gross profit by revenue.
- Net Profit Margin: This is the percentage of revenue that remains after deducting all expenses, including taxes and interest. It is calculated by dividing net income by revenue.
3. Cash Flow Statement
The cash flow statement provides information about a company’s cash inflows and outflows over a specific period. It is divided into three sections:
- Operating Activities: This includes cash inflows and outflows from the company’s primary business operations.
- Investing Activities: This includes cash inflows and outflows from buying or selling long-term assets, such as property, plant, and equipment.
- Financing Activities: This includes cash inflows and outflows from raising or paying off debt, issuing or repurchasing equity, and paying dividends.
The following are the components of the cash flow statement:
- Cash Inflows: These include cash received from customers, interest received, and dividends received.
- Cash Outflows: These include cash paid to suppliers and employees and interest paid on debt.
Key Ratios derived from the Cash Flow Statement include:
- Operating Cash Flow Ratio: This is a measure of a company’s ability to generate cash from its primary business operations. It is calculated by dividing cash flow from operating activities by current liabilities.
Financial Ratio Analysis
Financial ratio analysis is the process of using financial ratios to evaluate a company’s financial performance and health. The following are some of the most commonly used financial ratios:
1. Liquidity Ratios
Liquidity ratios measure a company’s ability to meet its short-term obligations. Ratios that are commonly utilized to assess liquidity are:
- Current Ratio: A measure of a company’s liquidity and ability to pay short-term obligations. It is calculated by dividing current assets by current liabilities.
- Quick Ratio: A more stringent measure of liquidity that excludes inventory from current assets. It is calculated by dividing current assets minus inventory by current liabilities.
2. Solvency Ratios
Solvency ratios measure a company’s ability to meet its long-term obligations. The following are the commonly used solvency ratios:
- Debt-to-Equity Ratio: Measures a company’s leverage and risk. It is calculated by dividing total liabilities by total equity.
- Debt-to-Assets Ratio: Measures a company’s ability to pay its debts using its assets. It is calculated by dividing total liabilities by total assets.
3. Profitability Ratios
Profitability ratios measure a company’s ability to generate profit. The commonly used profitability ratios are:
- Gross Profit Margin: This is the percentage of revenue that remains after deducting COGS. It is calculated by dividing gross profit by revenue.
- Net Profit Margin: This is the percentage of revenue that remains after deducting all expenses, including taxes and interest. It is calculated by dividing net income by revenue.
4. Efficiency Ratios
Efficiency ratios measure a company’s ability to efficiently manage its assets and liabilities. The two commonly used efficiency ratios are:
- Inventory Turnover Ratio: This measures how quickly a company sells its inventory. It is calculated by dividing the cost of goods sold by the average inventory balance.
- Accounts Receivable Turnover Ratio: This measures how quickly a company collects its accounts receivable. It is calculated by dividing revenue by the average accounts receivable balance.
Financial Statement Analysis Tools and Techniques
There are various tools and techniques available for financial statement analysis. The following are some of the most commonly used:
- Horizontal Analysis: Involves comparing a company’s financial statements over several periods to identify trends and changes.
- Vertical Analysis: Involves comparing a company’s financial statements to a common-size statement to identify trends and changes in the proportions of different items.
- Ratio Analysis: Involves calculating financial ratios to evaluate a company’s financial performance and health.
- Common Size Analysis: Involves converting each item on a financial statement to a percentage of a base item to facilitate comparisons.
- DuPont Analysis: A method of decomposing return on equity (ROE) into its component parts to evaluate a company’s profitability, asset efficiency, and financial leverage.
Financial Statements Interpretation
Interpreting financial statements involves understanding the limitations of financial statement analysis and considering factors that may affect the analysis results.
Financial Statement Analysis Limitations
Financial statement analysis has several limitations that must be considered, including:
- Historical Information: Financial statements provide information about a company’s past performance and may not reflect current or future conditions.
- Accounting Policies and Assumptions: Companies may use different accounting policies and assumptions that can affect the comparability of financial statements.
- Incomplete Information: Financial statements may not provide a complete picture of a company’s operations, such as qualitative factors affecting its financial performance.
Factors Affecting Financial Statement Analysis
Several factors can affect the results of financial statement analysis, including:
- Economic Factors: Economic conditions can affect a company’s financial performance and the interpretation of financial statements.
- Political and Legal Factors: Changes in laws and regulations can affect a company’s financial performance and the interpretation of financial statements.
- Competitive Factors: The competitive environment can affect a company’s financial performance and the interpretation of financial statements.
Interpreting the Results of Financial Statement Analysis
Interpreting financial statement analysis results involves:
- Comparing a company’s financial ratios to industry benchmarks.
- Identifying trends and changes in financial ratios over time.
- Considering qualitative factors that can affect a company’s financial performance.
Identifying Financial Strengths and Weaknesses
Financial statement analysis can help identify a company’s financial strengths and weaknesses by evaluating its liquidity, solvency, profitability, and efficiency. It is essential to use multiple methods and consider qualitative factors to gain a complete understanding of a company’s financial health and performance.
Financial Statement Analysis Applications
Financial statement analysis has several applications in business, including:
- Investment Analysis: Investors use financial statement analysis to evaluate a company’s financial health and performance and make informed investment decisions.
- Credit Analysis: Creditors use the analysis to evaluate a company’s creditworthiness and determine the risk of lending money to the company.
- Mergers and Acquisitions: The analysis is essential in mergers and acquisitions to evaluate the financial health and performance of the target company and assess the potential risks and benefits of the transaction.
- Risk Management: Help companies identify potential financial risks and take appropriate measures to mitigate them.
- Budgeting and Forecasting: Help companies develop accurate budgets and forecasts by providing insights into past financial performance and trends.
- Fraud Detection: Help detect potential fraud by identifying unusual trends or inconsistencies in a company’s financial statements.
Best Practices for Financial Statement Analysis
To perform an effective financial statement analysis, it is essential to follow best practices, including:
- Use of Reliable and Accurate Data: Financial statement analysis depends on the accuracy and reliability of financial data. It is crucial to use data from reliable sources and ensure that it is accurate and complete.
- Consistency in Financial Statement Analysis: Consistency in financial statement analysis is essential to ensure the results are comparable over time. Using consistent methods and assumptions is crucial when performing the analysis.
- Use of Multiple Methods for Analysis: Using multiple methods for your analysis can help gain a complete understanding of a company’s financial health and performance. It is important to use a combination of ratio analysis, trend analysis, and qualitative analysis to perform a thorough analysis.
- Consideration of Qualitative Factors: Qualitative factors, such as industry trends, management quality, and competitive environment, can significantly affect a company’s financial performance. It is essential to consider these factors when performing the analysis.
- Importance of Industry Benchmarking: Industry benchmarking involves comparing a company’s financial performance to industry peers to gain insights into its relative financial health and performance. Industry benchmarking is vital to evaluate a company’s competitiveness and identify areas for improvement.
Financial Statement Analysis Limitations
Financial statement analysis has several limitations that must be considered, including:
External Limitations
External limitations are factors outside the control of the company that can affect financial statement analysis, including:
- Economic Factors: Economic conditions can affect a company’s financial performance and the interpretation of financial statements.
- Political and Legal Factors: Changes in laws and regulations can affect a company’s financial performance and the interpretation of financial statements.
- Competitive Factors: The competitive environment can affect a company’s financial performance and the interpretation of financial statements.
Internal Limitations
Internal limitations are factors within the company that can affect your analysis, including:
- Limitations of Financial Statements: Financial statements may not provide a complete picture of a company’s operations, and certain financial transactions may not be reflected in financial statements.
- Accounting Policies and Assumptions: Companies may use different accounting policies and assumptions that can affect the comparability of financial statements.
- Management Biases: Management biases can affect the presentation of financial statements and the interpretation of the statement analysis.
Conclusion
Financial statement analysis is critical for evaluating a company’s financial health and performance. It provides insights into a company’s liquidity, solvency, profitability, and efficiency, and helps identify financial strengths and weaknesses. By following best practices and considering the limitations of financial statement analysis, stakeholders can make informed investment decisions, manage financial risks, and improve business operations.
Get Started With a Prebuilt Template!
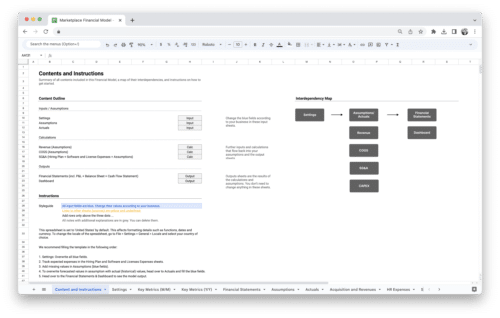
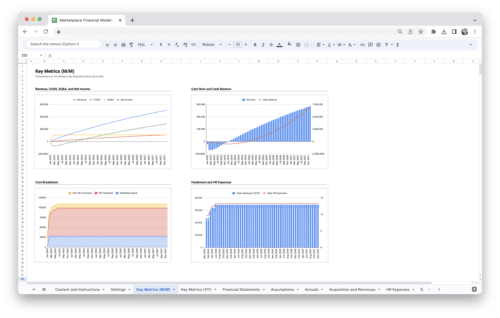
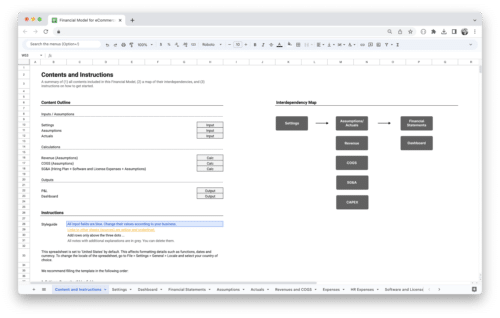
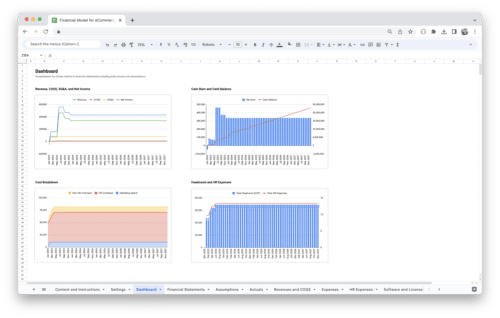
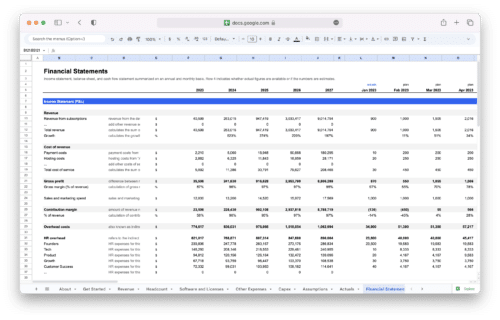
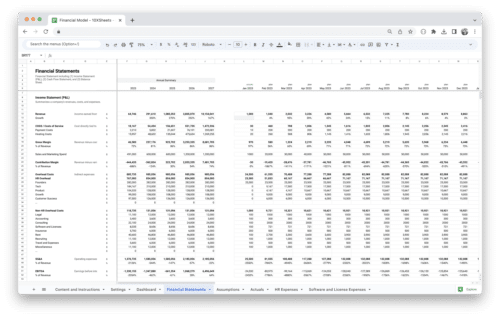
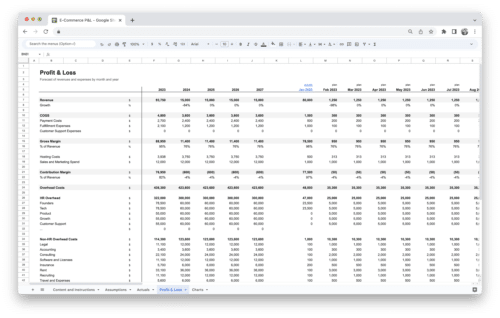
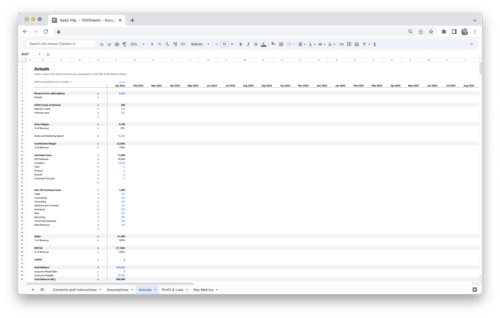
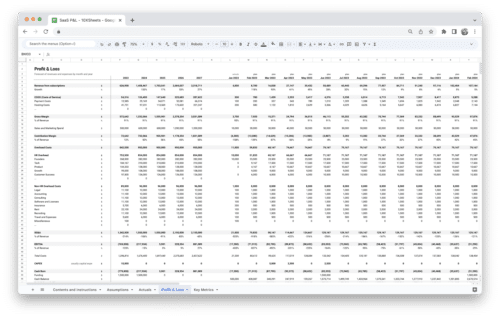
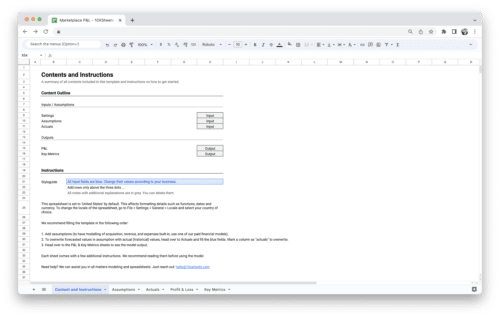
Looking to streamline your business financial modeling process with a prebuilt customizable template? Say goodbye to the hassle of building a financial model from scratch and get started right away with one of our premium templates.
- Save time with no need to create a financial model from scratch.
- Reduce errors with prebuilt formulas and calculations.
- Customize to your needs by adding/deleting sections and adjusting formulas.
- Automatically calculate key metrics for valuable insights.
- Make informed decisions about your strategy and goals with a clear picture of your business performance and financial health.

