- Key Financial Metrics to Track
- Key Performance Indicators (KPIs) to Track
- Using Financial Metrics and KPIs to Make Informed Decisions
- Best Practices for Tracking Financial Metrics and KPIs
- Tools and Technologies for Tracking Financial Metrics and KPIs
- Challenges and Limitations of Financial Metrics and KPIs
- Conclusion
As a business owner, tracking the right financial metrics and key performance indicators (KPIs) is crucial for success. By understanding and monitoring these metrics, you can gain valuable insights into your business’s financial performance and make informed decisions about future investments and growth strategies.
In this guide, we’ll explore the top financial metrics and KPIs businesses should track, as well as best practices for monitoring and analyzing this data to drive business success.
Key Financial Metrics to Track
Financial metrics provide a snapshot of a company’s financial health and performance. Here are some of the key financial metrics that businesses should track:
- Revenue: Revenue is the total amount of money earned from sales during a specific period. This is the most basic and essential financial metric, as it measures the success of a business’s core operations.
- Gross Profit Margin: Gross profit margin is the percentage of revenue that remains after subtracting the cost of goods sold. This metric helps businesses understand the profitability of their products or services.
- Net Profit Margin: Net profit margin is the percentage of revenue that remains after all expenses have been deducted. This metric provides a more accurate picture of a business’s profitability than the gross profit margin, as it takes into account all operating expenses.
- EBITDA: EBITDA stands for earnings before interest, taxes, depreciation, and amortization. This metric provides a clear view of a business’s operating profitability, as it excludes non-operational expenses.
- Cash Flow: Cash flow is the amount of cash moving in and out of a business over a specific period. This metric is critical for assessing a business’s liquidity and financial stability.
- Return on Investment (ROI): ROI measures the return on a business’s investment in a specific project or initiative. This metric helps businesses assess the success of their investments and make informed decisions about future investments.
- Return on Equity (ROE): ROE measures the return on a business’s equity investment. This metric helps businesses understand how efficiently they are using their capital to generate profits.
- Debt-to-Equity Ratio: The debt-to-equity ratio measures a business’s debt in relation to its equity. This metric is vital for understanding a business’s financial leverage and risk.
- Current Ratio: The current ratio measures a business’s ability to pay off its short-term debts using its current assets. This metric is critical for assessing a business’s liquidity.
- Quick Ratio: The quick ratio measures a business’s ability to pay off its short-term debts using its most liquid assets. This metric provides a more conservative assessment of a business’s liquidity than the current ratio.
Key Performance Indicators (KPIs) to Track
KPIs help businesses measure progress toward specific goals and objectives. Here are some of the top KPIs that businesses should track:
- Sales Growth: Sales growth measures the increase in revenue over a specific period. This KPI is important for assessing a business’s overall growth and success.
- Customer Acquisition Cost (CAC): CAC measures the cost of acquiring a new customer. This KPI helps businesses understand the effectiveness of their marketing and sales strategies.
- Customer Lifetime Value (CLV): CLV measures the total money a customer is expected to spend with a business over their lifetime. This KPI helps businesses understand the value of their customer base and make informed decisions about customer acquisition and retention strategies.
- Churn Rate: The churn rate measures the percentage of customers who stop using a business’s products or services over a specific period. This KPI is important for assessing customer loyalty and retention.
- Gross Merchandise Value (GMV): GMV measures the total value of products sold through a business’s e-commerce platform over a specific period. This KPI is important for assessing the success of a business’s e-commerce strategy.
- Average Order Value (AOV): AOV measures the average amount of money spent by a customer per order. This KPI helps businesses understand their customers’ spending habits and make informed decisions about pricing and promotions.
- Customer Retention Rate: Customer retention rate measures the percentage of customers who continue to use a business’s products or services over a specific period. This KPI is important for assessing customer loyalty and retention.
- Net Promoter Score (NPS): NPS measures the likelihood of a customer recommending a business’s products or services to others. This KPI is important for assessing customer satisfaction and loyalty.
Using Financial Metrics and KPIs to Make Informed Decisions
Tracking financial metrics and KPIs is only valuable if you use that data to make informed decisions about your business. Here are some tips for interpreting financial data and using it to drive business success:
- Identify trends and patterns: Look for trends and patterns in your financial data to identify areas of strength and weakness in your business. This can help you make informed decisions about where to focus your resources.
- Use comparative analysis: Compare your financial data to industry benchmarks and competitors to gain a better understanding of how your business is performing relative to others in your market.
- Use forecasting and budgeting: Use financial data to create budgets and forecasts that can help you plan for the future and make informed decisions about investments and growth strategies.
- Make data-driven decisions: Use financial data and KPIs to make informed decisions about everything from marketing and sales strategies to product development and customer service.
Best Practices for Tracking Financial Metrics and KPIs
Tracking financial metrics and KPIs can be complex, so it’s important to establish best practices to ensure that you are tracking the right metrics and using that data effectively.
Here are some best practices for monitoring financial metrics and KPIs:
- Establish clear goals and objectives: Before you begin tracking financial metrics and KPIs, establish clear goals and objectives for your business. This will help you choose the right metrics to track and ensure that you are using that data to drive business success.
- Use a balanced scorecard approach: Use a balanced scorecard approach to ensure that you are tracking various financial metrics and KPIs that are aligned with your business goals and objectives.
- Choose the right metrics and KPIs to track: Choose financial metrics and KPIs relevant to your business and provide meaningful insights into your performance. Avoid tracking metrics that don’t provide valuable insights or are challenging to measure accurately.
- Set realistic targets and benchmarks: Set realistic targets and benchmarks for your financial metrics and KPIs. This will help you monitor your progress and make informed decisions about adjustments to your strategies and investments.
- Regularly review and analyze data: Regularly review and analyze your financial data and KPIs to identify trends and patterns that inform your decision-making.
- Use data visualization tools: Use data visualization tools and templates to help you interpret and communicate your financial data and KPIs effectively. This can help you easily identify patterns and trends and share insights with stakeholders more effectively.
- Communicate results and insights to stakeholders: Communicate your financial results and insights to stakeholders regularly. This can help ensure everyone is on the same page and working toward the same goals.
Tools and Technologies for Tracking Financial Metrics and KPIs
Various tools and technologies are available to help businesses track financial metrics and KPIs effectively.
- Accounting software: Help businesses manage their financial data and track key financial metrics and KPIs.
- Business intelligence tools: Help businesses analyze and interpret financial data and KPIs, providing actionable decision-making insights.
- Dashboard and reporting tools: Help businesses visualize and communicate their financial data and KPIs effectively.
- Customer relationship management (CRM) software: Help businesses track customer data and KPIs, such as customer acquisition cost, customer lifetime value, and churn rate.
- Sales and marketing automation software: Help businesses track KPIs related to sales growth, customer acquisition, and customer retention.
- E-commerce platforms: Help businesses track KPIs related to gross merchandise value, average order value, and customer retention.
Challenges and Limitations of Financial Metrics and KPIs
While financial metrics and KPIs are valuable tools for businesses, they also have limitations and challenges.
Limitations of Using Financial Metrics and KPIs
Financial metrics and KPIs can provide valuable insights into a business’s financial health and performance, but they also have limitations. For example, they may not consider non-financial factors impacting a business’s success, such as brand reputation or customer satisfaction.
Challenges Businesses Face Tracking Financial Metrics and KPIs
Businesses may face a variety of challenges when tracking financial metrics and KPIs, such as data accuracy issues, difficulty choosing the right metrics to monitor, or lack of resources to effectively track and analyze financial data.
Strategies for Overcoming Challenges and Limitations
To overcome challenges and limitations when tracking financial metrics and KPIs, businesses can implement strategies such as investing in data management tools, templates, and systems, conducting regular data audits, and working with financial experts to ensure accurate and meaningful data analysis.
Conclusion
Tracking financial metrics and KPIs is essential for business success. By monitoring these metrics and KPIs, businesses can gain valuable insights into their financial performance and make informed decisions about future investments and growth strategies. Remember to choose the right metrics to track, establish clear goals and objectives, use a balanced scorecard approach, and regularly review and analyze data to drive business success.
Get Started With a Prebuilt Template!
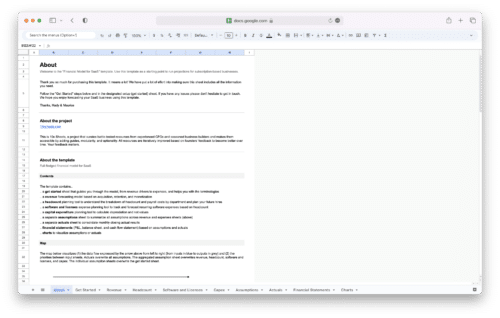
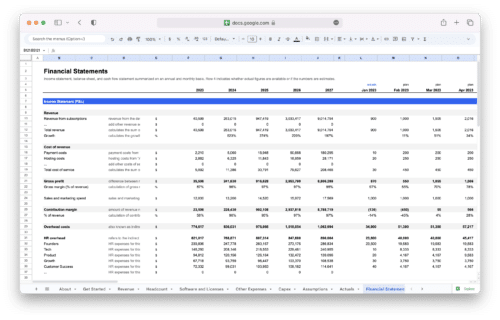
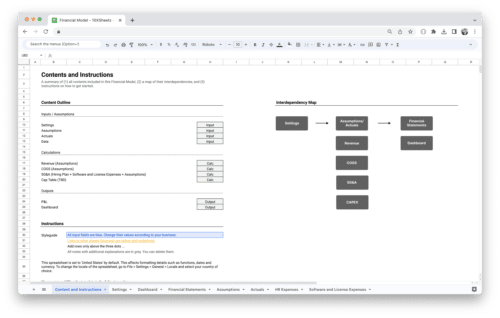
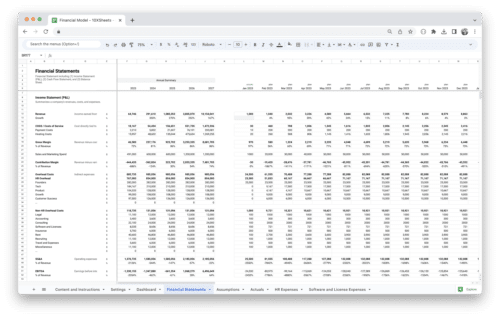
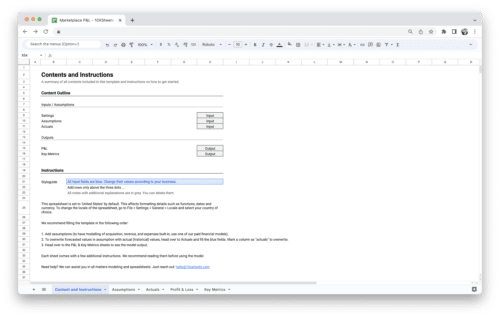
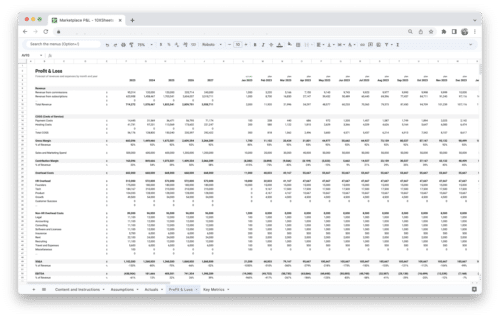
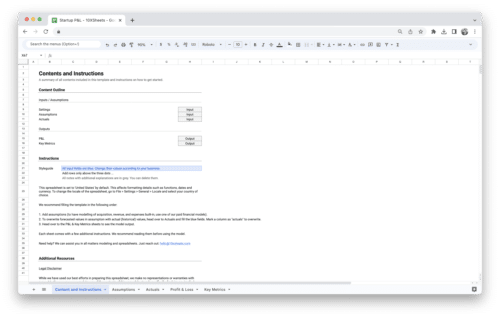
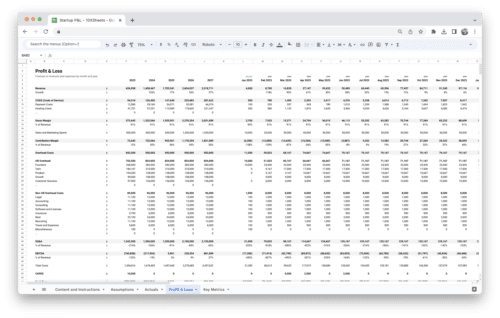
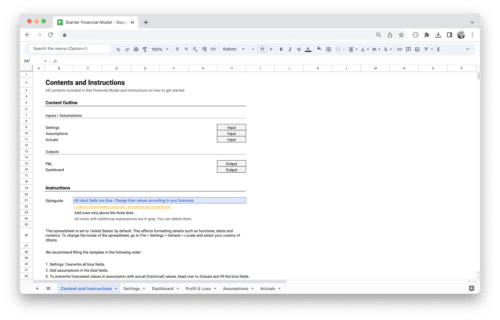
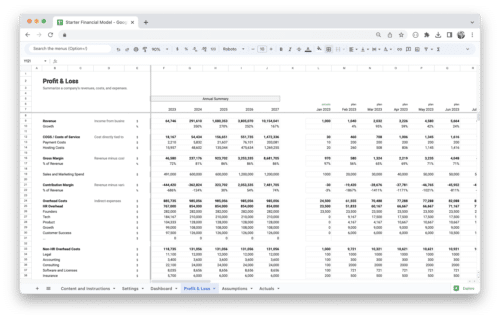
Looking to streamline your business financial modeling process with a prebuilt customizable template? Say goodbye to the hassle of building a financial model from scratch and get started right away with one of our premium templates.
- Save time with no need to create a financial model from scratch.
- Reduce errors with prebuilt formulas and calculations.
- Customize to your needs by adding/deleting sections and adjusting formulas.
- Automatically calculate key metrics for valuable insights.
- Make informed decisions about your strategy and goals with a clear picture of your business performance and financial health.

