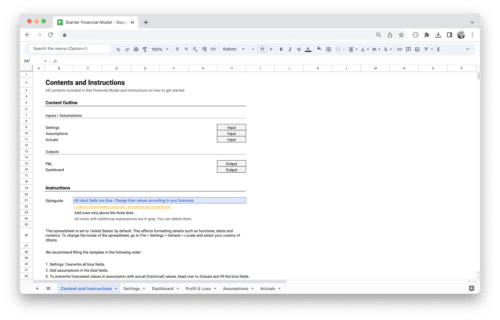
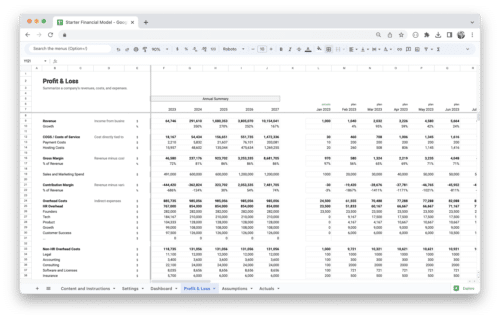
Financial modeling plays a crucial role in analyzing and making informed decisions in the business world. With its powerful features and capabilities, Excel has become the go-to financial modeling tool.
Understanding Financial Modeling Fundamentals
Financial modeling involves the creation of mathematical representations of financial situations or scenarios to evaluate their potential outcomes. To develop accurate and reliable financial models, it is essential to understand the fundamental components and building blocks. These elements include:
- Assumptions and inputs: Identifying and defining the variables and assumptions used in the model.
- Formulas and functions: Utilizing Excel’s formulas and functions to perform calculations and automate processes.
- Data sources: Sourcing relevant data from internal and external sources to support the model.
- Outputs and analysis: Interpreting the results generated by the financial model.
Adopting best practices in financial modeling ensures the integrity and reliability of the models. These practices encompass:
- Using clear and consistent naming conventions for cells, ranges, and formulas.
- Breaking complex models into manageable sections and linking them appropriately.
- Documenting assumptions, formulas, and methodologies to enhance transparency and understanding.
Maintaining data accuracy and integrity is paramount in financial modeling. By using reliable data sources, implementing data validation techniques, and conducting regular data audits, you can minimize errors and improve the credibility of your financial models.
Setting Up for Excel Financial Modeling
To optimize your Excel environment for financial modeling, it is essential to familiarize yourself with the interface and learn about the key functionalities that facilitate modeling tasks. Consider the following steps to set up Excel for financial modeling:
- Customize the Ribbon: Tailor the Excel Ribbon to display frequently used commands and functions, enhancing accessibility and efficiency.
- Master Essential Formulas and Functions: Gain proficiency in essential financial formulas and functions, including:
- SUM, AVERAGE, MAX, MIN: Perform basic calculations.
- PMT, FV, PV: Handle time value of money calculations.
- VLOOKUP, INDEX, MATCH: Retrieve and analyze data from different sources.
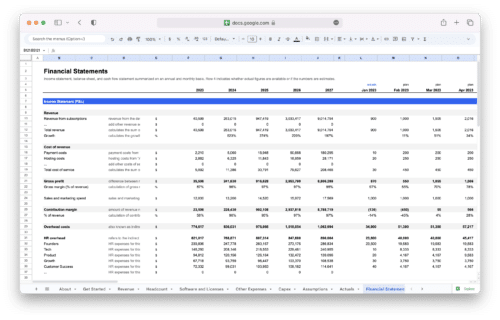
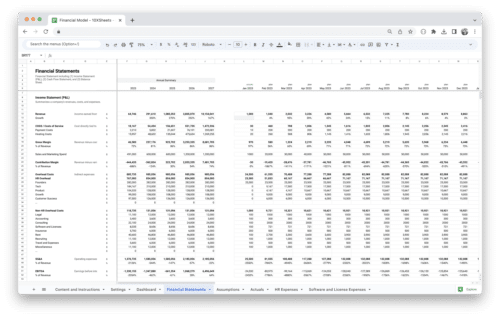
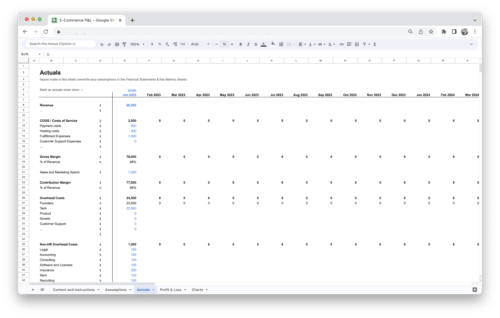
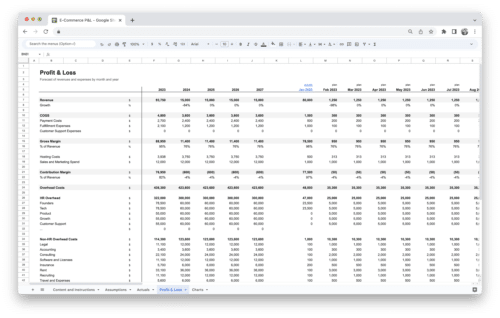
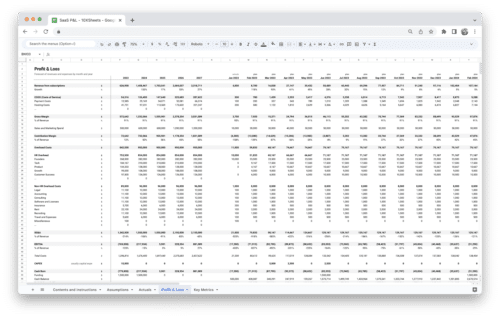
- Leverage Excel Templates: Utilize pre-designed templates specifically created for financial modeling. These templates provide structure and pre-defined formulas, streamlining the modeling process.
- Organize Worksheets and Data: Create a logical and structured layout for your financial model by organizing worksheets and categorizing data. Consider using color-coding and clear labels to enhance readability.
- Utilize Named Ranges: Assign meaningful names to ranges of cells, making it easier to reference and update them throughout the model.
Implementing these setup techniques will enable you to work efficiently and effectively in Excel for financial modeling tasks.
Excel Financial Modeling Techniques and Tools
Financial modeling encompasses various techniques and tools to analyze and project financial performance.
Cash Flow Modeling and Forecasting
Cash flow modeling is vital for understanding a company’s liquidity and assessing its ability to meet financial obligations. By projecting future cash flows, businesses can make informed investment decisions, budgeting, and capital allocation. To develop effective cash flow models:
- Building Cash Flow Statements: Create a comprehensive cash flow statement that includes the operating, investing, and financing activities of the business. Key components to include:
- Cash from operations: Calculating cash generated from day-to-day business activities.
- Cash from investing: Analyzing cash flows related to investments in assets or securities.
- Cash from financing: Assessing cash inflows and outflows from financing activities, such as debt issuance or equity financing.
- Techniques for Projecting Future Cash Flows: Employ various methods to forecast future cash flows, such as:
- Historical Analysis: Analyze past cash flow patterns to identify trends and predict future performance.
- Top-Down and Bottom-Up Approaches: Utilize industry and macroeconomic factors to estimate cash flows.
- Sensitivity Analysis: Assess the impact of different assumptions on cash flow projections.
Scenario Analysis and Sensitivity Testing
Scenario analysis involves modeling different scenarios to evaluate the potential impact on financial outcomes. On the other hand, sensitivity testing focuses on assessing how sensitive a financial model is to changes in specific variables. Things to keep in mind when performing scenario analysis and sensitivity testing:
- Understanding Scenario Modeling: Identify and define the scenarios you want to analyze. These may include best-case, worst-case, and base-case scenarios.
- Performing Sensitivity Analysis using Excel’s Data Tables: Utilize Excel’s data table functionality to perform sensitivity analysis by varying key input parameters and observing the resulting outputs.
- Leveraging Excel’s Goal Seek: Employ the goal seek feature to determine the required input value to achieve a desired outcome or target variable.
Valuation Modeling
Valuation modeling is crucial for determining the intrinsic value of an asset or business. Excel provides a robust platform for valuation analyses, including discounted cash flow (DCF) and comparable company analysis (CCA).
- Introduction to Valuation Methods: Understand the fundamental principles and methodologies of different valuation methods, including DCF and CCA.
- Applying Valuation Techniques in Excel: Utilize Excel’s formulas, functions, and data analysis tools to implement valuation models. This may involve calculating present value, estimating growth rates, and assessing relevant market comparables.
Budgeting and Variance Analysis
Budgeting is a critical aspect of financial management, allowing organizations to plan and allocate resources effectively. Variance analysis involves comparing actual financial results against budgeted figures to identify deviations and take appropriate actions.
- Creating Budget Templates and Models: Design comprehensive budget templates that incorporate revenue projections, expense forecasts, and key performance indicators (KPIs).
- Analyzing Variances between Actual and Budgeted Results: Compare actual financial results to the budgeted figures and calculate variances. Analyze these variances to gain insights into performance drivers and identify areas for improvement.
Advanced Excel Financial Modeling Functions and Features
Excel offers a vast array of advanced functions and features that can significantly enhance financial modeling capabilities. Mastering these advanced tools will enable you to perform complex calculations, manipulate data, and automate processes.
Advanced Financial Functions
Excel provides several specialized financial functions to perform complex calculations, including:
- NPV (Net Present Value): Calculates the present value of future cash flows.
- IRR (Internal Rate of Return): Determines the rate of return for an investment.
- XIRR (Extended Internal Rate of Return): Calculates the internal rate of return for irregular cash flows.
- FV (Future Value) and PV (Present Value): Assess the future or present value of an investment or cash flow stream.
- PMT (Payment): Calculates the periodic payment required to repay a loan or investment.
Using Array Formulas for Complex Calculations
Array formulas allow you to perform calculations on multiple values simultaneously. These formulas can be used to solve complex financial calculations efficiently.
Data Validation and Auditing Tools
Excel provides various data validation and auditing tools to ensure data accuracy and integrity. These tools include data validation rules, formula auditing, and error checking.
Leveraging Excel’s Power Query and Power Pivot for Data Analysis
Excel’s Power Query and Power Pivot tools provide advanced data manipulation and analysis capabilities. Power Query allows you to extract, transform, and load data from various sources, while Power Pivot enables efficient data modeling and analysis with large datasets.
By mastering these advanced Excel functions and features, you can significantly improve your financial models’ accuracy, efficiency, and effectiveness.
Visualizing Financial Models with Excel
Visualizing financial models in Excel enhances the understanding and presentation of complex financial data. Effective visualization techniques help communicate insights, trends, and patterns in a clear and concise manner.
Creating Dynamic Charts and Graphs for Financial Analysis
Excel provides a wide range of chart types and customization options to present financial data effectively.
- Selecting the appropriate chart type based on the data and the message you want to convey.
- Formatting and labeling axes, data points, and legends for clarity.
- Utilizing dynamic ranges and named ranges to automate chart updates as data changes.
Excel’s Conditional Formatting for Data Visualization
Conditional formatting lets you apply visual cues to highlight specific data patterns or conditions. Utilize conditional formatting to:
- Identify trends, outliers, and data discrepancies.
- Create color scales or data bars to represent varying values.
- Apply icon sets to indicate performance levels or comparisons.
Building Interactive Dashboards for Financial Reporting
Dashboards provide an overview of key financial metrics and enable users to interact with the data.
- Designing a visually appealing and user-friendly layout.
- Incorporating slicers and filters to allow users to analyze specific subsets of data.
- Utilizing formulas and functions to automate calculations and dynamically update dashboard components.
Using Excel Add-ins for Enhanced Data Visualization Capabilities
Excel add-ins expand Excel’s capabilities for data visualization. Popular add-ins include Power BI, Tableau, and Google Data Studio. These add-ins offer advanced features and interactive visualizations, enabling you to create dynamic and visually compelling financial reports and dashboards.
Visualizing financial models in Excel can enhance comprehension, facilitate decision-making, and communicate insights more effectively.
Tips for Error Handling and Model Validation
Ensuring the accuracy and reliability of financial models is crucial for making informed decisions. Errors in financial models can lead to incorrect analyses and flawed conclusions.
Common Errors in Financial Models and How to Troubleshoot Them
Understand common errors that occur in financial models, such as circular references, formula errors, and data inconsistencies. Employ the following troubleshooting techniques:
- Utilize Excel’s error-checking tools and functions to identify and resolve errors.
- Use the “Trace Precedents” and “Trace Dependents” features to identify the source of errors.
- Review and validate formulas and references to ensure accuracy and consistency.
Techniques for Validating and Stress-Testing Financial Models
Validating financial models involves verifying the accuracy and reliability of calculations, assumptions, and results. Some techniques for model validation include:
- Cross-check calculations and results with external sources or industry benchmarks.
- Compare the outputs of different models built for the same purpose.
- Perform sensitivity analysis and assess the impact of changing assumptions on model outputs.
- Conduct “what-if” analysis to evaluate the model’s robustness and resilience under different scenarios.
Auditing and Documenting Financial Models for Transparency and Reliability
Proper documentation is crucial for maintaining transparency and ensuring the reliability of financial models. Adopt the following practices for auditing and documenting financial models:
- Document assumptions, methodologies, and formulas used in the model.
- Include a clear summary of inputs, calculations, and outputs in a separate documentation sheet.
- Regularly review and update the model to reflect business conditions or assumptions changes.
- Implement version control mechanisms to track changes and maintain a record of model revisions.
By implementing effective error handling and model validation techniques, you can enhance the accuracy and reliability of your financial models.
Collaboration and Sharing of Financial Models
Collaboration and sharing of financial models are essential for effective teamwork and seamless information exchange within an organization. Here are some best practices for securely and efficiently sharing financial models:
Sharing Excel Models Securely and Efficiently
When sharing Excel models:
- Utilize password protection to safeguard sensitive information.
- Share read-only versions of models to prevent accidental modifications.
- Use file-sharing platforms or collaborative tools to facilitate easy and secure sharing.
Collaborating on Financial Models using Excel’s Online Capabilities
Excel offers online capabilities for real-time collaboration, enabling multiple users to work simultaneously on a model. Leverage these features to:
- Track changes made by different users and resolve conflicts.
- Conduct virtual meetings to discuss and update the model in real-time.
Version Control and Tracking Changes in Shared Financial Models
Version control ensures that changes made to a shared model are tracked and recorded accurately.
- Assign unique version numbers or labels to different iterations of the model.
- Use Excel’s “Track Changes” feature or external version control tools to monitor modifications.
Best Practices for Protecting Sensitive Financial Data in Excel
Protecting sensitive financial data is paramount.
- Remove or obfuscate sensitive data before sharing models outside of secure networks.
- Encrypt files when transmitting or storing them in cloud services.
- Implement user-level access controls to restrict unauthorized access to sensitive information.
By adopting secure sharing and collaboration practices, you can facilitate effective teamwork while safeguarding sensitive financial information.
Conclusion
In this guide, we explored financial modeling fundamentals, set up Excel for financial modeling, learned various modeling techniques, and discovered advanced Excel functions and features.
By mastering the techniques and best practices outlined in this guide, you can become proficient in Excel financial modeling, enabling you to analyze financial data effectively, make informed decisions, and drive business success. Continuous learning, practice, and adaptation to evolving business conditions are critical to mastering financial modeling in Excel. Start applying these principles and techniques to excel in your financial modeling endeavors.
Get Started With a Prebuilt Template!
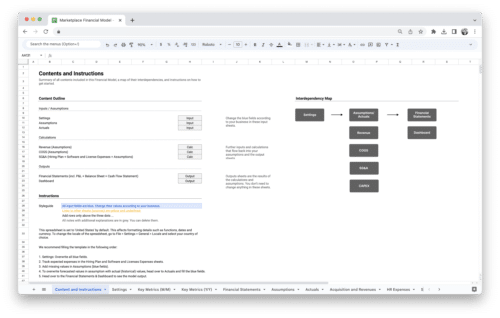
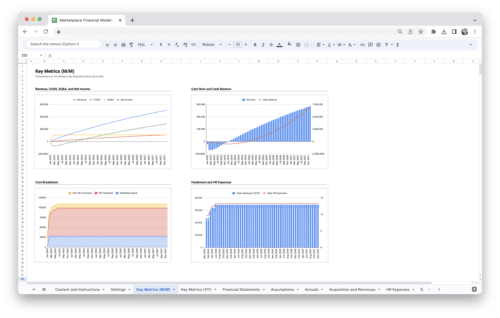
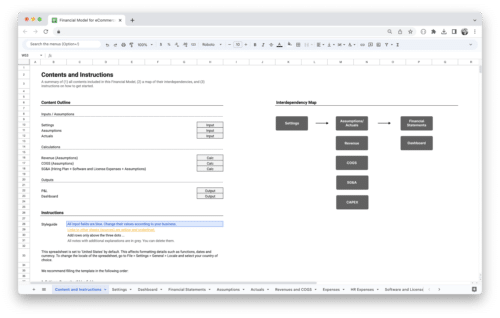
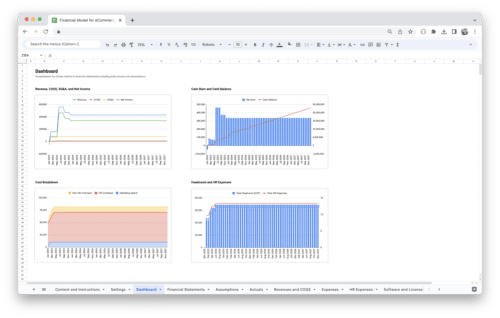
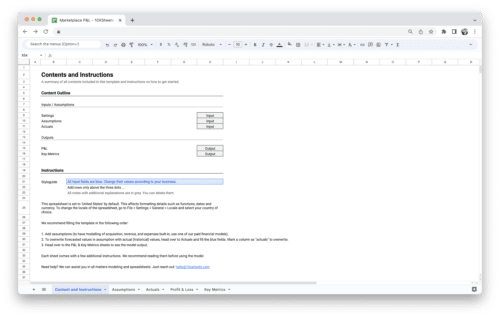
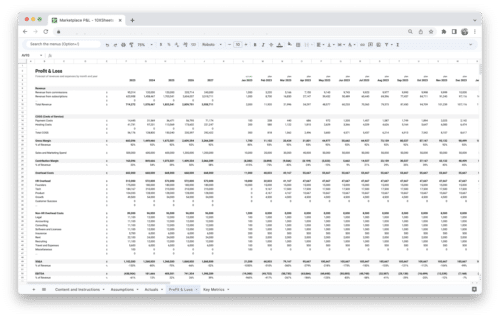
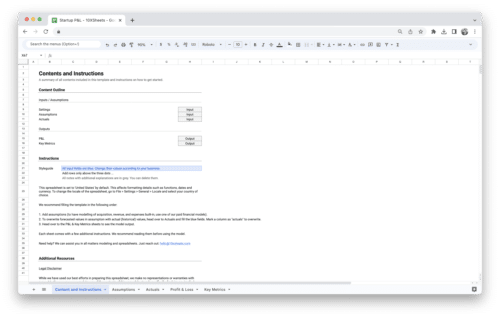
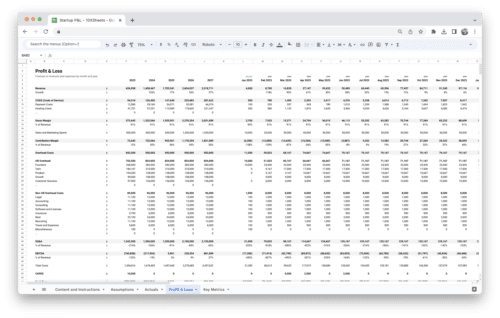
Looking to streamline your business financial modeling process with a prebuilt customizable template? Say goodbye to the hassle of building a financial model from scratch and get started right away with one of our premium templates.
- Save time with no need to create a financial model from scratch.
- Reduce errors with prebuilt formulas and calculations.
- Customize to your needs by adding/deleting sections and adjusting formulas.
- Automatically calculate key metrics for valuable insights.
- Make informed decisions about your strategy and goals with a clear picture of your business performance and financial health.

