Have you ever wondered how you can tell if your content is truly connecting with your audience? Engagement metrics are the key to answering that question. These metrics measure how people interact with your content, giving you insights into what resonates and what doesn’t. Whether you’re posting on social media, sending out emails, or tracking website visits, understanding engagement helps you figure out if your efforts are paying off.
From likes and comments to click-through rates and conversions, engagement metrics give you the real story behind the numbers. By knowing how to track and interpret these metrics, you can fine-tune your strategy, boost your results, and build a more engaged audience.
What are Engagement Metrics?
Engagement metrics are the quantitative measures used to assess how users interact with content across different digital platforms. These metrics track behaviors such as likes, shares, comments, click-through rates, and time spent on a page, providing insights into how effectively content is capturing the attention of the audience. Engagement metrics can be applied to various types of content, including social media posts, blog articles, emails, videos, and website interactions. They serve as a valuable indicator of the quality of your content, user interest, and the potential for driving deeper interactions or conversions.
The goal of measuring engagement is to gauge how much value your content is providing to your audience, helping you understand if your content resonates with them or if adjustments are needed. These metrics allow marketers to optimize their strategies, boost content relevance, and maintain strong relationships with their audience.
Importance of Engagement Metrics
Engagement metrics are crucial for several reasons:
- Insight into Audience Behavior: Engagement metrics provide direct feedback on how your audience responds to your content, allowing you to understand what appeals to them and what doesn’t.
- Content Optimization: By tracking engagement, you can identify which types of content perform best and create more of what your audience likes, ensuring your content strategy aligns with their preferences.
- Driving Conversions: Engagement metrics are closely linked to conversions. When users engage with your content, they are more likely to move down the sales funnel and complete desired actions, such as making a purchase or signing up for a newsletter.
- Improving Relationships: Higher engagement helps build stronger relationships with your audience. Engaged users are more likely to become loyal customers, advocates for your brand, and repeat visitors to your content.
- Monitoring Campaign Effectiveness: Engagement metrics allow you to track the performance of your campaigns in real-time, helping you determine what’s working, what needs improvement, and how to refine future strategies.
How Engagement Metrics Drive Success in Digital Marketing
Engagement metrics play a pivotal role in shaping the success of digital marketing efforts. They provide valuable data that can be used to refine strategies, optimize content, and achieve key business objectives. Here’s how engagement metrics drive success:
- Enhancing Content Relevance: By tracking metrics like clicks, shares, and comments, you can identify what types of content are most appealing to your audience. This allows you to create content that resonates more with your target demographic, ensuring your messaging is relevant and effective.
- Maximizing ROI: Engagement metrics help optimize your digital marketing spend. When you know which content or campaigns generate the most engagement, you can allocate resources more effectively, focusing on high-performing areas and maximizing your return on investment.
- Optimizing Customer Journeys: Engagement metrics help map out the customer journey, identifying touchpoints where customers are most likely to engage. This helps marketers refine their strategies and guide potential customers smoothly through the sales funnel, leading to higher conversion rates.
- Building Brand Loyalty: Consistent engagement with your audience fosters trust and brand loyalty. When users interact with your content and feel connected to your brand, they are more likely to return and make future purchases or recommend your products to others.
- A/B Testing and Optimization: Engagement metrics provide the data necessary for A/B testing, allowing you to experiment with different content formats, messaging, and strategies. Analyzing how each version performs can lead to more refined and effective campaigns that generate better results.
- Identifying Opportunities for Growth: Engagement metrics give you insights into areas where you can improve. If certain content types or platforms aren’t generating the engagement you expect, these insights can highlight opportunities to explore new strategies or adjust your approach.
Types of Engagement Metrics
Engagement metrics help you understand how people are interacting with your content across different channels. Depending on the platform and type of content, the way users engage can vary significantly. Knowing which metrics to track for each platform is crucial for optimizing your strategy and improving your results.
Social Media Engagement
Social media platforms are some of the most powerful tools for building relationships with your audience. Social media engagement metrics allow you to gauge the level of interaction and interest your audience has in your posts. These interactions can provide deep insights into what your audience likes, what resonates with them, and even what content they prefer to share with others.
Common metrics to track here include:
- Likes and Reactions: These are simple but effective indicators of how your audience feels about your content. While likes and reactions might not provide in-depth feedback, they are the easiest forms of engagement and can show how well your post is being received at a glance. However, they shouldn’t be the only measure of success, as they don’t necessarily reflect deeper interactions.
- Shares: When users share your content with their followers, it’s a sign that your content is not only resonating with them but also perceived as valuable enough to share. Shares extend your reach, allowing you to tap into your audience’s network and grow your community. This is one of the most powerful forms of engagement on social media.
- Comments: Comments go beyond the passive actions of liking or sharing. A comment indicates a deeper level of engagement, as users are taking the time to express their thoughts, ask questions, or provide feedback. The nature of the comments—whether they are positive, negative, or neutral—can provide valuable insights into how your audience perceives your content.
- Mentions and Tags: If users mention your brand or tag you in their posts, it signifies that your content has made an impact. Mentions and tags can show how your audience is integrating your brand into their own conversations, which can be a strong indicator of brand awareness and customer advocacy.
Website and Content Engagement
Your website is often the cornerstone of your online presence, and understanding how visitors engage with your content there is key to improving your user experience, increasing conversions, and keeping your audience coming back. Website engagement metrics give you a closer look at how visitors are interacting with your pages and where you might be losing them in the process.
- Time on Page: The longer someone spends on a page, the more likely it is that they find the content valuable. Time on page can tell you if your content is holding visitors’ attention. However, context matters here; a longer time spent on certain types of pages (like blog posts or educational content) is usually positive, while long times on other pages (like a product page without a conversion) might indicate confusion.
- Bounce Rate: Bounce rate is the percentage of visitors who leave your site after viewing only one page. A high bounce rate typically suggests that visitors aren’t finding what they expect or that your page isn’t providing enough value to encourage them to explore further. It’s an important metric to monitor, especially for landing pages and blogs, where you want users to engage with more content or convert to the next stage in the funnel.
- Pages per Session: This metric tells you how many pages a visitor views during a single session on your site. A high pages-per-session rate indicates that visitors are engaging with multiple pieces of content, exploring more areas of your site, and likely finding value in what you offer. This can be an indicator of a well-designed website or compelling content that keeps users interested.
- Exit Rate: While bounce rate looks at visitors who leave after just one page, exit rate tracks the pages on which people leave your site. If a specific page has a high exit rate, it could signal that users are hitting a dead end or aren’t finding the next step they’re supposed to take. This metric helps you identify bottlenecks or weak points in your user journey that may need optimizing.
Email Engagement
Email marketing is a powerful way to nurture relationships with your audience, but the key to success lies in engagement. Understanding how recipients interact with your emails can help you refine your email strategy, improve deliverability, and boost conversion rates.
- Open Rate: The open rate is one of the first indicators of how effective your subject line and sender name are. A higher open rate generally means your audience finds your emails interesting enough to click through and see more. However, a low open rate could mean your subject lines aren’t compelling or your email list might need updating.
- Click-Through Rate (CTR): The CTR tracks how many people clicked on a link within your email. Whether it’s a call to action, a product link, or a blog post, the CTR is a direct indicator of how well your email content resonates with your audience and whether your email is driving the desired actions. A high CTR means your message is relevant and that you’ve successfully prompted users to take the next step.
- Conversion Rate: While CTR measures immediate clicks, conversion rate tracks how many people went on to complete a desired action after clicking. This could be making a purchase, signing up for a webinar, or downloading a resource. Conversion rate is crucial for determining the overall effectiveness of your email campaigns in achieving business goals.
- Unsubscribe Rate: This metric tells you how many recipients opt out of your email list after receiving a message. A high unsubscribe rate can indicate that your emails aren’t relevant or that you’re sending too many. It’s a warning sign that you need to reassess your messaging frequency and quality to keep your audience engaged.
- Bounce Rate: In email marketing, bounce rate refers to the percentage of emails that weren’t delivered to the recipient’s inbox. A high bounce rate can be a sign of poor list quality or issues with email deliverability. Regularly cleaning your email list to remove invalid addresses can help keep this metric low.
Video Engagement
Video is one of the most engaging content formats available today. Whether it’s a YouTube video, a social media clip, or an embedded video on your website, measuring how your audience engages with video content can provide you with valuable insights into their preferences and behaviors.
- View Count: The view count is often the first metric people look at when evaluating video performance. While it shows how many times a video has been watched, it doesn’t tell you much about how engaged viewers are with the content. Still, a high view count can indicate that your video is drawing attention and reaching a large audience.
- Watch Time: Watch time refers to the total amount of time people spend watching your video. This metric is more valuable than view count because it gives you a better sense of how engaged your viewers are. If people are watching the video all the way through, that’s a sign that it’s holding their attention and delivering value.
- Engagement Rate: This metric measures how many viewers liked, commented, or shared your video. High engagement rates can indicate that your video is not just being watched but also prompting interaction and discussion. Engaged viewers are more likely to share your content, which can expand its reach even further.
- Completion Rate: Completion rate shows the percentage of people who watched your video from start to finish. A high completion rate typically means that your video content is strong and relevant to the viewers. If your completion rate is low, it may signal that your video is too long, lacks interest, or doesn’t deliver value quickly enough.
Each of these metrics provides a different layer of insight into how users engage with your video content, and they are all useful for refining your video strategy and improving future content.
Engagement metrics are not just numbers; they are reflections of how well your content resonates with your audience. Whether on social media, your website, in email campaigns, or through videos, these metrics can guide your content strategy, improve your communication, and help you build stronger, more lasting relationships with your audience.
Top Engagement Metrics to Track
When it comes to tracking engagement, there are several key metrics that provide actionable insights into how your audience interacts with your content. By understanding and leveraging these metrics, you can refine your strategy and improve your results. Below are the most important engagement metrics you should track across various platforms and channels.
Likes, Shares, and Comments
Likes, shares, and comments are some of the simplest and most direct forms of engagement. They represent how much your audience interacts with your content and indicate how well your message is resonating with them.
- Likes: Likes are the most basic form of engagement. They show that your content has captured the attention of your audience enough for them to give it a thumbs-up. However, likes alone don’t provide deep insight into user sentiment or intent. They are often used as a quick way for users to engage without much effort, so you shouldn’t overvalue them.
- Shares: Shares go beyond likes. When someone shares your content, it means they value it enough to pass it along to their own followers or friends. Shares help extend your reach and can indicate that your content is either particularly relevant or interesting. This metric is often a better indicator of the quality of your content because it shows that people want to share it with others.
- Comments: Comments offer the deepest form of engagement among these three metrics. When users leave comments on your posts, they are expressing their thoughts, feelings, or opinions about your content. Comments can give you direct feedback on what’s working, what’s not, and what your audience is thinking. Engaging with commenters also strengthens your relationship with your audience and can help build a community around your brand.
Click-Through Rate (CTR)
Click-through rate (CTR) is one of the most important metrics for assessing how effectively your content drives action. It’s a measure of how many users clicked on a link within your content, whether it’s a link to a product page, blog post, or call-to-action (CTA).
The formula for calculating CTR is:
CTR = (Total Clicks / Total Impressions) x 100
For example, if your email had 1,000 impressions (views) and 50 clicks on the link, your CTR would be:
CTR = (50 / 1,000) x 100 = 5%
A high CTR typically indicates that your content is compelling and that your audience finds the links within it to be relevant. A low CTR suggests that your content or CTA may need to be improved, whether by making the content more appealing, adjusting the call to action, or changing how the link is presented.
CTR is crucial in email marketing, social media, and online ads, as it tells you whether your content is prompting the action you want—whether that’s a click to read more, purchase, or engage further.
Bounce Rate
Bounce rate is a metric that measures how many visitors leave your site after viewing only one page. A high bounce rate generally signals that visitors aren’t finding what they expect on your site, or they’re not finding content that encourages them to explore further.
The formula for calculating bounce rate is:
Bounce Rate = (Single Page Sessions / Total Sessions) x 100
For example, if 300 visitors landed on your homepage and 180 of them left without clicking anything else, your bounce rate would be:
Bounce Rate = (180 / 300) x 100 = 60%
Bounce rate is particularly important for landing pages, blogs, and product pages. A high bounce rate on a landing page could indicate poor design, irrelevant content, or slow loading times. If users are bouncing from a product page, it could mean your product descriptions or images aren’t engaging enough, or that the page lacks clear CTAs.
However, it’s important to consider the context. For example, a blog post that provides all the information a user needs on one page may naturally result in a higher bounce rate, even though the user was satisfied with the content.
Average Session Duration
Average session duration measures how long, on average, visitors spend on your website during a session. It gives you an idea of how engaging your content is and whether users are finding value in it.
The formula for calculating average session duration is:
Average Session Duration = Total Time Spent on Site / Total Number of Sessions
For example, if visitors collectively spent 10,000 minutes on your website and there were 500 sessions, the average session duration would be:
Average Session Duration = 10,000 / 500 = 20 minutes per session
A longer session duration usually indicates that your content is compelling and that visitors are engaged with what you offer. However, the type of content matters; for instance, long-form blog posts will naturally have longer session durations than a simple landing page.
If your average session duration is low, it could be a sign that users are not finding the information they need quickly or that your site’s design or user experience isn’t optimized to keep visitors engaged.
Conversion Rate
Conversion rate is one of the most critical engagement metrics, as it measures how effective your content is at driving visitors to take the desired action, whether that’s making a purchase, filling out a form, or downloading a resource. Conversion rate shows the ultimate effectiveness of your content and marketing efforts.
The formula for calculating conversion rate is:
Conversion Rate = (Number of Conversions / Total Visitors) x 100
For example, if you had 100 visitors to your product page and 5 of them made a purchase, your conversion rate would be:
Conversion Rate = (5 / 100) x 100 = 5%
A higher conversion rate indicates that your content, offers, and design are aligning with what your audience is looking for. It shows that your content is successfully driving people to take the next step, whether that’s signing up for a newsletter, making a purchase, or any other action you want them to complete.
If your conversion rate is low, it could indicate several issues, such as a confusing user experience, an unclear call to action, or a mismatch between your audience’s expectations and what your content offers.
Social Media Reach and Impressions
Social media reach and impressions help you understand the visibility and spread of your content on social platforms. Both are key to evaluating the effectiveness of your content distribution.
- Reach refers to the number of unique users who have seen your content. It tells you how wide your message has spread and how many people have had the opportunity to engage with it. Reach is important for measuring brand awareness and growing your audience.
- Impressions refer to the total number of times your content has been displayed on someone’s feed, regardless of whether they interacted with it. Impressions provide insight into how often your content is being exposed to users.
The formula for calculating reach and impressions is relatively straightforward:
Reach = Number of Unique Users Who Saw Your Content
Impressions = Number of Times Your Content Was Displayed
For example, if your social media post reached 2,000 unique users and was displayed 5,000 times, your reach would be 2,000 and your impressions would be 5,000.
A high reach and a low number of impressions might suggest that while your content is reaching a broad audience, it’s not being shown multiple times, which could limit the effectiveness of your campaign. Conversely, a high number of impressions with a low reach may indicate that your content is being shown multiple times to the same users, which could be beneficial for reinforcement but not for expanding your audience.
Monitoring both reach and impressions helps you measure the success of your distribution efforts and can guide your strategy on when and how to post for maximum visibility.
Tracking these key engagement metrics allows you to make informed decisions about how to tweak your content and marketing strategies. Whether you’re refining your social media approach, optimizing your website for conversions, or improving your email campaigns, these metrics offer actionable insights that help you improve audience interaction and drive better results.
How to Measure Engagement?
Measuring engagement effectively requires more than just tracking metrics; it involves understanding what those metrics mean, how to interpret them, and how to use them to refine your strategy. By setting clear goals, using the right tools, and analyzing data in context, you can ensure that your efforts are leading to meaningful results.
1. Set Clear Objectives and KPIs
To measure engagement effectively, the first step is to set clear objectives for what you want to achieve. Whether you’re looking to increase brand awareness, boost conversions, or improve customer loyalty, having a well-defined goal is crucial for tracking progress. Your objectives should be specific, measurable, achievable, relevant, and time-bound (SMART).
Once you’ve set your goals, you can determine the Key Performance Indicators (KPIs) that will allow you to measure your success. KPIs act as quantifiable metrics that track the progress of your objectives. For instance, if your goal is to increase website traffic, your KPIs might include metrics such as page views, session duration, or click-through rate (CTR).
Here are a few examples of objectives and their corresponding KPIs:
- Objective: Increase social media engagement
KPIs: Likes, shares, comments, and follower growth rate. - Objective: Improve website conversions
KPIs: Conversion rate, bounce rate, and time on page. - Objective: Boost email marketing performance
KPIs: Open rate, click-through rate (CTR), and unsubscribe rate.
Setting the right KPIs allows you to focus on the metrics that matter most and avoid getting distracted by data that doesn’t directly contribute to your goals. These KPIs act as a compass, guiding your strategy and helping you understand what’s working and what needs improvement.
2. Use Analytics Tools and Platforms
Once you have your objectives and KPIs in place, it’s time to use the appropriate analytics tools to track and measure your engagement metrics. The right tools allow you to gather data, analyze it in real time, and make informed decisions that improve your performance.
There are numerous tools available for measuring engagement across different platforms:
- Google Analytics: Essential for website engagement, Google Analytics lets you track page views, bounce rate, average session duration, conversion rates, and more. It’s particularly useful for monitoring user behavior on your website and understanding how visitors interact with your content.
- Social Media Analytics: Platforms like Facebook Insights, Instagram Insights, and Twitter Analytics provide data on likes, shares, comments, reach, impressions, and follower growth. These tools help you assess the effectiveness of your social media campaigns and understand which posts are performing best.
- Email Marketing Platforms: Tools like Mailchimp, ConvertKit, and HubSpot provide detailed reports on email open rates, click-through rates, bounce rates, and unsubscribe rates. These platforms allow you to track the performance of individual email campaigns and optimize them for better results.
- Video Analytics: YouTube Analytics and Vimeo provide in-depth video engagement data, including view count, watch time, engagement rate, and completion rate. These platforms help you assess the effectiveness of your video content and identify opportunities for improvement.
Each of these tools provides data that can be used to track your KPIs and measure engagement across your channels. The key is to integrate these tools into your workflow and use the data to inform your strategy.
3. Understand the Context of Data
Data without context is meaningless. To measure engagement effectively, it’s essential to understand the story behind the numbers. For example, a high click-through rate (CTR) on an email might seem like a great result, but if the conversion rate is low, it suggests that while people are interested enough to click, they’re not taking the next step. This could indicate a problem with your landing page, offer, or follow-up process.
Context matters when analyzing metrics across different channels as well. A social media post with a high engagement rate might be performing well in terms of likes, shares, and comments, but that doesn’t necessarily mean it’s helping you meet your business goals. Are those interactions leading to website traffic or conversions? Are your social followers turning into paying customers? Without this broader perspective, engagement metrics can be misinterpreted.
Understanding the context of your data also involves considering external factors. Changes in seasonality, current events, or even a platform’s algorithm can affect how people engage with your content. A sudden drop in engagement might not be a reflection of your content’s quality but could be a result of external factors that you need to consider when analyzing the data.
A good way to add context to your metrics is by comparing them to historical data. For example, if your CTR is lower than usual, try looking at the performance from the same time last year or from similar past campaigns. This can help you determine whether the drop is an anomaly or part of a broader trend.
4. Benchmark Engagement Metrics
Benchmarking is the process of comparing your engagement metrics to industry standards or competitors. It allows you to assess how well you’re performing relative to others in your field and identify areas where you may need to improve.
Industry benchmarks vary by sector and platform, but they provide a useful reference point. For example, an average email open rate might range from 15% to 25% depending on the industry, while a good social media engagement rate could be around 1% to 5% for most platforms.
By comparing your performance to these benchmarks, you can determine whether your metrics are on par with industry standards or if there’s room for improvement.
To benchmark effectively:
- Identify Relevant Benchmarks: Look for benchmarks that are specific to your industry, business size, and content type. For example, if you run an e-commerce website, compare your conversion rates to industry averages for similar businesses. If you run a SaaS company, look at engagement rates for other tech companies.
- Monitor Trends Over Time: While comparing your metrics to competitors or industry averages provides valuable insight, it’s equally important to track your own performance over time. Are your engagement rates improving, staying the same, or declining? Long-term trends are often more useful than short-term comparisons, as they show how your content and campaigns are evolving.
- Use Benchmark Data to Set Realistic Goals: Knowing where you stand in relation to others can help you set realistic goals for the future. For example, if your social media engagement is below the industry benchmark, you might set a goal to increase it by 10% over the next quarter.
Benchmarking also provides a healthy dose of perspective. It’s easy to get discouraged if you’re not hitting a specific metric, but seeing that others in your industry are facing similar challenges can help you adjust your expectations and stay motivated.
Measuring engagement effectively is about more than just collecting data. It’s about setting clear goals, using the right tools, interpreting the data in context, and comparing your performance to industry benchmarks. By following these steps, you’ll be able to track your progress, refine your strategy, and ultimately achieve better results.
How to Interpret Engagement Metrics?
Measuring engagement is just the first step. The real value comes from understanding what the metrics are telling you and how you can use them to refine your strategy. To make sense of your data, it’s crucial to interpret engagement metrics in a meaningful way. This means identifying trends, understanding audience behavior, and distinguishing between different types of engagement.
Identifying Trends and Patterns
Engagement metrics give you a snapshot of your content’s performance, but to get actionable insights, you need to look at long-term trends and patterns. By analyzing how your engagement metrics change over time, you can identify what’s working and what isn’t.
One of the most powerful ways to spot trends is by comparing your metrics across different periods—whether that’s weekly, monthly, or annually. For example, if you notice a sudden spike in website visits during a specific campaign, it’s an indication that your marketing efforts are having a positive impact. On the other hand, a gradual decline in social media engagement might suggest that your audience is losing interest, or that your content strategy needs to be refreshed.
Calculating Trends
To calculate trends, you can use a simple percentage change formula to compare metrics over time:
Percentage Change = [(New Value – Old Value) / Old Value] x 100
For example, if your average session duration increased from 2 minutes to 3 minutes over the past month, your percentage change would be:
Percentage Change = [(3 – 2) / 2] x 100 = 50% increase
This formula can be applied to various engagement metrics like conversion rate, CTR, or bounce rate. Tracking percentage changes allows you to see growth or decline, helping you pinpoint areas of improvement.
When you see consistent growth in engagement, it’s a sign that your strategy is working. Conversely, if you notice downward trends, it’s time to reassess your content, messaging, or targeting. Identifying these patterns early can help you make adjustments before issues snowball.
Understanding the Impact of Audience Behavior
Engagement metrics are a reflection of how your audience behaves when interacting with your content. Understanding the motivations and preferences of your audience is key to improving engagement. People’s behavior is influenced by various factors, such as seasonality, current events, or personal preferences. To make sense of this behavior, you need to look beyond just the numbers and think about why certain actions are happening.
For example, if you see an uptick in social media comments after posting a controversial topic, it could indicate that your audience is more engaged when discussing polarizing issues. Alternatively, if your bounce rate is higher during certain times of the year, it may be due to seasonal fluctuations in interest or changing customer needs.
Audience behavior can also be influenced by how easy it is for them to interact with your content. A seamless, user-friendly experience encourages more engagement, while barriers like slow loading times, confusing navigation, or complicated forms can lead to a drop in interaction.
Understanding audience behavior also means recognizing patterns in the types of content that generate the most engagement. Do your followers prefer educational content, product showcases, or behind-the-scenes posts? Are certain types of videos, such as tutorials or testimonials, more likely to be shared? Understanding what resonates with your audience can help you produce more targeted content that drives higher engagement.
Passive vs. Active Engagement: Differentiating Between Engagement Types
Engagement can take many forms, and not all engagement is created equal. Understanding the difference between passive and active engagement helps you assess the depth of interaction your audience has with your content.
- Passive Engagement: This includes actions where users are involved but not necessarily contributing significantly to the conversation. Likes, views, and impressions fall into this category. While passive engagement can give you a sense of how many people are seeing or acknowledging your content, it doesn’t provide much insight into how much people care about it. For example, a high number of likes on a social media post may indicate that people find your content appealing on the surface, but it doesn’t tell you whether they are truly invested or whether it led to a deeper action, like a purchase or website visit.
- Active Engagement: Active engagement involves deeper interactions and a higher level of commitment from your audience. Comments, shares, clicks, and conversions are examples of active engagement. These actions show that users are more involved and motivated to interact with your content. For example, when a follower shares your post with their network or comments on a blog article, they are demonstrating a stronger connection with your brand. Active engagement typically leads to higher-quality relationships with your audience and is more likely to contribute to your business goals, such as lead generation or sales.
Understanding the difference between passive and active engagement is crucial for measuring the effectiveness of your content. While passive engagement metrics like views and likes are helpful for understanding the reach of your content, active engagement metrics like shares, comments, and conversions provide a better measure of how your audience is connecting with your brand on a deeper level.
In your strategy, aim to increase both types of engagement, but prioritize fostering active engagement. For example, if you see that your social media posts are getting lots of likes but few shares or comments, you may need to refine your content to make it more shareable or to prompt more conversation.
Interpreting engagement metrics involves understanding trends, audience behavior, and the quality of interactions. By identifying trends over time, understanding the motivations behind audience behavior, and differentiating between passive and active engagement, you can gain a deeper understanding of how your content resonates with your audience and make data-driven decisions to improve your strategy.
How to Optimize Engagement Based on Metrics?
Once you’ve gathered your engagement metrics, it’s time to turn that data into actionable insights. By optimizing your content and strategies based on these metrics, you can significantly improve the level of interaction your audience has with your brand. Understanding what works and what doesn’t allows you to refine your approach for maximum impact.
Tailoring Content to Audience Preferences
One of the most effective ways to optimize engagement is by tailoring your content to the preferences and interests of your audience. The more relevant your content is, the more likely it is to engage users, prompting them to interact, share, and take action.
To tailor your content effectively, start by analyzing your engagement metrics to understand which types of content perform best. For example, you might discover that your audience prefers video content over text-heavy blog posts or that posts about specific topics—such as industry trends, behind-the-scenes glimpses, or user-generated content—generate more likes and shares.
Once you identify the content types and topics that resonate most, you can focus on producing more of that content. If your audience engages heavily with educational or how-to content, consider creating in-depth tutorials, case studies, or tips that address their pain points or interests. If your audience prefers short, visual posts, then infographics, memes, or quick video snippets may drive better engagement.
Tracking your content’s performance over time can also help you refine your approach. Look for patterns in audience behavior, such as which topics generate the most comments or shares. You can even ask your audience directly by conducting surveys or polls to better understand their preferences.
By creating content that directly aligns with your audience’s tastes and needs, you’ll foster deeper engagement and build stronger connections with your community.
Adjusting Timing and Frequency of Posts
The timing and frequency of your posts can have a significant impact on engagement. If you post when your audience is most active, you’re more likely to get their attention and encourage interaction. On the other hand, posting at suboptimal times can lead to lower visibility and reduced engagement.
Start by analyzing your metrics to determine when your audience is most active. Most social media platforms provide insights into the best times to post based on when your followers are online. For instance, if you notice that posts published in the late afternoon get more engagement than those posted in the morning, adjust your posting schedule to target that time frame.
You should also monitor the frequency of your posts. Posting too frequently can overwhelm your audience, while posting too infrequently might cause your followers to lose interest. Track engagement levels relative to the number of posts you share, and experiment with different posting frequencies to find the sweet spot.
One useful method for determining the optimal posting frequency is to start with a baseline (e.g., posting once per day) and then gradually increase or decrease the number of posts while monitoring engagement metrics. Pay attention to whether engagement improves with increased frequency or drops off when you post too much.
By fine-tuning the timing and frequency of your posts based on audience behavior, you can increase visibility and keep your content fresh in your followers’ feeds, maximizing engagement.
A/B Testing to Improve Engagement
A/B testing, or split testing, is a powerful technique for optimizing engagement. It involves comparing two versions of a piece of content—such as a headline, image, or call-to-action—to see which one performs better. By testing different elements, you can gather data on what works and refine your strategy accordingly.
The process starts by creating two versions of a content piece that only differ in one element (such as the subject line, button color, or CTA phrasing). You then measure how each version performs using key engagement metrics like click-through rates, conversion rates, or social shares.
For example, let’s say you’re testing two subject lines for an email campaign:
- Version A: “Unlock Your Exclusive Discount Today”
- Version B: “Get 20% Off—Claim Your Deal Now”
You can calculate the CTR for each version and determine which subject line led to more clicks. The formula for calculating CTR is:
CTR = (Total Clicks / Total Impressions) x 100
If Version A gets 500 clicks out of 5,000 impressions, the CTR would be:
CTR = (500 / 5,000) x 100 = 10%
If Version B gets 600 clicks out of 5,000 impressions, the CTR would be:
CTR = (600 / 5,000) x 100 = 12%
By analyzing which version performs better, you can optimize your future content by incorporating the winning elements. A/B testing can be applied to various content types, from social media posts to landing pages and email campaigns, allowing you to make data-driven decisions that improve engagement.
Enhancing User Experience on Platforms
User experience (UX) plays a crucial role in engagement. If your platform is difficult to navigate or doesn’t provide a seamless experience, your audience is less likely to engage with your content. Optimizing the user experience is essential for keeping users engaged, improving satisfaction, and ultimately driving more conversions.
Begin by assessing how easy it is for users to access and interact with your content. Are your website’s navigation menus intuitive? Is it easy for users to find and click on calls-to-action (CTAs)? Consider simplifying the user journey so that visitors can quickly find the content or product they’re looking for.
Another key factor is page speed. If your site is slow to load, users are more likely to bounce, leading to a higher bounce rate and lower engagement. Tools like Google PageSpeed Insights can help you identify and fix performance issues on your site, ensuring that users don’t abandon your content due to slow loading times.
In addition to technical aspects, think about the design and layout of your platform. Is your content easy to read and digest? Are your visuals appealing? Consider testing different page layouts, typography, and color schemes to see what resonates with your audience. A clean, organized design improves the user experience, making it easier for visitors to interact with your content.
Finally, ensuring that your platform is mobile-friendly is essential. More people are consuming content on their phones than ever before, so optimizing your website or content for mobile devices is a must. Make sure your content looks great and is easy to navigate on smartphones and tablets.
Improving the overall user experience increases the chances that visitors will stay longer on your site, engage with your content, and ultimately take the desired actions, whether that’s making a purchase, signing up for a newsletter, or sharing your content on social media.
Optimizing engagement based on metrics is about continuously refining your content, strategies, and platforms to align with your audience’s preferences. By tailoring content to what your audience loves, adjusting your posting schedule, experimenting with A/B testing, and improving user experience, you’ll create more meaningful interactions that drive better results.
Challenges in Measuring Engagement
Measuring engagement is not always straightforward. There are several challenges that can make it difficult to accurately track and interpret engagement metrics. From data accuracy to external factors affecting behavior, these challenges require careful consideration to ensure that the insights you gather are valid and actionable.
- Data Quality and Accuracy: One of the most significant challenges in measuring engagement is ensuring the data you collect is accurate. Inaccurate tracking setups, technical glitches, or incorrect configuration of analytics tools can lead to skewed data, making it difficult to assess performance correctly. Ensuring proper tracking, regular audits, and data validation is crucial to avoid errors in your metrics.
- Platform Algorithms: Social media platforms and search engines frequently update their algorithms, which can impact the visibility of your content and therefore the engagement you receive. These changes can cause fluctuations in your metrics that have little to do with your actual performance and more to do with how content is being distributed by the platform’s algorithm.
- External Factors and Seasonality: Engagement can be influenced by external factors like economic trends, holidays, or global events. For instance, engagement might drop during the summer months as people take vacations, or rise during certain holiday seasons when people are more likely to shop. It’s essential to consider these factors when interpreting engagement metrics so that you don’t make misinformed conclusions based on temporary trends.
- Cross-Platform Tracking: Tracking engagement across multiple platforms can be difficult because each platform uses its own metrics and reporting system. Additionally, users might engage with your brand in different ways across platforms—liking a post on Instagram, commenting on a Facebook ad, and visiting your website from a Google search. It can be challenging to get a complete view of engagement without having a unified reporting system in place.
- Overcoming Data Noise: High volumes of data can sometimes overwhelm decision-making. It’s easy to get lost in the noise of irrelevant metrics or to chase trends that don’t align with your business objectives. Focusing on metrics that align with your KPIs, and regularly reviewing and prioritizing them, can help filter out the noise and provide clearer insights.
The Role of Engagement in Overall Strategy
Engagement is a critical component of your overall marketing and business strategy. It goes beyond just measuring how many likes or clicks your content receives. By analyzing engagement data, you can identify valuable insights that help shape your strategies for growth, customer retention, and brand loyalty.
- Building Customer Relationships: Engagement helps you build stronger relationships with your audience. The more your audience interacts with your content, the more likely they are to become loyal customers. Engagement creates an opportunity for meaningful conversations and connections, allowing you to foster trust and long-term relationships.
- Improving Content Strategy: Engagement metrics provide real-time feedback on the effectiveness of your content. By understanding which types of content resonate most with your audience, you can refine your content strategy to produce more relevant, valuable content that drives higher engagement and better results.
- Driving Conversions and Sales: Engagement directly impacts conversions. When users engage with your content, it signals a deeper level of interest, which can lead to more significant actions such as signing up for newsletters, purchasing products, or sharing content. Higher engagement typically correlates with higher conversion rates and, ultimately, increased revenue.
- Informing Brand Positioning and Messaging: The feedback garnered from engagement helps you understand your audience’s preferences, pain points, and interests. This information can be used to refine your brand messaging and positioning, ensuring that your communication aligns with your audience’s needs and expectations.
- Enhancing Customer Retention: Engagement isn’t just about attracting new customers—it’s also about retaining them. By keeping customers engaged with your brand, you can reduce churn and foster brand loyalty. Consistent, high-quality engagement nurtures a community that keeps returning, making them more likely to continue supporting your business over time.
- Increasing Brand Awareness: Highly engaging content is more likely to be shared, which increases the visibility of your brand. When your audience shares your content with their network, it expands your reach, bringing in new potential customers and increasing brand awareness.
- Measuring ROI and Campaign Effectiveness: Engagement metrics help measure the effectiveness of your campaigns, giving you a clear sense of what’s working and what isn’t. By linking engagement data to business goals like sales, lead generation, or brand awareness, you can measure your return on investment (ROI) and fine-tune your future campaigns for better results.
Conclusion
Engagement metrics are your window into understanding how well your content is performing and whether it’s truly resonating with your audience. By tracking metrics like likes, shares, comments, and click-through rates, you get a clear picture of what’s capturing attention and driving action. These metrics are more than just numbers—they’re signals that show what’s working, what needs improvement, and where you can focus your efforts next. The more you pay attention to these insights, the better you can refine your content and strategy to meet your audience’s needs and expectations.
Optimizing engagement is all about making informed decisions based on the data you collect. Whether it’s adjusting your content to better match your audience’s preferences, tweaking your posting schedule for maximum impact, or experimenting with A/B tests to see what performs best, every step you take to optimize engagement brings you closer to better results. Remember, engagement is not just about gaining attention—it’s about creating meaningful interactions that build trust, loyalty, and long-term success. Keep monitoring, keep experimenting, and most importantly, keep engaging with your audience. The more you connect, the stronger your brand will become.
Get Started With a Prebuilt Template!
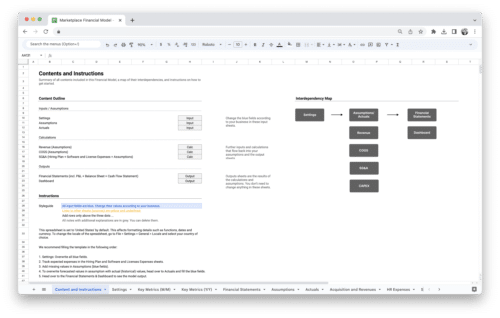
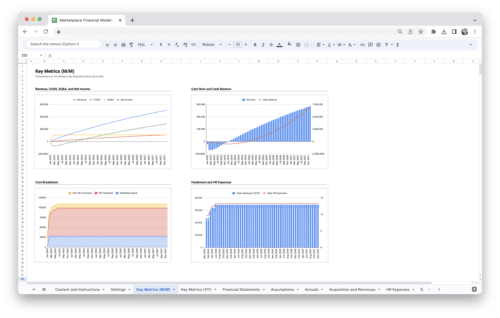
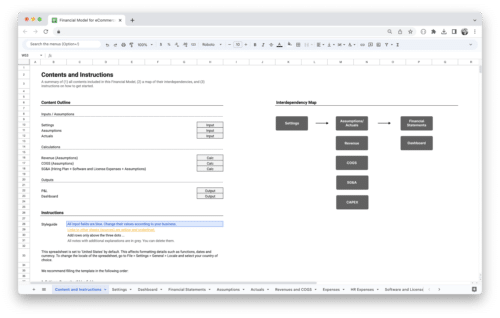
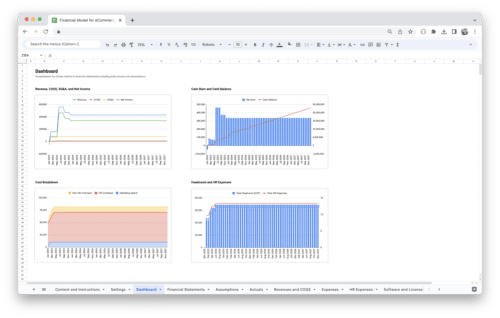
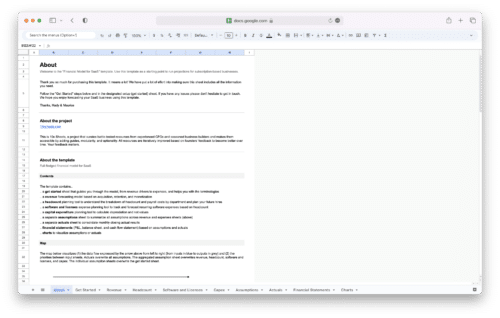
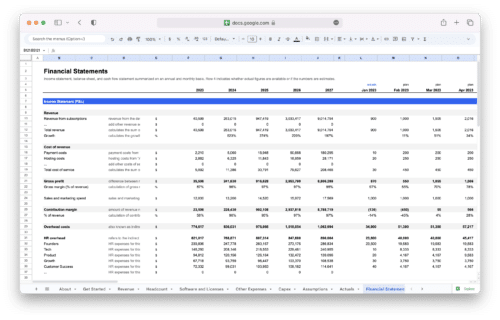
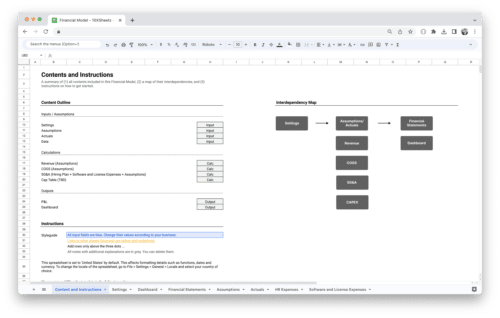
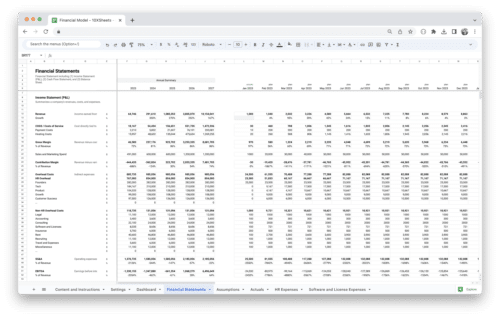
Looking to streamline your business financial modeling process with a prebuilt customizable template? Say goodbye to the hassle of building a financial model from scratch and get started right away with one of our premium templates.
- Save time with no need to create a financial model from scratch.
- Reduce errors with prebuilt formulas and calculations.
- Customize to your needs by adding/deleting sections and adjusting formulas.
- Automatically calculate key metrics for valuable insights.
- Make informed decisions about your strategy and goals with a clear picture of your business performance and financial health.

