Have you ever wondered what sets successful early-stage startups apart from the rest? The answer lies in their ability to track and analyze key metrics effectively. In the fast-paced world of startups, having a clear understanding of your business’s performance is crucial for making informed decisions and driving growth. From customer acquisition cost to market penetration, early-stage startup metrics provide valuable insights into every aspect of your business operations.
In this guide, we’ll explore the top metrics that early-stage startups should track, why they matter, and how you can leverage them to propel your startup towards success. Whether you’re a budding entrepreneur or a seasoned startup founder, mastering these metrics will empower you to navigate the challenges of startup life with confidence and precision.
Brief Overview of Early-Stage Startups
Early-stage startups are newly established businesses in their initial phases of development. These startups are typically characterized by innovative ideas, limited resources, and a focus on growth and market validation. Early-stage startups often operate in highly dynamic and competitive environments, facing challenges such as market uncertainty, resource constraints, and scalability issues. Despite these challenges, early-stage startups have the potential for rapid growth and disruptive innovation, making them attractive investment opportunities for venture capitalists and angel investors.
What Are Early-Stage Startup Metrics?
Early-stage startup metrics are key performance indicators (KPIs) and analytical measures used to evaluate the performance, progress, and viability of a startup in its early stages of development. These metrics provide valuable insights into various aspects of the startup’s operations, including customer acquisition, revenue generation, product development, and market traction. By tracking and analyzing these metrics, early-stage startups can make data-driven decisions, identify areas for improvement, and optimize their strategies for growth and success.
Importance of Tracking Metrics for Early-Stage Startups
- Assessment of Progress: Tracking metrics allows early-stage startups to assess their progress and performance against predefined goals and objectives. It provides clarity on whether the startup is moving in the right direction and achieving desired outcomes.
- Identification of Opportunities: Metrics help identify opportunities for growth, improvement, and optimization within the startup’s operations. By analyzing trends and patterns, startups can uncover areas where they can capitalize on opportunities or mitigate risks.
- Decision-Making Support: Metrics provide valuable data and insights that support informed decision-making. Whether it’s allocating resources, prioritizing initiatives, or pivoting strategies, having access to relevant metrics enables startups to make decisions based on empirical evidence rather than intuition or guesswork.
- Resource Optimization: Tracking metrics allows startups to optimize resource allocation and utilization. By identifying inefficiencies or areas of underperformance, startups can reallocate resources effectively to areas that yield the highest returns and drive sustainable growth.
- Investor Confidence: For startups seeking external funding, tracking metrics is essential for building investor confidence and credibility. Investors look for startups that have a clear understanding of their performance metrics and demonstrate a commitment to data-driven decision-making.
- Continuous Improvement: Metrics serve as benchmarks for continuous improvement and iteration. Startups can use metrics to set targets, monitor progress, and iterate on strategies to achieve better results over time.
In summary, tracking metrics is fundamental for the success and sustainability of early-stage startups. By monitoring key performance indicators, startups can gain insights, make informed decisions, and navigate the complexities of the startup journey with confidence and agility.
Key Performance Indicators (KPIs) for Early-Stage Startups
As an early-stage startup, understanding and tracking key performance indicators (KPIs) is essential for measuring the effectiveness of your business strategies and ensuring sustainable growth. Let’s explore some of the most critical KPIs and how they can impact your startup’s success.
Customer Acquisition Cost (CAC)
Customer Acquisition Cost (CAC) measures the average cost incurred to acquire a new customer. Calculating CAC involves summing up all marketing and sales expenses within a specific period and dividing that total by the number of customers acquired during the same period.
CAC = Total Marketing and Sales Expenses / Number of Customers Acquired
For instance, if your startup spends $10,000 on marketing and sales efforts in a month and acquires 100 customers during that time, your CAC would be $100.
Customer Lifetime Value (CLV)
Customer Lifetime Value (CLV) estimates the total revenue a customer is expected to generate over their entire relationship with your business. To calculate CLV, multiply the average revenue generated per customer by the average lifespan of a customer.
CLV = Average Revenue per Customer × Average Customer Lifespan
For example, if the average customer spends $50 per month and remains a customer for 12 months on average, the CLV would be $600.
Monthly Recurring Revenue (MRR)
Monthly Recurring Revenue (MRR) represents the predictable revenue generated from subscription-based products or services on a monthly basis. It’s a critical metric for startups with subscription models and can be calculated by summing up all recurring revenue from subscriptions.
MRR = Sum of Monthly Subscription Revenue
For instance, if your startup has 100 subscribers paying $20 each per month, your MRR would be $2,000.
Churn Rate
Churn Rate measures the percentage of customers who stop using your product or service within a specific period. It’s calculated by dividing the number of customers lost during that period by the total number of customers at the beginning of the period.
Churn Rate = (Number of Customers Lost / Total Customers at the Beginning of the Period) × 100
For example, if your startup starts the month with 500 customers and loses 50 customers by the end of the month, your churn rate would be 10%.
Burn Rate
Burn Rate indicates the rate at which your startup is consuming its cash reserves or investor funding. It’s calculated by subtracting total monthly expenses from total monthly revenue.
Burn Rate = Total Monthly Expenses – Total Monthly Revenue
For instance, if your startup has monthly expenses of $50,000 and generates $30,000 in revenue per month, your burn rate would be $20,000.
Runway
Runway refers to the estimated time (usually in months) until your startup exhausts its available cash reserves or funding, based on the current burn rate. It’s crucial for financial planning and sustainability.
Runway = Cash Reserves / Monthly Burn Rate
For example, if your startup has $200,000 in cash reserves and a monthly burn rate of $20,000, your runway would be 10 months.
Activation Rate
Activation Rate measures the percentage of new users who complete a specific action or reach a predefined level of engagement within a given timeframe. It’s an indicator of how effectively your startup converts sign-ups or downloads into active users.
Activation Rate = (Number of Activated Users / Total Sign-ups or Downloads) × 100
For example, if your startup has 500 sign-ups in a month and 300 of them become active users, your activation rate would be 60%.
Viral Coefficient
The Viral Coefficient quantifies the organic growth of your startup by measuring the number of new users acquired through referrals or word-of-mouth marketing. A viral coefficient greater than 1 indicates exponential growth.
Viral Coefficient = (Number of Invites Sent × Conversion Rate) – 1
For example, if each user sends out 10 invites and 20% of those invites convert into new users, the viral coefficient would be 2.
Customer Engagement Metrics
Customer Engagement Metrics encompass various indicators that measure the level of interaction and satisfaction among your user base, including:
- Active Users: The number of users who interact with your product or service within a specific time frame.
- User Retention Rate: The percentage of users who continue to use your product over time.
- User Engagement Rate: Metrics such as session duration, frequency of use, and feature adoption that reflect user engagement and satisfaction.
By tracking these metrics, you can assess the effectiveness of your product, identify areas for improvement, and foster long-term customer relationships.
Financial Metrics
Managing the financial aspects of your startup is crucial for its sustainability and growth. By tracking key financial metrics, you can gain insights into your startup’s profitability, cash flow, and funding needs. Let’s explore some essential financial metrics for early-stage startups.
Gross Profit Margin
Gross Profit Margin measures the percentage of revenue that exceeds the cost of goods sold (COGS). It provides insight into your startup’s profitability from core operations. The formula for gross profit margin is:
Gross Profit Margin = ((Total Revenue – COGS) / Total Revenue) × 100
For example, if your startup generates $100,000 in revenue and incurs $40,000 in COGS, the gross profit margin would be:
Gross Profit Margin = (($100,000 – $40,000) / $100,000) × 100 = 60%
A higher gross profit margin indicates greater efficiency in production or service delivery.
Net Profit Margin
Net Profit Margin measures the percentage of revenue that remains as net profit after deducting all expenses, including COGS, operating expenses, taxes, and interest. It provides a comprehensive view of your startup’s profitability. The formula for net profit margin is:
Net Profit Margin = (Net Profit / Total Revenue) × 100
For instance, if your startup generates $150,000 in revenue and incurs $80,000 in total expenses, including COGS, operating expenses, taxes, and interest, the net profit margin would be:
Net Profit Margin = (($150,000 – $80,000) / $150,000) × 100 = 46.67%
Maintaining a positive net profit margin is essential for sustaining operations and attracting investors.
Cash Flow
Cash Flow tracks the movement of cash in and out of your startup’s operations over a specific period. It provides insights into your startup’s liquidity and ability to meet financial obligations. The formula for cash flow is:
Cash Flow = Cash Inflows – Cash Outflows
For example, if your startup receives $50,000 in revenue and incurs $30,000 in expenses in a month, the cash flow would be:
Cash Flow = $50,000 – $30,000 = $20,000
Positive cash flow indicates that your startup is generating more cash than it’s spending, while negative cash flow may signal potential financial challenges.
Return on Investment (ROI)
Return on Investment (ROI) measures the profitability of an investment relative to its cost. It evaluates the efficiency of capital allocation and guides investment decisions. The formula for ROI is:
ROI = (Net Profit from Investment / Cost of Investment) × 100
For instance, if your startup invests $10,000 in a marketing campaign and generates $30,000 in additional revenue as a result, the ROI would be:
ROI = (($30,000 – $10,000) / $10,000) × 100 = 200%
A higher ROI indicates that an investment is generating significant returns relative to its cost.
Funding Metrics
Funding Metrics provide insights into your startup’s financing activities, including fundraising efforts, capital allocation, and runway management. Let’s explore two critical funding metrics:
Total Funding Amount
Total Funding Amount refers to the total capital raised by your startup from investors or other sources. It includes seed funding, venture capital, angel investment, and any other forms of financing.
Runway Based on Current Funding
Runway Based on Current Funding estimates the time until your startup exhausts its available cash reserves or funding, based on the current burn rate. It’s calculated by dividing the total funding amount by the monthly burn rate.
Runway = Total Funding Amount / Monthly Burn Rate
For example, if your startup has $500,000 in total funding and a monthly burn rate of $25,000, the runway would be:
Runway = $500,000 / $25,000 = 20 months
Ensuring a sufficient runway is essential for sustaining operations, achieving key milestones, and securing additional funding if needed.
Operational Metrics
Effectively managing your startup’s operations is vital for maximizing efficiency, productivity, and customer satisfaction. Operational metrics provide insights into various aspects of your business processes, allowing you to identify areas for improvement and optimize performance. Let’s explore some key operational metrics for early-stage startups.
Team Productivity Metrics
Tracking team productivity metrics enables you to assess the efficiency and effectiveness of your workforce. By measuring employee productivity and team efficiency, you can optimize resource allocation and improve overall performance.
Employee Productivity
Employee productivity measures the output or work completed by individual team members within a specific period. It can be calculated by dividing the total output (such as tasks completed or units produced) by the total number of hours worked.
Employee Productivity = Total Output / Total Hours Worked
For example, if an employee completes 50 tasks in a week and works 40 hours, the productivity would be:
Employee Productivity = 50 tasks / 40 hours = 1.25 tasks per hour
Monitoring employee productivity allows you to identify top performers, address inefficiencies, and optimize workflow processes.
Team Efficiency
Team efficiency measures the collective output of a team relative to the resources invested. It assesses how effectively the team collaborates and achieves its goals. Team efficiency can be calculated by dividing the total output by the total resources expended (such as time, manpower, or budget).
Team Efficiency = Total Output / Total Resources Expended
For instance, if a team completes 100 projects in a quarter with a budget of $50,000 and 1,000 hours of work, the team efficiency would be:
Team Efficiency = 100 projects / ($50,000 budget + 1,000 hours) = 0.002 projects per unit of resource
Improving team efficiency requires optimizing communication, streamlining processes, and fostering a collaborative work environment.
Customer Support Metrics
Delivering exceptional customer support is essential for building customer loyalty and satisfaction. By tracking key customer support metrics, you can identify areas for improvement and ensure timely resolution of customer issues.
Response Time
Response time measures the average time it takes for your customer support team to respond to customer inquiries or requests. It’s calculated by dividing the total time spent responding to inquiries by the total number of inquiries received.
Response Time = Total Time Spent Responding / Total Number of Inquiries
For example, if your customer support team spends a total of 10 hours responding to 100 inquiries, the average response time would be:
Response Time = 10 hours / 100 inquiries = 0.1 hours per inquiry
Minimizing response time demonstrates responsiveness and enhances the customer experience.
Resolution Time
Resolution time measures the average time it takes for your customer support team to resolve customer issues or inquiries. It’s calculated by dividing the total time spent resolving issues by the total number of issues resolved.
Resolution Time = Total Time Spent Resolving Issues / Total Number of Issues Resolved
For instance, if your customer support team spends a total of 20 hours resolving 50 issues, the average resolution time would be:
Resolution Time = 20 hours / 50 issues = 0.4 hours per issue
Reducing resolution time improves customer satisfaction and retention rates.
Product Development Metrics
Tracking product development metrics is essential for ensuring the timely delivery of high-quality products that meet customer needs and expectations. By measuring time to market and product quality metrics, you can optimize the product development process and enhance competitiveness.
Time to Market
Time to market measures the duration it takes for your startup to develop and launch a new product or feature. It’s calculated by subtracting the start date of product development from the launch date.
Time to Market = Launch Date – Start Date
For example, if your startup starts developing a new product on January 1st and launches it on March 1st, the time to market would be 2 months.
Reducing time to market enables you to capitalize on market opportunities and gain a competitive edge.
Product Quality Metrics
Product quality metrics assess the performance, reliability, and usability of your products or services. They include measures such as defect rates, customer satisfaction scores, and feature completeness.
By monitoring product quality metrics, you can identify areas for improvement, prioritize enhancements, and ensure customer satisfaction.
In summary, operational metrics play a critical role in optimizing your startup’s performance, productivity, and customer satisfaction. By tracking team productivity, customer support, and product development metrics, you can identify areas for improvement and drive success.
Market Metrics
Understanding the market landscape is crucial for the success of your startup. Market metrics provide insights into the size of your target market, your competitive position, and the effectiveness of your market strategies. Let’s explore some essential market metrics for early-stage startups.
Total Addressable Market (TAM)
The Total Addressable Market (TAM) represents the total revenue opportunity available for a product or service within a specific market. Calculating TAM involves estimating the total potential revenue that could be generated if every possible customer in the target market purchased your product or service.
TAM = Number of Potential Customers × Average Revenue per Customer
For example, if you’re targeting a market with 1,000 potential customers and the average revenue per customer is $100, the TAM would be $100,000.
Estimating TAM helps you assess the revenue potential of your startup and prioritize market segments with the greatest opportunities for growth.
Market Share
Market share measures the percentage of total sales revenue or units sold within a specific market that your startup captures. It indicates your startup’s competitive position relative to other players in the market.
Market Share = (Your Startup’s Sales Revenue / Total Market Sales Revenue) × 100
For instance, if your startup generates $50,000 in sales revenue within a market with total sales revenue of $500,000, your market share would be:
Market Share = ($50,000 / $500,000) × 100 = 10%
Tracking market share helps you evaluate your startup’s performance against competitors and identify opportunities for growth or market expansion.
Competitive Analysis Metrics
Competitive analysis metrics provide insights into your competitors’ strategies, performance, and market positioning. Let’s explore two critical competitive analysis metrics:
Competitor Growth Rate
Competitor growth rate measures the rate at which your competitors are expanding their market presence or revenue within a specific period. It’s calculated by comparing your competitor’s current market share to their market share in a previous period.
Competitor Growth Rate = ((Current Market Share – Previous Market Share) / Previous Market Share) × 100
For example, if a competitor’s market share increased from 15% to 20% over the past year, the competitor growth rate would be:
Competitor Growth Rate = ((20% – 15%) / 15%) × 100 = 33.33%
Analyzing competitor growth rates helps you identify emerging threats, assess market dynamics, and refine your market strategies.
Market Penetration
Market penetration measures the percentage of potential customers or market segments that your startup has successfully reached or acquired. It indicates the extent to which your startup has penetrated the target market.
Market Penetration = (Number of Customers Reached / Total Addressable Market) × 100
For instance, if your startup has acquired 200 customers in a market with a TAM of 1,000 potential customers, the market penetration would be:
Market Penetration = (200 / 1,000) × 100 = 20%
Increasing market penetration requires effective marketing, sales, and distribution strategies to reach a larger share of the target market.
In summary, market metrics provide valuable insights into your startup’s market opportunity, competitive landscape, and growth potential. By analyzing TAM, market share, competitor growth rates, and market penetration, you can make informed decisions and develop strategies to drive success in your target market.
Conclusion
Tracking key metrics is not just a matter of collecting numbers; it’s about gaining valuable insights into the health and trajectory of your early-stage startup. By monitoring metrics like customer acquisition cost, monthly recurring revenue, and market penetration, you gain a clearer understanding of your startup’s performance and potential areas for improvement. These metrics serve as guideposts along your startup journey, helping you make data-driven decisions, allocate resources effectively, and ultimately drive sustainable growth.
Remember, the path to success in the startup world is paved with challenges and uncertainties. However, armed with the right metrics and a commitment to continuous improvement, you can navigate these obstacles with confidence. Embrace the power of data, stay agile in your approach, and never underestimate the importance of tracking metrics in shaping the future of your startup. With determination, resilience, and a keen eye on the numbers, you’re well-positioned to chart a course towards success in the dynamic world of early-stage startups.
Get Started With a Prebuilt Template!
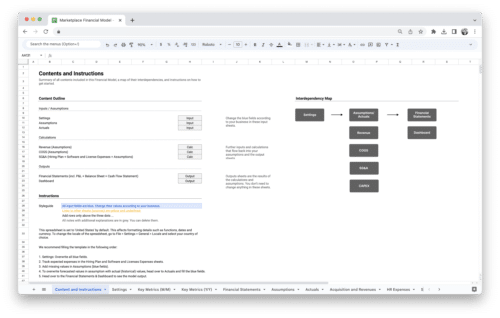
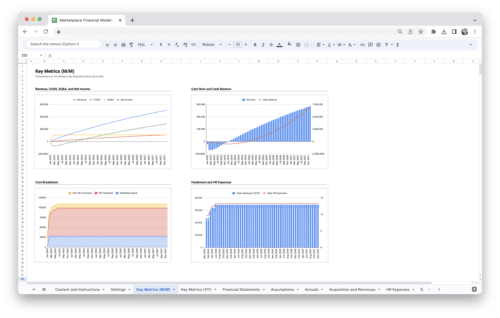
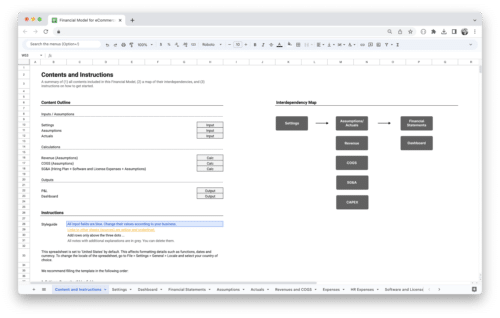
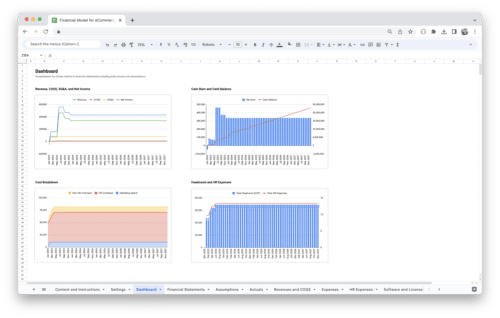
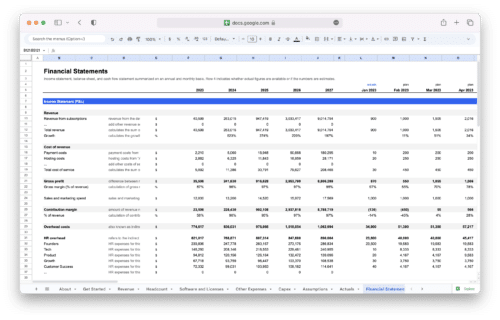
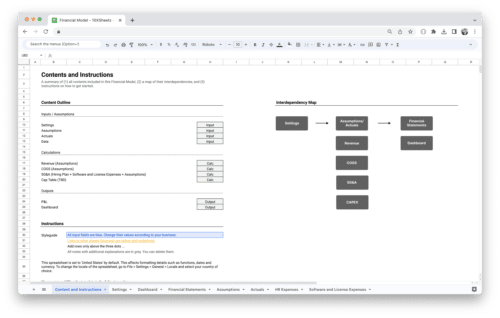
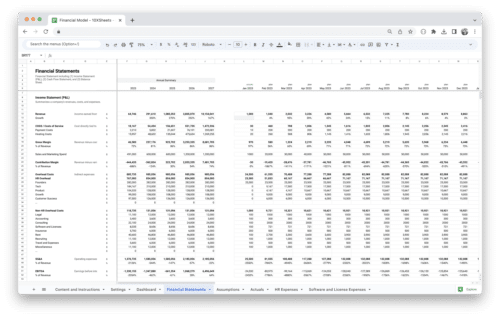
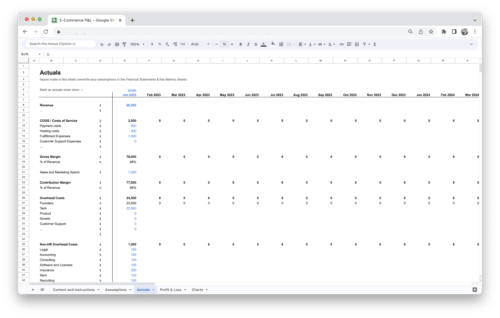
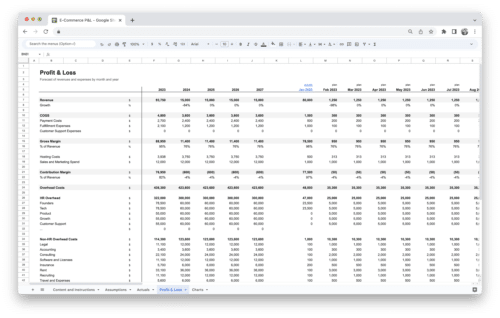
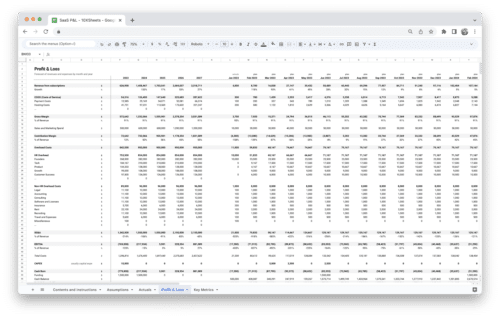
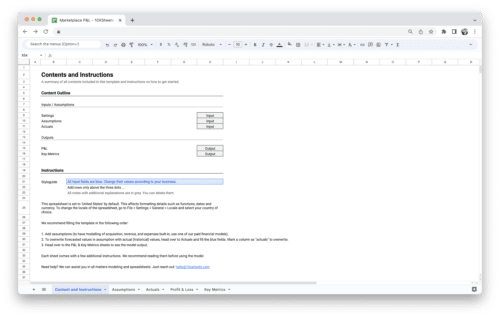
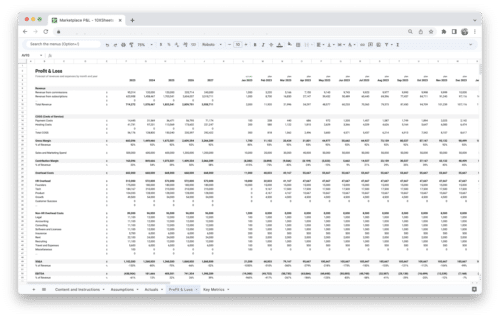
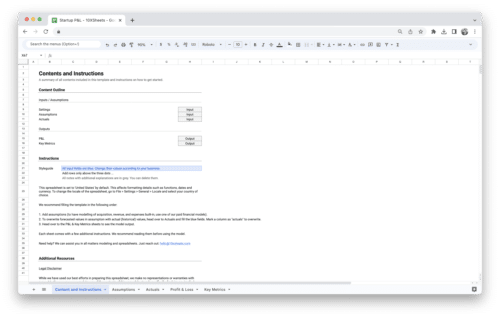
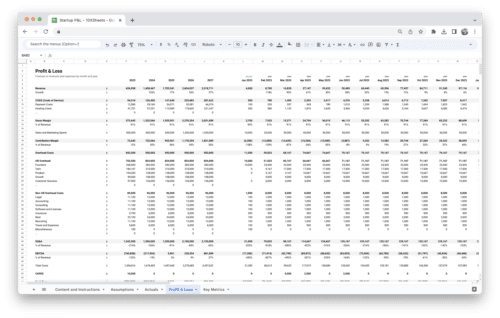
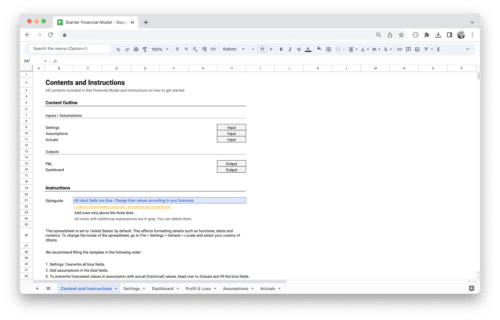
Looking to streamline your business financial modeling process with a prebuilt customizable template? Say goodbye to the hassle of building a financial model from scratch and get started right away with one of our premium templates.
- Save time with no need to create a financial model from scratch.
- Reduce errors with prebuilt formulas and calculations.
- Customize to your needs by adding/deleting sections and adjusting formulas.
- Automatically calculate key metrics for valuable insights.
- Make informed decisions about your strategy and goals with a clear picture of your business performance and financial health.

