- Understanding Data Sources
- Data Aggregation Techniques
- Data Aggregation in Different Domains
- Data Aggregation Tools and Technologies
- Effective Data Aggregation Best Practices
- Data Aggregation Examples
- Data Visualization and Reporting
- Data Aggregation Challenges and Limitations
- Data Aggregation for Business Intelligence
- Data Aggregation in Machine Learning and AI
- Data Aggregation and Regulatory Compliance
- Conclusion
Data aggregation is a crucial process in the world of data analysis, enabling you to combine and summarize large volumes of data from diverse sources to gain meaningful insights and make informed decisions. In this guide, we will delve into the depths of data aggregation, exploring its various techniques, tools, and best practices.
What is Data Aggregation?
Data aggregation involves the gathering and summarization of raw data into a cohesive, simplified form for analysis and reporting purposes. It allows you to transform complex datasets into more manageable and understandable formats, facilitating the extraction of valuable insights that may remain hidden in the unaggregated data.
Importance and Benefits of Data Aggregation
Data aggregation plays a pivotal role in numerous industries, including finance, healthcare, marketing, and more. Some key benefits of data aggregation include:
- Efficient Decision-Making: Aggregated data provides a clear and concise view of trends and patterns, enabling you to make well-informed decisions quickly and confidently.
- Enhanced Data Analysis: Aggregating data simplifies the analysis process by reducing the data volume, making it easier to identify trends and correlations.
- Improved Visualization: Aggregated data can be visualized through charts, graphs, and dashboards, aiding in better communication and understanding of complex information.
- Resource Optimization: Aggregation minimizes the storage and processing requirements, leading to efficient resource utilization.
Types of Data Aggregation
Data can be aggregated in various ways, depending on the nature of the data and the insights required. Common types of data aggregation include:
- Temporal Aggregation: Temporal aggregation involves grouping data based on time intervals, such as hourly, daily, weekly, or monthly periods. This method is useful for analyzing trends and seasonal patterns.
- Spatial Aggregation: Spatial aggregation groups data based on geographic location or areas. It is often employed in geographic information systems (GIS) and location-based analysis.
- Hierarchical Aggregation: Hierarchical aggregation involves aggregating data at different levels of a hierarchical structure. For example, aggregating sales data for a company can be done at the regional, departmental, and individual store levels.
- Attribute Aggregation: Attribute aggregation focuses on summarizing data based on specific attributes or characteristics. For instance, you can aggregate customer data based on demographics, interests, or purchase behavior.
Understanding Data Sources
Before diving into data aggregation, it’s essential to have a clear understanding of the data sources and their formats. We’ll show you how to identify reliable data sources and preprocess the data for aggregation.
Data Sources and Formats
Data can be sourced from various places, including databases, spreadsheets, APIs, and external data providers. It’s crucial to ensure that the data sources are reliable, relevant, and up-to-date for accurate aggregation.
Identifying Reliable Data Sources
To identify reliable data sources:
- Check Data Quality: Examine the data’s accuracy, completeness, and consistency.
- Verify Data Authority: Confirm the credibility and authority of the data provider.
- Assess Data Freshness: Ensure the data is regularly updated to reflect the latest information.
Data Preprocessing for Aggregation
Before aggregating data, preprocess it to handle any inconsistencies, missing values, or outliers. Follow these steps:
- Data Cleaning: Remove irrelevant or duplicate data points, correct errors, and standardize data formats.
- Data Transformation: Convert data into a consistent format for aggregation. For example, converting dates to a unified format.
- Handling Missing Values: Decide how to handle missing data – either impute missing values or exclude incomplete records.
- Dealing with Outliers: Address outliers that could skew the aggregation results. You can choose to remove, transform, or impute outliers based on the context.
Data Aggregation Techniques
Data aggregation involves several techniques that vary based on the type of data and the desired insights. Let’s explore some common aggregation techniques:
Summarization Techniques
Summarization techniques are used to create concise representations of data. They include:
- Counting and Summing: Counting the occurrences of categorical variables or summing numerical values to understand their frequency or total amount.
- Averaging and Weighted Averages: Calculating the mean or average value of a numerical attribute. In cases where some data points carry more significance than others, you can use weighted averages to give them more weight in the aggregation.
- Statistical Aggregation (Mean, Median, Mode): Utilizing statistical measures to summarize data, such as the mean (average), median (middle value), or mode (most common value).
- Aggregating Time-Series Data: Aggregating time-stamped data into fixed time intervals, e.g., hourly, daily, or monthly, to analyze trends over time.
Grouping and Categorization
Grouping and categorization involve organizing data into meaningful groups for analysis and comparison. These techniques encompass:
- Grouping Data by Attributes: Grouping data based on specific attributes, such as customer segments, product categories, or geographic regions.
- Categorical Data Aggregation: Summarizing categorical data using methods like frequency distribution and percentage representation.
- Creating Bins and Histograms: Dividing numerical data into bins or intervals to understand its distribution and pattern.
Time-Based Aggregation
Time-based aggregation allows you to analyze data over specific time periods or intervals. Key aspects of time-based aggregation include:
- Time Intervals and Granularity: Choosing appropriate time intervals (e.g., hourly, weekly) and granularity (level of detail) based on your analysis goals.
- Rolling Windows and Periodic Aggregation: Utilizing rolling windows to create aggregates over moving time intervals, which helps capture short-term trends and patterns.
Data Aggregation in Different Domains
Data aggregation finds application in various domains, each with its unique challenges and opportunities. Let’s explore how data aggregation is used in three prominent domains:
Business and Finance
In the business and finance domain, data aggregation is instrumental in:
- Sales and Revenue Aggregation: Summarizing sales and revenue data by product, region, or sales representative to evaluate performance and identify growth opportunities.
- Financial Statement Aggregation: Aggregating financial data from different accounts and periods to prepare financial statements like balance sheets and income statements.
- Customer and Market Segmentation: Grouping customers based on their preferences and behavior to develop targeted marketing strategies.
Healthcare and Life Sciences
In healthcare and life sciences, data aggregation plays a crucial role in:
- Medical Records Aggregation: Combining patient data from multiple sources to create comprehensive medical records for enhanced patient care and research.
- Clinical Trial Data Aggregation: Summarizing data from clinical trials to evaluate treatment effectiveness and safety.
- Health Trends and Analysis: Aggregating public health data to monitor trends, outbreaks, and disease prevalence for effective healthcare planning.
Internet of Things (IoT) and Sensor Data
In the realm of IoT and sensor data, data aggregation is essential for:
- Sensor Data Aggregation: Combining data from sensors distributed across various devices and locations to monitor and optimize system performance.
- IoT Data Analytics: Analyzing aggregated IoT data to uncover insights and improve device efficiency and reliability.
- Predictive Maintenance: Using aggregated sensor data to predict equipment failures and schedule maintenance proactively.
Data Aggregation Tools and Technologies
To facilitate the data aggregation process, various tools and technologies are available. Here are some popular options:
Spreadsheets
Spreadsheets, such as Microsoft Excel and Google Sheets, are versatile and widely-used tools for data aggregation. They offer a user-friendly interface that allows you to organize and manipulate data, perform basic calculations, and create simple visualizations.
With spreadsheets, you can:
- Aggregate Data: Use functions like SUM, AVERAGE, and COUNT to aggregate numerical data quickly.
- Data Cleaning: Utilize filters, sorting, and conditional formatting to clean and format data before aggregation.
- Data Transformation: Perform data transformations, such as merging and splitting cells, to prepare data for aggregation.
- Visualizations: Create basic charts and graphs to visualize aggregated data and trends.
Spreadsheets are particularly useful for small to medium-sized datasets or for quick and ad-hoc data aggregation tasks. They complement more robust data aggregation software and BI platforms, providing a lightweight solution for data manipulation and analysis.
Data Aggregation Software
Data aggregation software, such as Microsoft Power BI, Tableau, and Google Data Studio, provides user-friendly interfaces to aggregate, visualize, and analyze data from diverse sources.
Database Management Systems (DBMS)
DBMS like MySQL, PostgreSQL, and MongoDB efficiently store and manage large datasets, enabling seamless data retrieval and aggregation.
Big Data Frameworks
Frameworks like Apache Hadoop and Apache Spark can handle massive volumes of data, making them ideal for aggregating data at scale.
Business Intelligence (BI) Platforms
BI platforms integrate data from multiple sources, providing interactive dashboards and reports for comprehensive data analysis.
Effective Data Aggregation Best Practices
While data aggregation offers immense value, ensuring its accuracy and reliability is crucial. Follow these best practices to optimize your data aggregation process:
Data Privacy and Security Considerations
- Data Anonymization: When aggregating sensitive data, anonymize personal information to protect privacy.
- Data Encryption: Use encryption methods to safeguard data during transmission and storage.
Ensuring Data Quality
- Data Validation: Validate data to ensure it meets specified criteria and standards.
- Data Auditing: Regularly audit the data to identify and correct inconsistencies or errors.
Handling Large-Scale Data Aggregation
- Scalability Testing: Test the aggregation process with large datasets to identify and address potential bottlenecks.
- Parallel Processing: Utilize parallel processing techniques to accelerate data aggregation for large-scale datasets.
Performance Optimization Techniques
- Indexing: Index relevant attributes in databases to expedite data retrieval and aggregation.
- Materialized Views: Use materialized views to precompute aggregated data, enhancing query performance.
Regular Maintenance and Updates
- Data Refresh: Regularly refresh aggregated data to ensure it remains up-to-date and relevant.
- Error Monitoring: Implement error monitoring systems to detect and rectify issues promptly.
Data Aggregation Examples
To gain a deeper understanding of how data aggregation is applied in real-world scenarios, let’s explore some compelling examples across different industries:
Example 1: E-Commerce Sales Analysis
Scenario: A global e-commerce platform wants to analyze its sales data to identify popular products, peak sales periods, and regional performance.
Data Aggregation Approach:
- Temporal Aggregation: Aggregate daily sales data into monthly and quarterly summaries to observe overall sales trends over time.
- Grouping by Product Category: Group sales data by product categories, such as electronics, fashion, and home appliances, to determine the most popular product categories.
- Time-Series Aggregation: Apply time-series aggregation to analyze sales patterns on a weekly or monthly basis, allowing the company to adjust inventory and marketing strategies accordingly.
- Spatial Aggregation: Aggregate sales data by geographic regions or countries to identify top-performing markets and potential areas for expansion.
Example 2: Healthcare Patient Outcome Analysis
Scenario: A hospital network wants to assess patient outcomes for specific medical procedures to improve treatment protocols.
Data Aggregation Approach:
- Medical Records Aggregation: Combine patient records from various hospitals and departments to create a comprehensive dataset.
- Statistical Aggregation: Calculate the average recovery time, complication rates, and patient satisfaction scores for each medical procedure.
- Categorical Data Aggregation: Group patients based on age, gender, and medical history to analyze the impact of these factors on treatment outcomes.
- Time-Based Aggregation: Aggregate patient data over specific time intervals to evaluate treatment effectiveness and monitor long-term outcomes.
Example 3: Smart City Traffic Analysis
Scenario: A smart city project aims to optimize traffic flow and reduce congestion in the city.
Data Aggregation Approach:
- Sensor Data Aggregation: Aggregate real-time data from traffic cameras, GPS devices, and other sensors installed across the city.
- Spatial Aggregation: Group traffic data by road segments or intersections to analyze traffic patterns in specific areas.
- Time Intervals and Granularity: Aggregate data at different time intervals, such as hourly or daily, to observe traffic fluctuations throughout the day.
- Rolling Windows: Apply rolling windows to analyze short-term trends and identify traffic bottlenecks in real-time.
Example 4: Financial Portfolio Analysis
Scenario: An investment firm wants to assess the performance of its investment portfolios and optimize asset allocations.
Data Aggregation Approach:
- Financial Statement Aggregation: Aggregate financial data from multiple accounts and assets to create a comprehensive portfolio dataset.
- Time-Series Aggregation: Aggregate portfolio performance data over various time intervals, such as daily, weekly, or monthly, to analyze returns and risk metrics.
- Statistical Aggregation: Calculate average returns, volatility, and Sharpe ratios to evaluate the performance of different investment strategies.
- Categorical Data Aggregation: Group portfolios based on risk tolerance, investment objectives, and asset classes to identify top-performing investment strategies for different client profiles.
These examples demonstrate the versatility and importance of data aggregation in different domains. By effectively aggregating and analyzing data, organizations can uncover valuable insights, make data-driven decisions, and optimize their processes for enhanced efficiency and success. Whether it’s analyzing sales patterns, healthcare outcomes, traffic flow, or financial performance, data aggregation plays a pivotal role in transforming raw data into actionable knowledge.
Data Visualization and Reporting
Effective data visualization is essential for conveying aggregated insights to stakeholders. Consider the following aspects for impactful data visualization and reporting:
Importance of Data Visualization
- Visual Storytelling: Data visualizations tell compelling stories, making complex information accessible and engaging.
- Quick Understanding: Visual representations allow users to grasp key insights rapidly.
Choosing the Right Visualization Techniques
- Charts and Graphs: Select appropriate chart types (bar charts, line graphs, pie charts) based on the data attributes and the insights you want to convey.
- Interactive Visuals: Incorporate interactive elements in visualizations to allow users to explore the data on their own.
Interactive Dashboards and Reports
- Dashboards: Create interactive dashboards to present multiple visualizations and key performance indicators (KPIs) in a single view.
- Report Automation: Automate report generation to save time and maintain consistency in reporting.
Presenting Aggregated Data Insights
- Data Narratives: Accompany visualizations with data narratives that provide context and interpretation.
- Actionable Insights: Highlight actionable insights and recommendations based on the aggregated data.
Data Aggregation Challenges and Limitations
While data aggregation offers many advantages, it also comes with its set of challenges and limitations:
Data Integration Issues
- Data Silos: Integrating data from disparate sources can be challenging due to data silos and differing formats.
- Data Versioning: Managing multiple versions of data can lead to inconsistencies in the aggregated results.
Inconsistent Data Formats and Structures
- Data Mapping: Mapping data attributes from different sources to a standardized format can be complex and error-prone.
- Data Schema Evolution: Changes in data schema over time can impact data aggregation processes.
Handling Diverse Data Sources
- Data Cleaning and Transformation: Diverse data sources may require specific cleaning and transformation techniques.
- Data Validation: Ensure data from various sources adheres to the same validation rules.
Balancing Granularity vs. Data Loss
- Granularity Levels: Finding the optimal granularity level for aggregation to avoid losing essential details.
- Data Loss Trade-offs: Aggregating data can lead to loss of specific information, making it necessary to weigh the trade-offs carefully.
Data Aggregation for Business Intelligence
Data aggregation forms the backbone of business intelligence, enabling organizations to derive valuable insights from their data. Let’s explore how to leverage data aggregation for effective business intelligence:
Key Metrics and KPIs for Aggregation
- Identify Key Metrics: Determine the critical performance indicators and metrics you want to track for business success.
- Revenue and Profit: Aggregate sales and revenue data to analyze profitability and identify high-performing products or services.
- Customer Acquisition and Retention: Track customer acquisition and retention rates to gauge marketing and sales effectiveness.
Creating Business Reports and Dashboards
- Dashboard Design: Develop user-friendly dashboards that present aggregated data in an intuitive manner.
- Data Slicing and Dicing: Incorporate interactive features that allow users to slice and dice data for deeper analysis.
Predictive Analytics and Forecasting
- Data Time-Series Analysis: Use aggregated time-series data to identify historical trends and patterns.
- Predictive Modeling: Apply predictive analytics techniques to forecast future business performance and outcomes.
Data Aggregation in Machine Learning and AI
Data aggregation plays a vital role in preparing datasets for machine learning and AI models. Let’s explore how to aggregate data effectively for these applications:
Feature Engineering and Aggregation
- Feature Selection: Choose relevant features for model training to avoid overfitting.
- Feature Aggregation: Combine related features to create new, more informative features.
Aggregating Data for Training Datasets
- Balancing Data: Ensure balanced representation of classes in the training dataset to avoid bias in the model.
- Data Augmentation: Augment data by applying transformations to create additional training examples.
Aggregation in Reinforcement Learning
- State Aggregation: Combine similar states to reduce the complexity of the reinforcement learning problem.
- Action Aggregation: Aggregate similar actions to make the action space more manageable.
Data Aggregation and Regulatory Compliance
Data aggregation must adhere to various regulatory requirements and standards. Let’s explore compliance considerations in different domains:
GDPR and Data Aggregation
- Data Minimization: Ensure data aggregation follows the GDPR principle of minimizing data collection and storage.
- Lawful Basis for Processing: Validate that data aggregation aligns with one of the lawful bases for processing under GDPR.
HIPAA Compliance for Health Data Aggregation
- Protected Health Information (PHI): Ensure aggregated health data does not contain identifiable PHI without appropriate authorization.
- Business Associate Agreements: Establish and maintain business associate agreements with entities involved in data aggregation.
Financial and Industry Regulations
- PCI DSS Compliance: Comply with Payment Card Industry Data Security Standard when aggregating financial data related to credit card transactions.
- Industry-Specific Regulations: Be aware of industry-specific regulations that may apply to your data aggregation practices.
Conclusion
Throughout this journey, we explored the diverse techniques, tools, and best practices for data aggregation. By now, you should have a clear understanding of how to aggregate data effectively to derive valuable insights and make informed decisions.
Remember, data aggregation is not a one-size-fits-all approach. It requires careful consideration of the data sources, aggregation techniques, and the specific needs of your organization. As you embark on your data aggregation journey, ensure compliance with relevant regulations and continuously monitor and optimize your aggregation processes to extract the most value from your data.
Get Started With a Prebuilt Template!
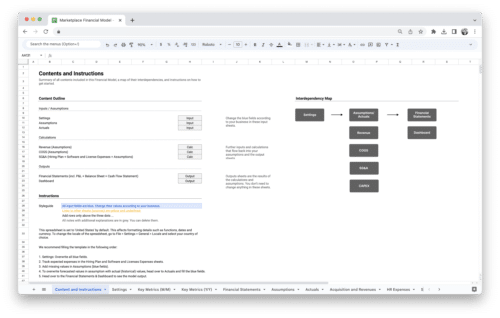
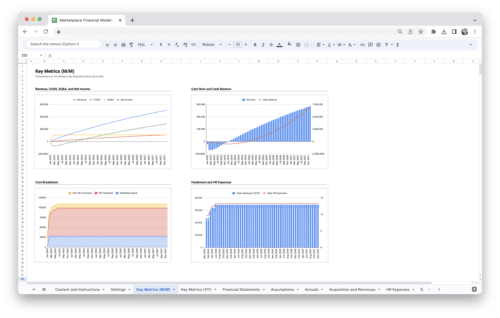
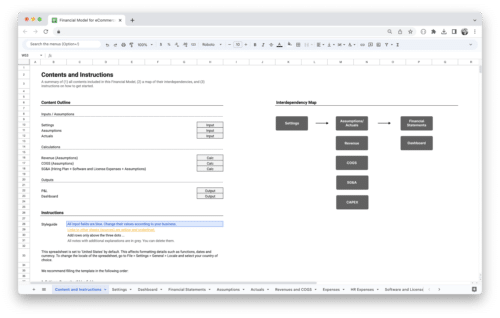
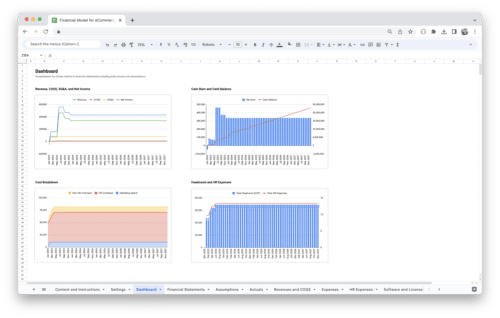
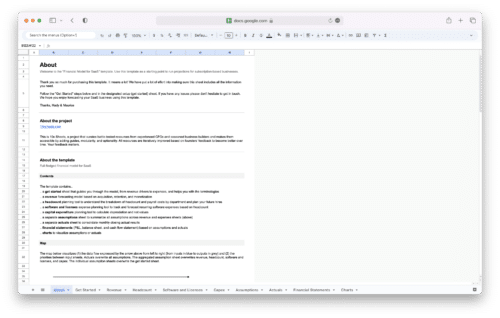
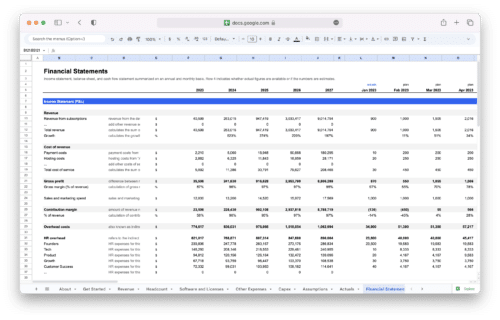
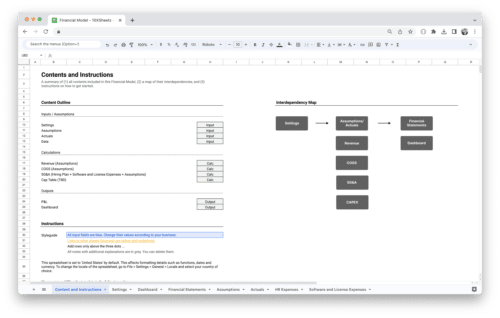
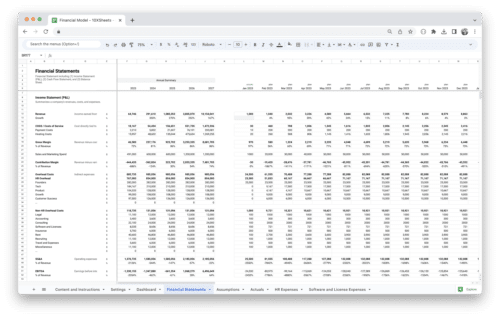
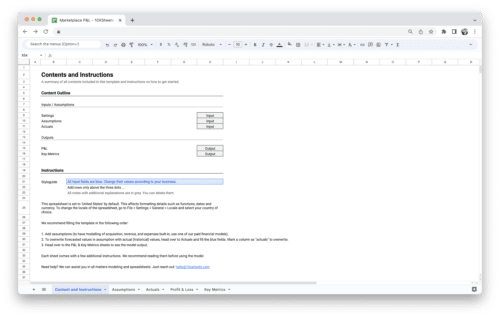
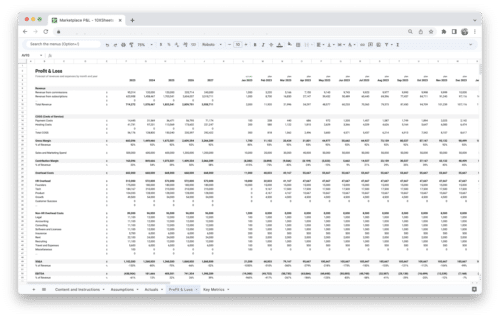
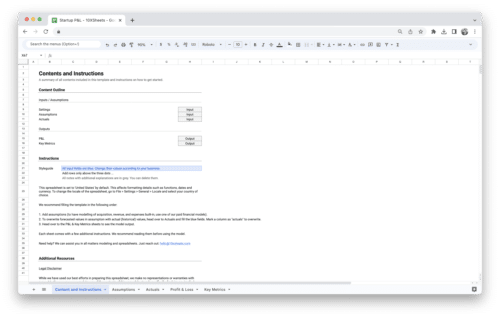
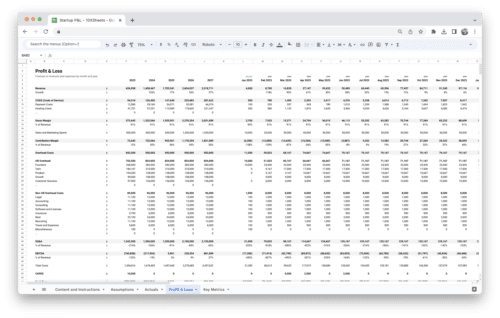
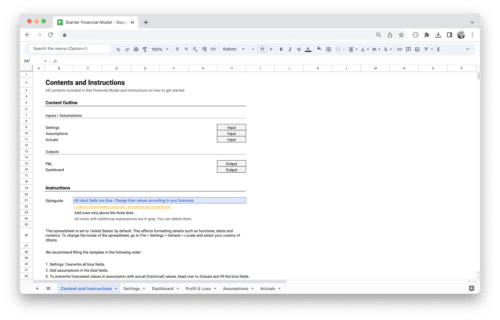
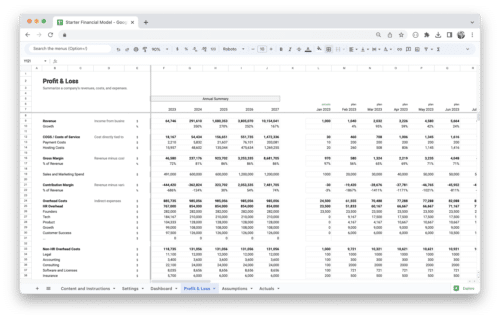
Looking to streamline your business financial modeling process with a prebuilt customizable template? Say goodbye to the hassle of building a financial model from scratch and get started right away with one of our premium templates.
- Save time with no need to create a financial model from scratch.
- Reduce errors with prebuilt formulas and calculations.
- Customize to your needs by adding/deleting sections and adjusting formulas.
- Automatically calculate key metrics for valuable insights.
- Make informed decisions about your strategy and goals with a clear picture of your business performance and financial health.

