Ever wondered what sets successful businesses apart from the rest? It often boils down to their ability to effectively track, analyze, and leverage key business metrics. In today’s competitive landscape, data-driven decision-making is paramount for driving growth and staying ahead of the curve.
In this guide, we’ll delve into the top business metrics every company should know and track. From measuring financial performance to evaluating customer satisfaction and optimizing employee productivity, we’ll explore how these metrics can empower organizations to make informed decisions, identify opportunities, and drive sustainable success.
What are Business Metrics?
Business metrics are quantifiable measures used to track, analyze, and assess various aspects of a business’s performance. These metrics provide valuable insights into different areas of operations, helping organizations make data-driven decisions, identify opportunities for improvement, and measure progress towards strategic objectives. Business metrics can encompass a wide range of key performance indicators (KPIs) across departments and functions, including sales, marketing, finance, operations, and customer service. They serve as vital tools for evaluating performance, optimizing processes, and driving organizational success.
Importance of Business Metrics
Business metrics play a crucial role in enabling organizations to:
- Measure Performance: Business metrics allow organizations to measure the performance and effectiveness of their operations, strategies, and initiatives. By tracking key metrics, businesses can assess their progress towards goals and objectives, identify areas of success, and pinpoint areas needing improvement.
- Make Informed Decisions: Data-driven decision-making is essential for business success. Business metrics provide actionable insights and empirical evidence that guide decision-makers in identifying opportunities, mitigating risks, and allocating resources effectively. By leveraging data-driven insights, organizations can make informed decisions that drive growth and profitability.
- Identify Trends and Patterns: Analyzing business metrics over time enables organizations to identify trends, patterns, and correlations in their data. This helps in understanding market dynamics, customer behavior, and competitive landscapes, allowing businesses to adapt strategies and stay ahead of the curve.
- Optimize Processes: Business metrics help organizations identify inefficiencies, bottlenecks, and areas of underperformance within their processes. By pinpointing areas for improvement, businesses can implement targeted interventions, streamline operations, and optimize workflows to enhance productivity and efficiency.
- Evaluate Success and ROI: Business metrics provide a framework for evaluating the success and return on investment (ROI) of various initiatives, projects, and campaigns. By quantifying outcomes and results, organizations can assess the effectiveness of their investments, justify expenditures, and allocate resources strategically.
- Drive Accountability and Alignment: Establishing clear, measurable metrics fosters accountability among employees and teams. By setting targets and tracking progress against predefined metrics, organizations can ensure alignment with strategic objectives, foster a culture of performance excellence, and incentivize achievement.
In summary, business metrics are essential tools for measuring, analyzing, and optimizing performance across all facets of an organization. By leveraging business metrics effectively, organizations can drive continuous improvement, enhance decision-making, and achieve sustainable growth in today’s dynamic business environment.
Key Performance Indicators (KPIs)
Understanding key performance indicators (KPIs) is crucial for assessing the health and progress of your business. KPIs are measurable values that demonstrate how effectively a company is achieving its key business objectives. Let’s delve deeper into the significance of KPIs and explore the various types you should consider tracking.
What are KPIs?
KPIs serve as quantifiable metrics that businesses use to evaluate their success in reaching strategic goals. These indicators provide insight into performance across different aspects of the business, enabling informed decision-making and strategic planning. By defining and monitoring KPIs, organizations can gauge their progress, identify areas for improvement, and drive sustainable growth. Once your KPIs are defined, the next step is to analyze them and create KPI dashboards to monitor your performance regularly.
Types of KPIs
Financial KPIs
Financial KPIs focus on assessing the monetary aspects of a company’s performance. These metrics provide insights into revenue generation, profitability, and financial stability. Common financial KPIs include:
- Revenue Growth Rate: Measures the percentage increase or decrease in revenue over a specific period, indicating the company’s sales performance.
- Formula: ((Current Period Revenue – Previous Period Revenue) / Previous Period Revenue) * 100%
- Example: If your revenue for the current period is $100,000 and for the previous period was $80,000, then the revenue growth rate would be (($100,000 – $80,000) / $80,000) * 100% = 25%
- Gross Profit Margin: Represents the percentage of revenue retained after deducting the cost of goods sold, reflecting the company’s profitability.
- Formula: (Gross Profit / Total Revenue) * 100%
- Example: If your gross profit is $50,000 and total revenue is $150,000, then the gross profit margin would be ($50,000 / $150,000) * 100% = 33.33%
- Return on Investment (ROI): Calculates the return generated from investments relative to their cost, assessing the effectiveness of resource allocation.
Operational KPIs
Operational KPIs assess the efficiency and effectiveness of internal processes and workflows within an organization. These metrics help optimize operations, enhance productivity, and streamline resource utilization. Examples of operational KPIs include:
- Cycle Time: Measures the time it takes to complete a specific task or process, highlighting areas for optimization and efficiency improvement.
- Formula: Total time to complete a process or task
- Example: If it takes 5 hours to complete a manufacturing process, then the cycle time would be 5 hours.
- Inventory Turnover Ratio: Indicates how quickly inventory is sold or used within a given period, reflecting inventory management efficiency.
- Formula: Cost of Goods Sold / Average Inventory
- Example: If the cost of goods sold is $500,000 and the average inventory value is $100,000, then the inventory turnover ratio would be $500,000 / $100,000 = 5
- Customer Service Response Time: Tracks the time taken to respond to customer inquiries or support requests, ensuring timely and satisfactory customer interactions.
- Formula: Total time taken to respond to customer inquiries or support requests
- Example: If it takes 1 hour to respond to a customer inquiry, then the response time would be 1 hour.
Customer KPIs
Customer KPIs focus on measuring customer satisfaction, loyalty, and engagement levels. These metrics provide insights into the customer experience, preferences, and overall satisfaction with products or services. Key customer KPIs include:
- Net Promoter Score (NPS): Measures customer loyalty and satisfaction by asking how likely customers are to recommend the company to others.
- Formula: % Promoters – % Detractors
- Example: If 30% of customers are promoters and 10% are detractors, then the NPS would be 30 – 10 = 20
- Customer Lifetime Value (CLV): Predicts the total revenue a business can expect from a single customer over their entire relationship, guiding customer acquisition and retention strategies.
- Formula: (Average Purchase Value x Purchase Frequency) x Customer Lifespan
- Example: If the average purchase value is $100, purchase frequency is 2 times per month, and the customer lifespan is 2 years, then the CLV would be ($100 x 2) x (2 x 12) = $4,800
- Customer Churn Rate: Indicates the percentage of customers who stop using a company’s products or services within a given period, highlighting retention challenges and opportunities.
- Formula: (Number of Customers at Start of Period – Number of Customers at End of Period) / Number of Customers at Start of Period
- Example: If you have 500 customers at the start of the month and 450 customers at the end, then the churn rate would be (500 – 450) / 500 = 0.1 or 10%
Employee KPIs
Employee KPIs assess the performance, engagement, and satisfaction of employees within an organization. These metrics help optimize workforce management, foster a positive work culture, and drive employee productivity. Examples of employee KPIs include:
- Employee Turnover Rate: Measures the percentage of employees who leave the company within a specific period, reflecting employee satisfaction and retention efforts.
- Formula: (Number of Employees Who Left / Total Number of Employees) * 100%
- Example: If 20 employees leave out of a total of 200, then the turnover rate would be (20 / 200) * 100% = 10%
- Employee Satisfaction Score: Surveys employees to assess their level of job satisfaction, engagement, and overall happiness within the organization.
- Formula: (Number of Satisfied Employees / Total Number of Employees) * 100%
- Example: If 150 out of 200 employees report being satisfied, then the satisfaction score would be (150 / 200) * 100% = 75%
- Training and Development ROI: Calculates the return on investment from employee training and development initiatives, assessing their impact on employee performance and skill enhancement.
- Formula: (Gain from Investment – Cost of Investment) / Cost of Investment
- Example: If the gain from training is $50,000, the cost of investment is $20,000, then the ROI would be ($50,000 – $20,000) / $20,000 = 1.5 or 150%
Selection Criteria for KPIs
Choosing the right KPIs is essential for accurately assessing performance and driving organizational success. When selecting KPIs, consider the following criteria:
- Alignment with Strategic Goals: Ensure that KPIs are directly linked to your company’s overarching objectives and key priorities.
- Measurability: Select KPIs that can be quantified and tracked using reliable data sources and measurement techniques.
- Relevance: Choose KPIs that are relevant to your industry, business model, and specific areas of focus.
- Actionability: Focus on KPIs that provide actionable insights and drive meaningful improvements in performance and outcomes.
- Timeliness: Select KPIs that can be measured and monitored in a timely manner, allowing for proactive decision-making and course corrections.
By adhering to these selection criteria, you can ensure that your chosen KPIs effectively measure progress, drive performance improvements, and support your overall business objectives.
Financial Metrics
Understanding and effectively managing financial metrics is essential for ensuring the long-term success and sustainability of your business. From tracking revenue generation to evaluating profitability and liquidity, these metrics provide valuable insights into your company’s financial health and performance. Let’s delve deeper into these key financial metrics and their calculation formulas.
Revenue Metrics
Revenue metrics are vital indicators of your business’s sales performance and income generation. By analyzing these metrics, you can assess the effectiveness of your sales strategies and identify opportunities for growth.
- Total Revenue: Total revenue represents the overall income generated by a business from its primary operations, including sales of goods or services.
- Revenue Growth Rate: The revenue growth rate measures the percentage increase or decrease in revenue over a specific period, indicating the trajectory of sales performance.
- Formula: ((Current Period Revenue – Previous Period Revenue) / Previous Period Revenue) * 100%
- Example: If your revenue for the current period is $100,000 and for the previous period was $80,000, then the revenue growth rate would be (($100,000 – $80,000) / $80,000) * 100% = 25%
- Average Revenue Per User (ARPU): ARPU calculates the average revenue generated per customer or user within a given period, providing insights into customer spending patterns and potential revenue streams.
- Formula: Total Revenue / Number of Customers
- Example: If your total revenue for a month is $10,000 and you have 100 customers, then the ARPU would be $10,000 / 100 = $100 per customer.
- Revenue by Product or Service: Analyzing revenue generated by different products or services helps businesses identify top-performing offerings and allocate resources effectively.
- Formula: Total Revenue from Product or Service / Total Revenue
- Example: If your total revenue is $500,000 and revenue from Product A is $100,000, then the revenue contribution from Product A would be $100,000 / $500,000 = 20%.
Profitability Metrics
Profitability metrics assess your company’s ability to generate profit from its operations and investments. These metrics are crucial for evaluating financial performance and sustainability. Here are some key profitability metrics along with their calculation formulas:
- Gross Profit Margin: Gross profit margin calculates the percentage of revenue retained after deducting the cost of goods sold, indicating the profitability of core business activities.
- Formula: (Gross Profit / Total Revenue) * 100%
- Example: If your gross profit is $50,000 and total revenue is $150,000, then the gross profit margin would be ($50,000 / $150,000) * 100% = 33.33%
- Net Profit Margin: Net profit margin measures the percentage of revenue that translates into net profit after accounting for all expenses, taxes, and interest payments.
- Formula: (Net Profit / Total Revenue) * 100%
- Example: If your net profit is $20,000 and total revenue is $100,000, then the net profit margin would be ($20,000 / $100,000) * 100% = 20%
- Return on Investment (ROI): ROI evaluates the return generated from investments relative to their cost, guiding decision-making on resource allocation and capital expenditures.
- Formula: ((Net Profit – Initial Investment) / Initial Investment) * 100%
- Example: If your net profit from an investment is $30,000 and the initial investment was $100,000, then the ROI would be (($30,000 – $100,000) / $100,000) * 100% = -70%
Liquidity Metrics
Liquidity metrics measure your company’s ability to meet its short-term financial obligations and manage cash flow effectively. Maintaining sufficient liquidity is crucial for financial stability.
- Current Ratio: The current ratio compares a company’s current assets to its current liabilities, indicating its ability to cover short-term obligations with liquid assets.
- Formula: Current Assets / Current Liabilities
- Example: If your current assets are $200,000 and current liabilities are $100,000, then the current ratio would be $200,000 / $100,000 = 2
- Quick Ratio: The quick ratio measures the company’s ability to meet short-term liabilities using its most liquid assets, excluding inventory from current assets.
- Formula: (Current Assets – Inventory) / Current Liabilities
- Example: If your current assets are $200,000, inventory is $50,000, and current liabilities are $100,000, then the quick ratio would be ($200,000 – $50,000) / $100,000 = 1.5
- Operating Cash Flow Ratio: Operating cash flow ratio evaluates the company’s ability to generate cash from its core business operations relative to its liabilities, providing insights into cash flow sustainability.
- Formula: Operating Cash Flow / Current Liabilities
- Example: If your operating cash flow is $50,000 and current liabilities are $100,000, then the operating cash flow ratio would be $50,000 / $100,000 = 0.5
Efficiency Metrics
Efficiency metrics help assess the effectiveness and productivity of your business operations. These metrics are essential for identifying areas for improvement and optimizing resource utilization.
- Inventory Turnover Ratio: Inventory turnover ratio measures how quickly inventory is sold or used within a given period, indicating the efficiency of inventory management and stock turnover.
- Formula: Cost of Goods Sold / Average Inventory
- Example: If the cost of goods sold is $500,000 and the average inventory value is $100,000, then the inventory turnover ratio would be $500,000 / $100,000 = 5
- Days Sales Outstanding (DSO): DSO evaluates the average number of days it takes for a company to collect payment from customers after a sale, highlighting the efficiency of accounts receivable management.
- Formula: (Accounts Receivable / Total Credit Sales) * Number of Days
- Example: If your accounts receivable is $50,000, total credit sales are $100,000, and the number of days in the period is 30, then the DSO would be ($50,000 / $100,000) * 30 = 15 days
- Asset Turnover Ratio: Asset turnover ratio compares the company’s sales to its total assets, indicating how efficiently assets are used to generate revenue.
- Formula: Revenue / Total Assets
- Example: If your total revenue is $1,000,000 and total assets are $500,000, then the asset turnover ratio would be $1,000,000 / $500,000 = 2
By calculating and analyzing these financial metrics regularly, you can gain valuable insights into your company’s financial performance, identify areas for improvement, and make informed decisions to drive sustainable growth and profitability.
Operational Metrics
Efficiently managing your business’s day-to-day operations requires a keen understanding of various operational metrics. These metrics provide valuable insights into the efficiency, productivity, and quality of your operational processes, allowing you to make informed decisions and drive continuous improvement. Let’s explore the different categories of operational metrics and their calculation formulas in more detail.
Production Metrics
Production metrics are essential for assessing the efficiency and effectiveness of your manufacturing or production processes. By monitoring these metrics, you can optimize resource allocation, minimize production costs, and enhance overall output.
- Cycle Time: Cycle time measures the total time required to complete a specific task or process, from start to finish. It helps identify bottlenecks and inefficiencies in the production process, allowing for targeted improvements.
- Formula: End Time – Start Time
- Example: If a production process starts at 8:00 AM and ends at 10:00 AM, then the cycle time would be 10:00 AM – 8:00 AM = 2 hours.
- Overall Equipment Effectiveness (OEE): OEE evaluates the performance, availability, and quality of production equipment. It provides a comprehensive assessment of equipment utilization and identifies opportunities for equipment optimization and maintenance.
- Formula: (Availability) x (Performance) x (Quality)
- Example: If availability is 80%, performance is 90%, and quality is 95%, then OEE would be (0.80) x (0.90) x (0.95) = 0.684 or 68.4%.
- Throughput: Throughput measures the rate at which units of a product are produced within a specific time frame. It helps gauge the efficiency of production lines and capacity utilization, enabling better production planning and scheduling.
- Formula: Total Units Produced / Time Period
- Example: If 100 units are produced in a day, then the throughput would be 100 units / 1 day = 100 units/day.
Inventory Metrics
Inventory metrics play a crucial role in managing inventory levels effectively to meet customer demand while minimizing costs and stockouts. By tracking these metrics, you can optimize inventory management practices and improve supply chain efficiency.
- Inventory Turnover Ratio: The inventory turnover ratio measures how quickly inventory is sold or used within a given period. A high turnover ratio indicates efficient inventory management and healthy sales activity.
- Formula: Cost of Goods Sold / Average Inventory
- Example: If the cost of goods sold is $500,000 and the average inventory value is $100,000, then the inventory turnover ratio would be $500,000 / $100,000 = 5.
- Days Inventory Outstanding (DIO): DIO calculates the average number of days it takes for inventory to be sold or used. It helps assess inventory turnover and identify slow-moving or obsolete inventory.
- Formula: (Average Inventory / Cost of Goods Sold) x Number of Days
- Example: If average inventory is $50,000, cost of goods sold is $200,000, and the number of days in the period is 365, then DIO would be ($50,000 / $200,000) x 365 = 91.25 days.
- Stockout Rate: The stockout rate measures the frequency and duration of inventory stockouts, indicating the effectiveness of inventory replenishment and forecasting processes. Minimizing stockouts helps maintain customer satisfaction and prevent lost sales opportunities.
- Formula: (Number of Stockouts / Total Orders) x 100%
- Example: If there were 10 stockouts out of 200 orders, then the stockout rate would be (10 / 200) x 100% = 5%.
Quality Metrics
Quality metrics are crucial for ensuring consistent product quality and customer satisfaction. By monitoring these metrics, you can identify and address quality issues proactively, improving overall product performance and brand reputation.
- First Pass Yield (FPY): FPY measures the percentage of units that pass through a production process without requiring rework or correction. A high FPY indicates efficient and effective production processes.
- Formula: (Total Units Produced – Defective Units) / Total Units Produced
- Example: If 900 units are produced with 50 defective units, then FPY would be (900 – 50) / 900 = 0.944 or 94.4%.
- Defect Rate: The defect rate calculates the percentage of defective units or products produced within a specific period. Monitoring the defect rate helps identify quality issues and implement corrective actions to improve product quality.
- Formula: (Number of Defective Units / Total Units Produced) x 100%
- Example: If 100 defective units are found in a batch of 1,000 units produced, then the defect rate would be (100 / 1,000) x 100% = 10%.
- Customer Complaint Rate: Customer complaint rate measures the frequency of customer complaints related to product quality or performance. Analyzing customer feedback and addressing quality concerns promptly is crucial for maintaining brand reputation and customer loyalty.
- Formula: (Number of Customer Complaints / Total Number of Customers) x 100%
- Example: If there were 20 customer complaints out of 1,000 customers, then the complaint rate would be (20 / 1,000) x 100% = 2%.
Supply Chain Metrics
Supply chain metrics help evaluate the performance and efficiency of your supply chain processes, from sourcing raw materials to delivering finished products to customers. By tracking these metrics, you can optimize supply chain operations, reduce costs, and improve overall performance. Here are some important supply chain metrics along with their calculation formulas:
- Order Fulfillment Cycle Time: The order fulfillment cycle time measures the total time it takes to process and fulfill customer orders, from receipt to delivery. Shortening cycle times improves customer satisfaction and enables faster order processing.
- Formula: Order Delivery Time – Order Placement Time
- Example: If an order is placed at 9:00 AM and delivered at 3:00 PM on the same day, then the order fulfillment cycle time would be 3:00 PM – 9:00 AM = 6 hours.
- Supplier Lead Time: Supplier lead time calculates the time it takes for suppliers to deliver goods or materials after receiving an order. Minimizing lead times reduces inventory holding costs and improves supply chain responsiveness.
- Formula: Date of Goods Receipt – Date of Order Placement
- Example: If goods are received on May 15th and the order was placed on May 10th, then the supplier lead time would be May 15th – May 10th = 5 days.
- Perfect Order Rate: The perfect order rate evaluates the percentage of orders that are delivered to customers on time, complete, and without errors. Achieving a high perfect order rate indicates supply chain efficiency and reliability.
- Formula: (Number of Perfect Orders / Total Number of Orders) x 100%
- Example: If there were 80 perfect orders out of 100 total orders, then the perfect order rate would be (80 / 100) x 100% = 80%.
By calculating and analyzing these operational metrics regularly, you can gain valuable insights into your business’s operational performance, identify areas for improvement, and drive continuous enhancement of your operations.
Customer Metrics
Understanding and effectively managing customer relationships is paramount for the success of any business. Customer metrics provide valuable insights into various aspects of the customer journey, enabling businesses to make informed decisions and deliver exceptional experiences. Let’s explore the different categories of customer metrics and their calculation formulas to gain a deeper understanding of customer behavior and satisfaction.
Customer Acquisition Metrics
Customer acquisition metrics help businesses evaluate the effectiveness of their marketing and sales efforts in attracting new customers. By tracking these metrics, you can assess the performance of your acquisition strategies and optimize resource allocation. Here are some key customer acquisition metrics along with their calculation formulas:
- Cost Per Acquisition (CPA): CPA measures the average cost incurred to acquire a new customer through marketing and sales activities. It includes expenses such as advertising, marketing campaigns, and sales commissions.
- Formula: Total Cost of Acquisition / Number of New Customers
- Example: If you spent $10,000 on marketing campaigns and acquired 100 new customers, then the CPA would be $10,000 / 100 = $100 per customer.
- Conversion Rate: Conversion rate calculates the percentage of website visitors or leads who take a desired action, such as making a purchase or filling out a form. It helps assess the effectiveness of your conversion optimization efforts.
- Formula: (Number of Conversions / Number of Leads) x 100%
- Example: If you received 500 leads from a marketing campaign and 50 of them converted into customers, then the conversion rate would be (50 / 500) x 100% = 10%.
- Customer Lifetime Value (CLV): CLV predicts the total revenue a customer is expected to generate over their entire relationship with your business. It helps prioritize high-value customers and allocate resources effectively.
- Formula: Average Purchase Value x Purchase Frequency x Customer Lifespan
- Example: If the average purchase value is $50, customers purchase twice a month, and the average customer lifespan is 2 years, then CLV would be ($50 x 2) x (2 x 12) = $2,400.
Customer Satisfaction Metrics
Customer satisfaction metrics gauge the level of satisfaction and happiness customers experience with your products or services. By monitoring these metrics, you can identify areas for improvement and enhance overall customer experience. Here are some important customer satisfaction metrics along with their calculation formulas:
- Customer Satisfaction Score (CSAT): CSAT measures customer satisfaction based on a survey or feedback form, usually on a scale from 1 to 5 or 1 to 10. It provides insights into customer perceptions and preferences.
- Formula: (Number of Satisfied Customers / Total Number of Survey Respondents) x 100%
- Example: If 80 out of 100 survey respondents report being satisfied, then the CSAT score would be (80 / 100) x 100% = 80%.
- Net Promoter Score (NPS): NPS assesses customer loyalty and satisfaction by asking customers how likely they are to recommend your business to others. It categorizes customers into promoters, passives, and detractors to measure overall brand advocacy.
- Formula: (% Promoters – % Detractors)
- Example: If 30% of customers are promoters and 10% are detractors, then the NPS would be 30 – 10 = 20.
- Customer Effort Score (CES): CES evaluates the ease of customer interactions with your business, such as making a purchase or resolving a support issue. It helps identify friction points in the customer journey and improve overall experience.
- Formula: (Total CES Scores / Number of Responses)
- Example: If the total CES scores from customer surveys sum up to 400 and there were 100 responses, then the CES would be 400 / 100 = 4.
Customer Retention Metrics
Customer retention metrics focus on retaining existing customers and reducing churn rates. By analyzing these metrics, you can implement strategies to increase customer loyalty and lifetime value. Here are some key customer retention metrics along with their calculation formulas:
- Churn Rate: Churn rate calculates the percentage of customers who stop using your products or services within a given period. It helps identify retention challenges and measure the effectiveness of retention strategies.
- Formula: (Number of Customers Lost / Total Number of Customers at the Beginning of the Period) x 100%
- Example: If you lost 50 customers out of 500 at the beginning of the month, then the churn rate would be (50 / 500) x 100% = 10%.
- Repeat Purchase Rate: Repeat purchase rate measures the percentage of customers who make more than one purchase from your business. It reflects customer loyalty and satisfaction with your products or services.
- Formula: (Number of Repeat Customers / Total Number of Customers) x 100%
- Example: If you have 200 repeat customers out of 1,000 total customers, then the repeat purchase rate would be (200 / 1,000) x 100% = 20%.
- Retention Cost: Retention cost calculates the expenses associated with retaining customers, including loyalty programs, customer support, and engagement initiatives. It helps assess the ROI of retention efforts.
- Formula: Total Cost of Retention Activities / Number of Retained Customers
- Example: If you spent $5,000 on retention activities and retained 100 customers, then the retention cost would be $5,000 / 100 = $50 per customer.
Net Promoter Score (NPS)
Net Promoter Score (NPS) is a widely used metric for assessing customer loyalty and satisfaction. It is based on a single question: “How likely are you to recommend our product/service to a friend or colleague?” Customers are categorized into promoters (score 9-10), passives (score 7-8), and detractors (score 0-6). The NPS is calculated by subtracting the percentage of detractors from the percentage of promoters:
NPS = % Promoters – % Detractors
A high NPS indicates strong customer advocacy and loyalty, while a low NPS may signal areas for improvement in customer experience and satisfaction.
By analyzing these customer metrics comprehensively and acting on insights gained, you can optimize your customer relationships, enhance satisfaction levels, and drive sustainable business growth.
Employee Metrics
Understanding and optimizing employee performance and satisfaction is crucial for fostering a positive work environment and achieving organizational success. Employee metrics provide valuable insights into various aspects of employee performance, engagement, and retention. Let’s explore the different categories of employee metrics and their significance in maximizing workforce productivity and satisfaction.
Employee Productivity Metrics
Employee productivity metrics measure the efficiency and effectiveness of employees in completing tasks and achieving goals. By tracking these metrics, organizations can identify top performers, optimize resource allocation, and improve overall productivity. Here are some key employee productivity metrics along with their descriptions, formulas, and examples:
- Revenue Per Employee: Revenue per employee calculates the amount of revenue generated by each employee on average.
- Formula: Total Revenue / Number of Employees
- Example: If a company generates $5 million in revenue with 100 employees, then the revenue per employee would be $5,000,000 / 100 = $50,000.
- Sales Performance: Sales performance metrics evaluate the effectiveness of sales teams in meeting targets and driving revenue.
- Formula: (Total Sales / Number of Sales Representatives) x 100%
- Example: If a sales team achieves $1 million in sales with 10 sales representatives, then the sales performance would be ($1,000,000 / 10) x 100% = $100,000 per sales representative.
- Tasks Completed Per Employee: This metric measures the number of tasks or projects completed by each employee within a given period.
- Formula: Total Number of Tasks Completed / Number of Employees
- Example: If a team completes 500 tasks in a month with 50 employees, then the tasks completed per employee would be 500 / 50 = 10 tasks per employee.
Employee Engagement Metrics
Employee engagement metrics assess the level of commitment, satisfaction, and motivation among employees. Engaged employees are more productive, creative, and loyal, leading to higher organizational performance. Here are some important employee engagement metrics along with their descriptions, formulas, and examples:
- Employee Satisfaction Score: Employee satisfaction score measures overall employee satisfaction with their job, work environment, and company culture.
- Formula: (Number of Satisfied Employees / Total Number of Employees) x 100%
- Example: If 80 out of 100 employees report being satisfied with their job, then the employee satisfaction score would be (80 / 100) x 100% = 80%.
- Employee Net Promoter Score (eNPS): eNPS measures employees’ likelihood to recommend their organization as a place to work.
- Formula: (% Promoters – % Detractors)
- Example: If 40% of employees are promoters and 10% are detractors, then the eNPS would be 40 – 10 = 30.
- Employee Engagement Survey Participation Rate: This metric measures the percentage of employees who participate in employee engagement surveys.
- Formula: (Number of Employees Participating in Survey / Total Number of Employees) x 100%
- Example: If 200 out of 300 employees participate in an engagement survey, then the participation rate would be (200 / 300) x 100% = 66.67%.
Employee Turnover Metrics
Employee turnover metrics evaluate the rate at which employees leave the organization. High turnover rates can be costly and disruptive to business operations, while low turnover rates indicate a stable workforce. Here are some key employee turnover metrics along with their descriptions, formulas, and examples:
- Voluntary Turnover Rate: Voluntary turnover rate measures the percentage of employees who leave the organization voluntarily.
- Formula: (Number of Voluntary Terminations / Total Number of Employees) x 100%
- Example: If 20 employees voluntarily leave a company with 200 employees, then the voluntary turnover rate would be (20 / 200) x 100% = 10%.
- Involuntary Turnover Rate: Involuntary turnover rate measures the percentage of employees who are terminated or dismissed by the organization.
- Formula: (Number of Involuntary Terminations / Total Number of Employees) x 100%
- Example: If 10 employees are terminated by a company with 200 employees, then the involuntary turnover rate would be (10 / 200) x 100% = 5%.
- Overall Turnover Rate: Overall turnover rate calculates the percentage of employees who leave the organization, regardless of the reason.
- Formula: (Number of Employees Who Left / Average Number of Employees) x 100%
- Example: If 30 employees leave a company with an average of 300 employees, then the overall turnover rate would be (30 / 300) x 100% = 10%.
Training and Development Metrics
Training and development metrics assess the effectiveness of employee training programs and professional development initiatives. Investing in employee development can enhance skills, knowledge, and performance, contributing to organizational growth and success. Here are some important training and development metrics along with their descriptions, formulas, and examples:
- Training ROI (Return on Investment): Training ROI measures the financial return generated from investments in employee training and development.
- Formula: (Net Training Benefits – Training Costs) / Training Costs x 100%
- Example: If training costs amount to $50,000 and the net benefits derived from training are $100,000, then the training ROI would be (($100,000 – $50,000) / $50,000) x 100% = 100%.
- Training Completion Rate: Training completion rate measures the percentage of employees who successfully complete training programs.
- Formula: (Number of Employees Who Completed Training / Total Number of Employees Enrolled in Training) x 100%
- Example: If 80 employees complete a training program out of 100 enrolled employees, then the completion rate would be (80 / 100) x 100% = 80%.
- Employee Skill Improvement Rate: This metric measures the improvement in employee skills or competencies after completing training programs.
- Formula: (Post-Training Skill Level – Pre-Training Skill Level) / Pre-Training Skill Level x 100%
- Example: If an employee’s skill level increases from 70% to 90% after training, then the skill improvement rate would be ((90% – 70%) / 70%) x 100% = 28.57%.
By tracking and analyzing these employee metrics, organizations can gain valuable insights into employee performance, engagement, and satisfaction levels. This information can inform strategic decision-making, drive continuous improvement initiatives, and create a positive work culture conducive to employee success and organizational growth.
Data Collection and Analysis
Analyzing data is crucial for making informed decisions and driving organizational success. In this section, we’ll explore the process of collecting and analyzing data, covering various data sources, tools, and techniques used for effective data analysis.
Data Sources
Data can be sourced from a variety of sources, both internal and external, to provide valuable insights into different aspects of business operations. Here are some common data sources used by organizations:
- Internal Data: This includes data generated from internal systems and processes such as customer relationship management (CRM) systems, enterprise resource planning (ERP) systems, sales databases, and employee performance records.
- External Data: External data sources encompass data obtained from outside the organization, such as market research reports, industry benchmarks, social media platforms, government databases, and third-party data providers.
- Customer Feedback: Customer feedback collected through surveys, feedback forms, online reviews, and social media platforms can offer valuable insights into customer preferences, satisfaction levels, and areas for improvement.
- Website and App Analytics: Website and app analytics tools like Google Analytics provide valuable data on website traffic, user behavior, conversion rates, and engagement metrics, helping organizations optimize their online presence and user experience.
- Sensor Data: For organizations in manufacturing, healthcare, or IoT (Internet of Things) industries, sensor data from equipment, devices, or machinery can provide insights into performance, efficiency, and maintenance needs.
Tools and Technologies
Numerous tools and technologies are available to collect, store, process, and analyze data efficiently. Here are some commonly used tools and technologies for data collection and analysis:
- Data Management Platforms (DMPs): DMPs allow organizations to collect, organize, and manage large volumes of data from various sources. They provide capabilities for data integration, cleansing, and storage, facilitating seamless data analysis.
- Business Intelligence (BI) Tools: BI tools like Tableau, Power BI, and QlikView enable organizations to visualize and analyze data to uncover insights, trends, and patterns. These tools offer interactive dashboards, reports, and data visualization capabilities for data-driven decision-making.
- Statistical Software: Statistical software such as R, Python (with libraries like pandas and numpy), and SAS are used for advanced data analysis, hypothesis testing, predictive modeling, and machine learning algorithms.
- Database Management Systems (DBMS): DBMS like MySQL, PostgreSQL, and MongoDB are essential for storing, organizing, and retrieving structured and unstructured data efficiently. They provide robust data management capabilities for large-scale data processing.
- Text Analytics Tools: Text analytics tools like IBM Watson and Lexalytics enable organizations to analyze unstructured textual data from sources such as social media, customer reviews, and surveys. These tools extract insights, sentiments, and trends from text data.
Data Analysis Techniques
Data analysis involves applying various techniques and methodologies to extract actionable insights from data. Here are some common data analysis techniques used by organizations:
- Descriptive Analysis: Descriptive analysis involves summarizing and describing the main features of a dataset, such as mean, median, mode, standard deviation, and percentiles. It provides a snapshot of historical data trends and patterns.
- Diagnostic Analysis: Diagnostic analysis aims to identify the root causes of observed trends or anomalies in data. It involves analyzing relationships between variables, conducting regression analysis, and identifying correlations to understand underlying factors influencing outcomes.
- Predictive Analysis: Predictive analysis utilizes statistical modeling and machine learning algorithms to forecast future trends, outcomes, or behaviors based on historical data patterns. It helps organizations make proactive decisions and anticipate future events.
- Prescriptive Analysis: Prescriptive analysis goes beyond predicting outcomes by recommending actions or strategies to achieve desired goals or optimize performance. It involves simulating different scenarios, conducting optimization techniques, and recommending the best course of action.
- Sentiment Analysis: Sentiment analysis examines text data to determine the sentiment or opinion expressed by users. It categorizes text as positive, negative, or neutral, allowing organizations to understand customer opinions, sentiments, and feedback.
- Cluster Analysis: Cluster analysis groups similar data points or observations into clusters or segments based on their characteristics or attributes. It helps identify patterns, segments, or customer groups within a dataset, enabling targeted marketing or personalized recommendations.
By leveraging a combination of data sources, tools, and analysis techniques, organizations can gain valuable insights into their operations, customers, and market dynamics. This enables data-driven decision-making, enhances business performance, and drives competitive advantage in today’s data-driven landscape.
How to Implement Business Metrics?
Implementing business metrics is essential for monitoring performance, identifying areas for improvement, and driving organizational success. In this section, we’ll explore the steps involved in effectively implementing business metrics, from setting objectives to continuous monitoring and adjustment.
Setting Objectives
Setting clear and measurable objectives is the foundation of effective metric implementation. Objectives should align with the organization’s overall goals and strategic priorities. Here’s how to set objectives for business metrics:
- Define Key Goals: Identify the key goals and priorities of your organization, such as increasing revenue, improving customer satisfaction, or enhancing operational efficiency.
- Identify Key Performance Areas: Determine the key areas or processes that directly contribute to achieving your goals. These could include sales, marketing, customer service, operations, and finance.
- Define Specific Metrics: Choose specific metrics that align with each key performance area and measure progress towards your objectives. Ensure that metrics are relevant, actionable, and measurable.
- Set SMART Goals: Ensure that objectives are SMART (Specific, Measurable, Achievable, Relevant, Time-bound) to provide clarity and accountability. Establish clear targets or benchmarks for each metric.
Establishing Baselines
Establishing baselines involves determining the current performance levels of selected metrics as a reference point for future comparisons. Baselines provide context and allow organizations to track progress over time. Here’s how to establish baselines for business metrics:
- Collect Historical Data: Gather historical data for each selected metric from relevant sources, such as internal systems, databases, or third-party sources. Ensure data accuracy and consistency.
- Calculate Current Metrics: Calculate the current values of selected metrics based on historical data. This provides a baseline or starting point for performance measurement.
- Analyze Trends and Patterns: Analyze historical data to identify trends, patterns, and fluctuations in performance metrics over time. Understand the factors influencing variations in performance.
- Document Baseline Metrics: Document baseline metrics and performance trends for future reference. This serves as a benchmark for evaluating progress and identifying areas for improvement.
Creating Dashboards and Reports
Creating dashboards and reports facilitates the visualization and communication of key metrics to stakeholders across the organization. Dashboards provide real-time insights into performance, while reports offer in-depth analysis and recommendations. Here’s how to create dashboards and reports for business metrics:
- Select Visualization Tools: Choose suitable data visualization tools or dashboard platforms that meet the needs of your organization. Common tools include Tableau, Power BI, Google Data Studio, and Excel.
- Design Dashboard Layout: Design intuitive and user-friendly dashboard layouts that display key metrics, trends, and performance indicators at a glance. Organize information logically and prioritize critical metrics.
- Customize Metrics Views: Customize dashboard views for different stakeholders, such as executives, managers, and frontline employees. Tailor metrics and visualizations to align with the needs and interests of each audience.
- Schedule Regular Reporting: Establish a cadence for regular reporting and updates, such as weekly, monthly, or quarterly. Ensure timely dissemination of reports to relevant stakeholders to keep them informed and engaged.
Continuous Monitoring and Adjustment
Continuous monitoring and adjustment involve regularly tracking performance metrics, identifying deviations from targets, and making necessary adjustments to strategies and operations. This ensures alignment with organizational goals and drives continuous improvement. Here’s how to implement continuous monitoring and adjustment:
- Set Monitoring Intervals: Define the frequency of metric monitoring based on the criticality and volatility of each metric. High-priority metrics may require real-time or daily monitoring, while others may be monitored weekly or monthly.
- Implement Alert Mechanisms: Implement alert mechanisms or notifications to flag significant deviations or anomalies in performance metrics. Set thresholds or triggers to automatically notify stakeholders of potential issues.
- Conduct Performance Reviews: Conduct regular performance reviews and meetings to analyze metric trends, discuss insights, and identify areas for improvement. Engage cross-functional teams to collaborate on problem-solving and decision-making.
- Iterate and Improve: Use insights gained from monitoring and analysis to iterate and improve strategies, processes, and initiatives. Implement corrective actions, optimizations, or enhancements to address performance gaps and drive continuous improvement.
By following these steps and best practices, organizations can effectively implement business metrics, aligning performance measurement with strategic objectives, and driving sustainable growth and success.
Conclusion
Mastering the art of tracking and analyzing top business metrics is the cornerstone of success for any organization. By understanding and leveraging these metrics effectively, businesses can gain valuable insights into their performance, identify areas for improvement, and make informed decisions that drive growth and profitability. Whether it’s monitoring financial health, optimizing customer satisfaction, or maximizing employee productivity, the power of data-driven decision-making cannot be overstated.
Ultimately, embracing a culture of continuous improvement and innovation, fueled by insights from key business metrics, is key to staying competitive in today’s fast-paced business landscape. By prioritizing the tracking and analysis of these metrics, organizations can navigate challenges, capitalize on opportunities, and chart a course towards long-term success. Remember, the journey to business excellence begins with a deep understanding of your key metrics and a commitment to using them to drive positive change.
Get Started With a Prebuilt Template!
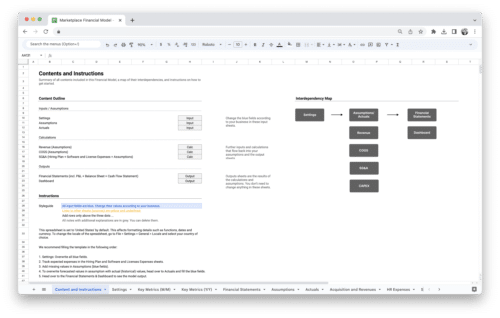
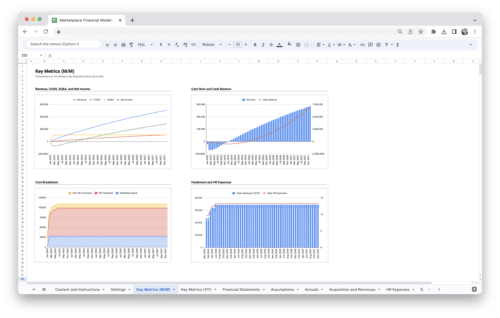
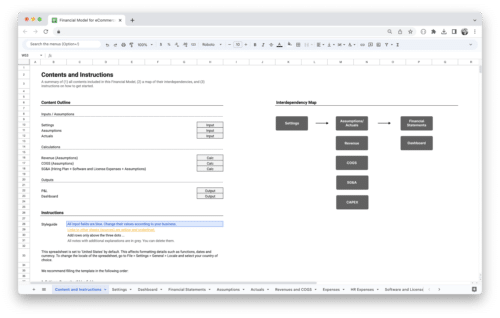
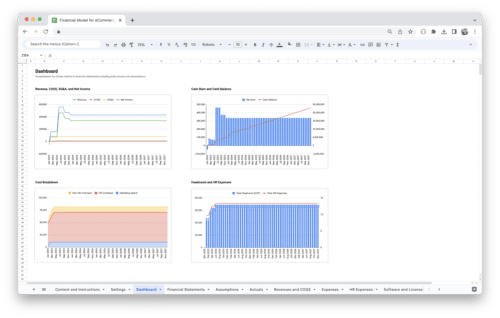
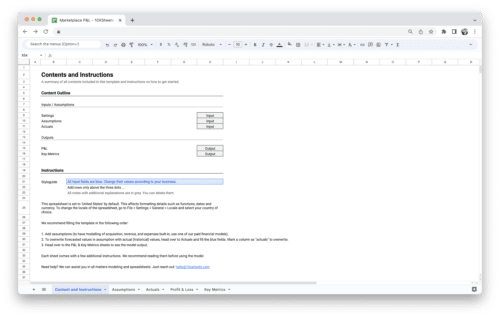
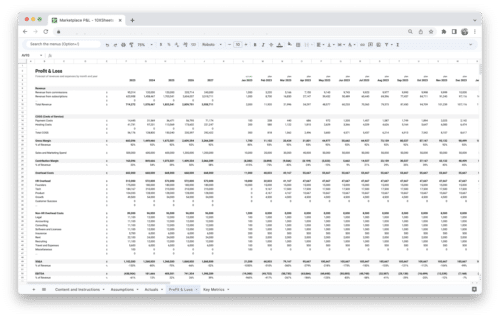
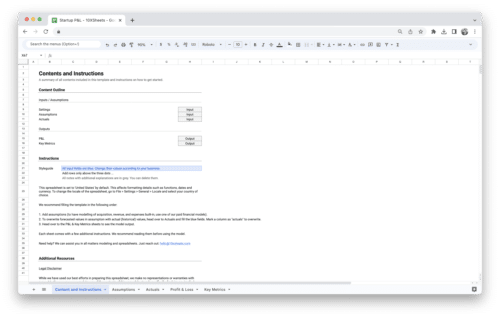
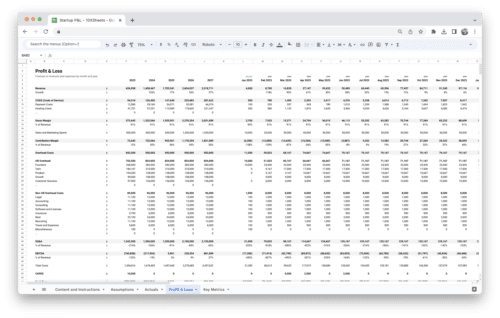
Looking to streamline your business financial modeling process with a prebuilt customizable template? Say goodbye to the hassle of building a financial model from scratch and get started right away with one of our premium templates.
- Save time with no need to create a financial model from scratch.
- Reduce errors with prebuilt formulas and calculations.
- Customize to your needs by adding/deleting sections and adjusting formulas.
- Automatically calculate key metrics for valuable insights.
- Make informed decisions about your strategy and goals with a clear picture of your business performance and financial health.

